4906
Ultra-fast balanced SSFP signal enhancement ratio mapping of the human lung parenchyma at 1.5T1Department of Radiology, Division of Radiological Physics, University of Basel Hospital, Basel, Switzerland, 2Department of Biomedical Engineering, University of Basel, Basel, Switzerland, 3Clinic of Radiology and Nuclear Medicine, Cardiac and Thoracic Imaging, University of Basel Hospital, Basel, Switzerland, 4Clinic of Thoracic Surgery, University of Basel Hospital, Basel, Switzerland, 5Clinic of Pneumology, University of Basel Hospital, Basel, Switzerland
Synopsis
In this work, we propose a new conceptual framework for functional pulmonary parenchyma imaging in the clinical setup from two volumetric ultra-fast balanced steady-state free precession (ufSSFP) breath-hold acquisitions before and after contrast agent administration. The resulting signal enhancement ratio (SER) maps of the parenchyma in patients shows similarity to SPECT/CT fusion images. The method requiring only two breath-hold acquisitions is rapid and amenable for clinical use.
Introduction
Contrast-enhanced MRI (CE-MRI) is commonly used to assess pulmonary perfusion after intra-venous injection of contrast agents in combination with heavily T1-weighted spoiled gradient-echo (SPGR) sequences, such as volume interpolated breath-hold examinations (VIBE1) CE-MRI of the lung was shown to correlate reasonably well with 99mTc-MAA SPECT2, but VIBE is mainly sensitive to larger vessels3. In contrast to SPGR, balanced steady-state free precession (bSSFP) sequences offers the highest signal-to-noise ratio (SNR) per unit of time amongst all MRI sequences4 and ultra-fast balanced SSFP (ufSSFP) has shown good prospects and parenchymal sensitivity for lung imaging5,6 at 1.5T.
The purpose of this work is to develop a new conceptual framework to map the pulmonary perfusion from two volumetric MRI scans; the first acquired before, and the second after contrast agent administration. From this, pulmonary signal enhancement ratio (SER) maps were derived and compared using VIBE and ufSSFP. SER mapping was evaluated in healthy volunteers and patients with common pulmonary disease.
Materials and Methods
MR imaging
In an on-going study eight healthy subjects and three patients with pulmonary diseases [chronic obstructive pulmonary disease (COPD), COPD + lung cancer, and non-specific interstitial pneumonia (NSIP)] underwent volumetric ufSSFP5 and VIBE breath-hold imaging at 1.5T (MAGNETOM AvantoFit, Siemens Healthineers, Germany), before and three minutes after i.v. injection of Gadobenate-Dimeglumine (for imaging parameters, cf. Table 1). The study was approved by local Ethics Committee and subjects gave informed consent.
MR post-processing
Pre- and post-contrast volumetric datasets were co-registered to spatially match lung structures by using a mass preserving three-dimensional deformable B-spline image registration algorithm (Elastix). Subsequently, the registered volumes were median filtered (kernel radius 9×9×9 mm) to remove the sparse hyperintense vasculature overlying the pulmonary parenchyma7. Finally, SER maps were calculated pixel-wise (at location $$$\vec{x}$$$ ) from the signal intensities before ( $$$\mathrm{SI_{pre}}$$$ ) and after ($$$\mathrm{SI_{post}}$$$) administration of contrast agent, using
$$ \mathrm{SER}(\vec{x})=\frac{\mathrm{SI_{post}}(\vec{x})-{\mathrm{SI_{pre}}(\vec{x})}}{{\mathrm{SI_{pre}}(\vec{x})}} $$
The step-by-step post-processing is shown in Figure 1, and was identical for ufSSFP and VIBE.
SER mapping evaluation
SER mapping was evaluated for ufSSFP and VIBE in region-of-interest (ROI) comprising lung, blood, liver, muscle, and fat. For the COPD patients, the specificity of pulmonary SER mapping was compared to 99mTc-MAA-SPECT/CT.
Results
In healthy subjects, SER maps of the lung parenchyma (Fig. 2) were homogeneous for ufSSFP, but were markedly inhomogeneous for VIBE due to low signal-to-noise. For ufSSFP, a mean pulmonary SER of 101% ± 8% (mean ± intersubject SD) was observed and was significantly higher (P<10-6) than the SER for VIBE (47% ± 13%). Furthermore, ufSSFP SER was significantly higher (P < 0.01) for the parenchyma than for the blood (83% ± 9%) and other tissues (liver 33%±9%, muscle 26%±6%, fat 3%±2%). This leads to a pronounced emphasis and clear delineation of the lung parenchyma in the ufSSFP SER maps, clearly outperforming VIBE SER mapping.
In the patients, ufSSFP SER maps were sensitive to the underlying pulmonary disease (cf. Fig. 3 and 4) and there was overall good visual correspondence between SER conspicuities and SPECT/CT. The pulmonary ufSSFP SER maps of the COPD patients (example with lung cancer shown in Fig. 3) were characterized by a lower signal enhancement but larger variability (66%±24%, mean ± SD) as compared to the normal appearing lung tissue of the healthy control group (101%±23%, mean ± intrasubject SD). Overall, a visual moderate to strong spatial correspondence between low SER regions and functionally impaired regions with low radiotracer uptake on 99mTc-MAA SPECT was observed (e.g. Fig. 3). In the patient with NSIP (Fig. 4), the fibrotic changes impairing the posterior-basal parts of both lungs resulted in a streaky SER decrease (67%±20%), as compared to the unaffected lung tissue (98%±17%).
Discussion
From two rapid volumetric pre and post contrast ufSSFP acquisitions, pulmonary SER maps provide important functional pulmonary information. Somewhat surprisingly, despite being a bSSFP sequence, due to the relaxation characteristics of the lung parenchyma ufSSFP provided better contrast enhancement with respect to T1-weighted VIBE. This aspect, in addition to the optimal signal efficiency of ufSSFP with respect to spoiled sequences, and its robustness to field inhomogeneities due to its short TR, makes it an ideal candidate for CE lung parenchyma imaging, with higher resolution and shorter scan time than e.g. VIBE.Conclusion
Requiring only two short volumetric acquisitions, ufSSFP SER mapping can be included into contrast-enhanced clinical protocols (e.g. DCE-MRI) and might provide further information about the functional integrity of the lung parenchyma, and can be used as a simple, fast and radiation-free alternative to lung perfusion SPECT/CT for patients with pulmonary perfusion abnormalities.Acknowledgements
This work was supported by a grant from the Swiss National Science Foundation (Grant No. 320030_149576) and by a Seed Grant of the International Society for Magnetic Resonance in Medicine (ISMRM) 2014.References
[1] Biederer J, Beer M, Hirsch W et al. MRI of the lung (2/3). Why ... when ... how? Insights Imaging 2012;3:355–371.
[2] Bajc M, Neilly JB, Miniati M et al. EANM guidelines for ventilation/perfusion scintigraphy?: Part 1. Pulmonary imaging with ventilation/perfusion single photon emission tomography. Eur. J. Nucl. Med. Mol. Imaging 2009;36:1356–1370.
[3] Biederer J, Both M, Graessner J et al. Lung morphology: fast MR imaging assessment with a volumetric interpolated breath-hold technique: initial experience with patients. Radiology 2003;226:242–249.
[4] Scheffler K, Lehnhardt S. Principles and applications of balanced SSFP techniques. Eur. Radiol. 2003;13:2409–2418.
[5] Bieri O. Ultra-fast steady state free precession and its application to in vivo 1H morphological and functional lung imaging at 1.5 tesla. Magn. Reson. Med. 2013;70:657–663.
[6] Heye T, Sommer G, Miedinger D et al. Ultrafast 3D balanced steady-state free precession MRI of the lung: Assessment of anatomic details in comparison to low-dose CT. J. Magn. Reson. Imaging 2015;42:602–609.
[7] Bieri O. A Method for Visualization of Parenchyma and Airspaces from 3D Ultra-Fast Balanced SSFP Imaging of the Lung at 1.5T. In: Proc. Intl. Soc. Mag. Reson. Med. 22; 2014. p. 2300.
[8] Pusterla O, Bauman G, Bieri O. Balanced SSFP pulmonary signal enhancement after contrast agent injection. Proc. Intl. Soc. Mag. Reson. Med. 24; 2016:2916.
Figures
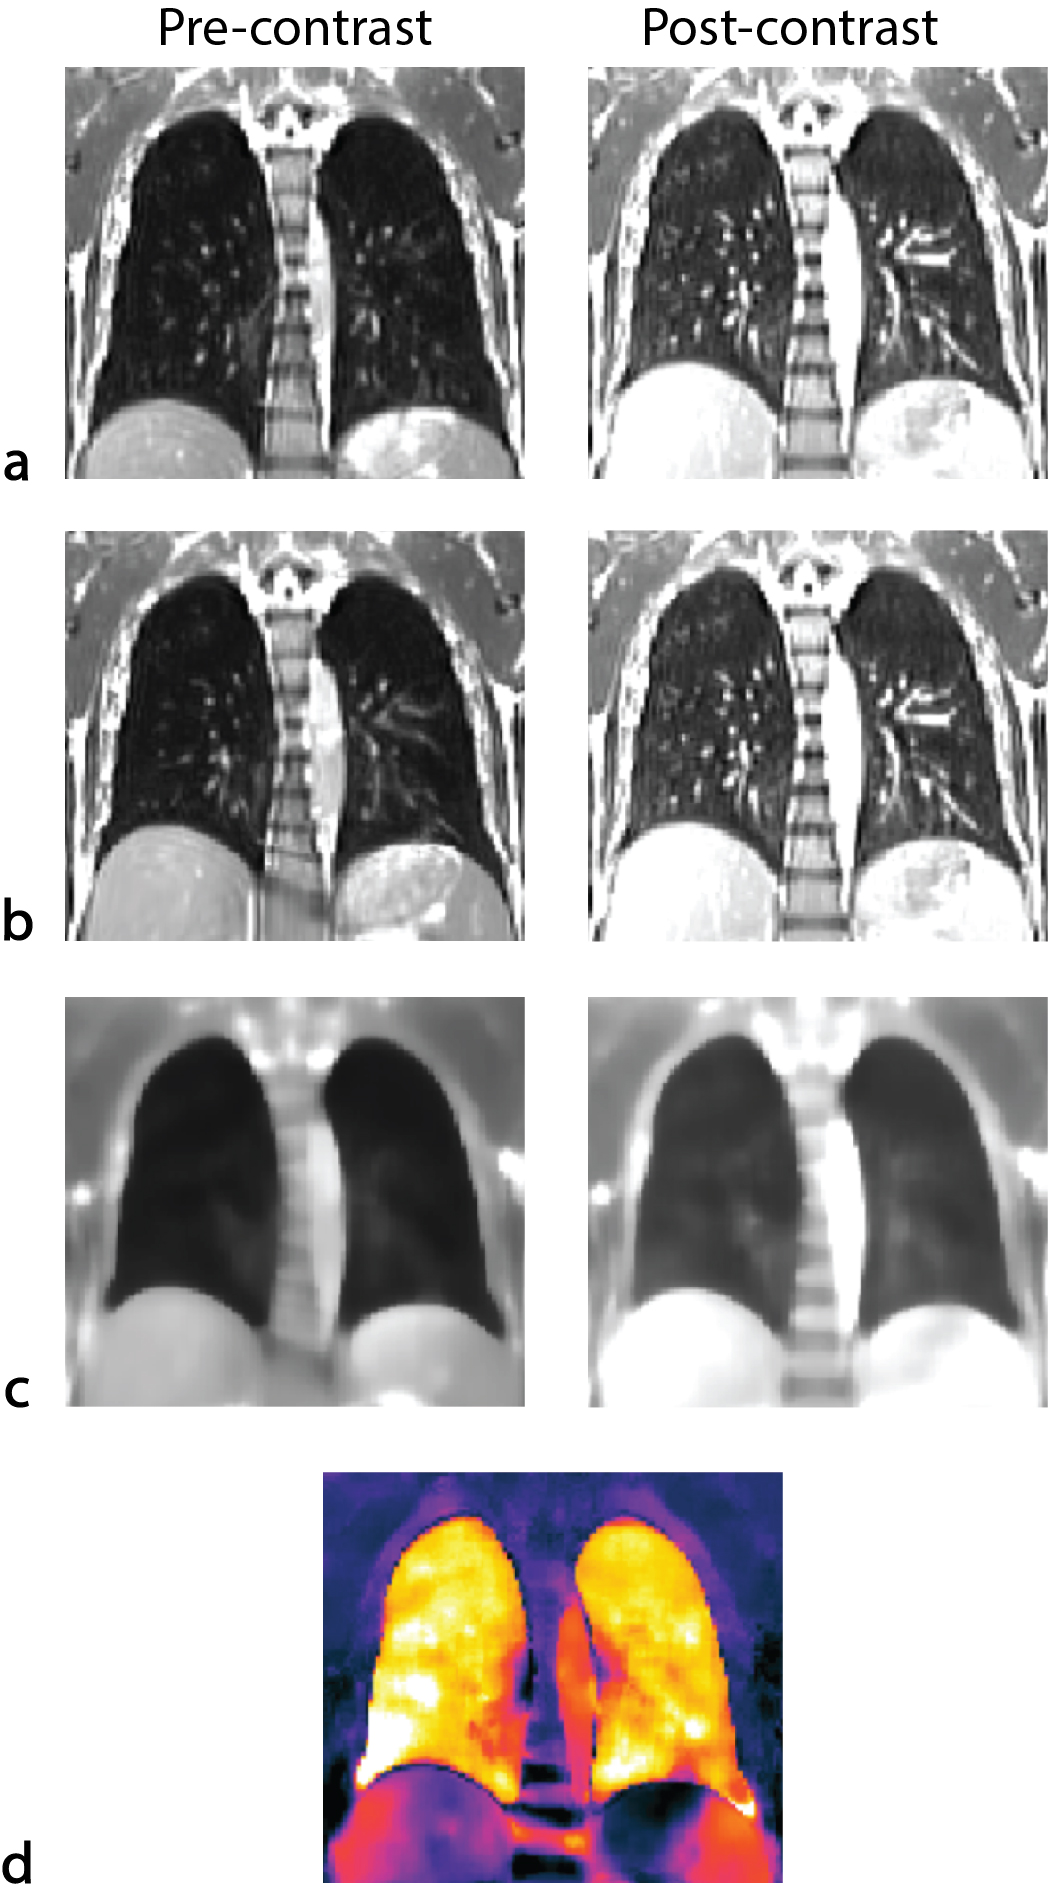
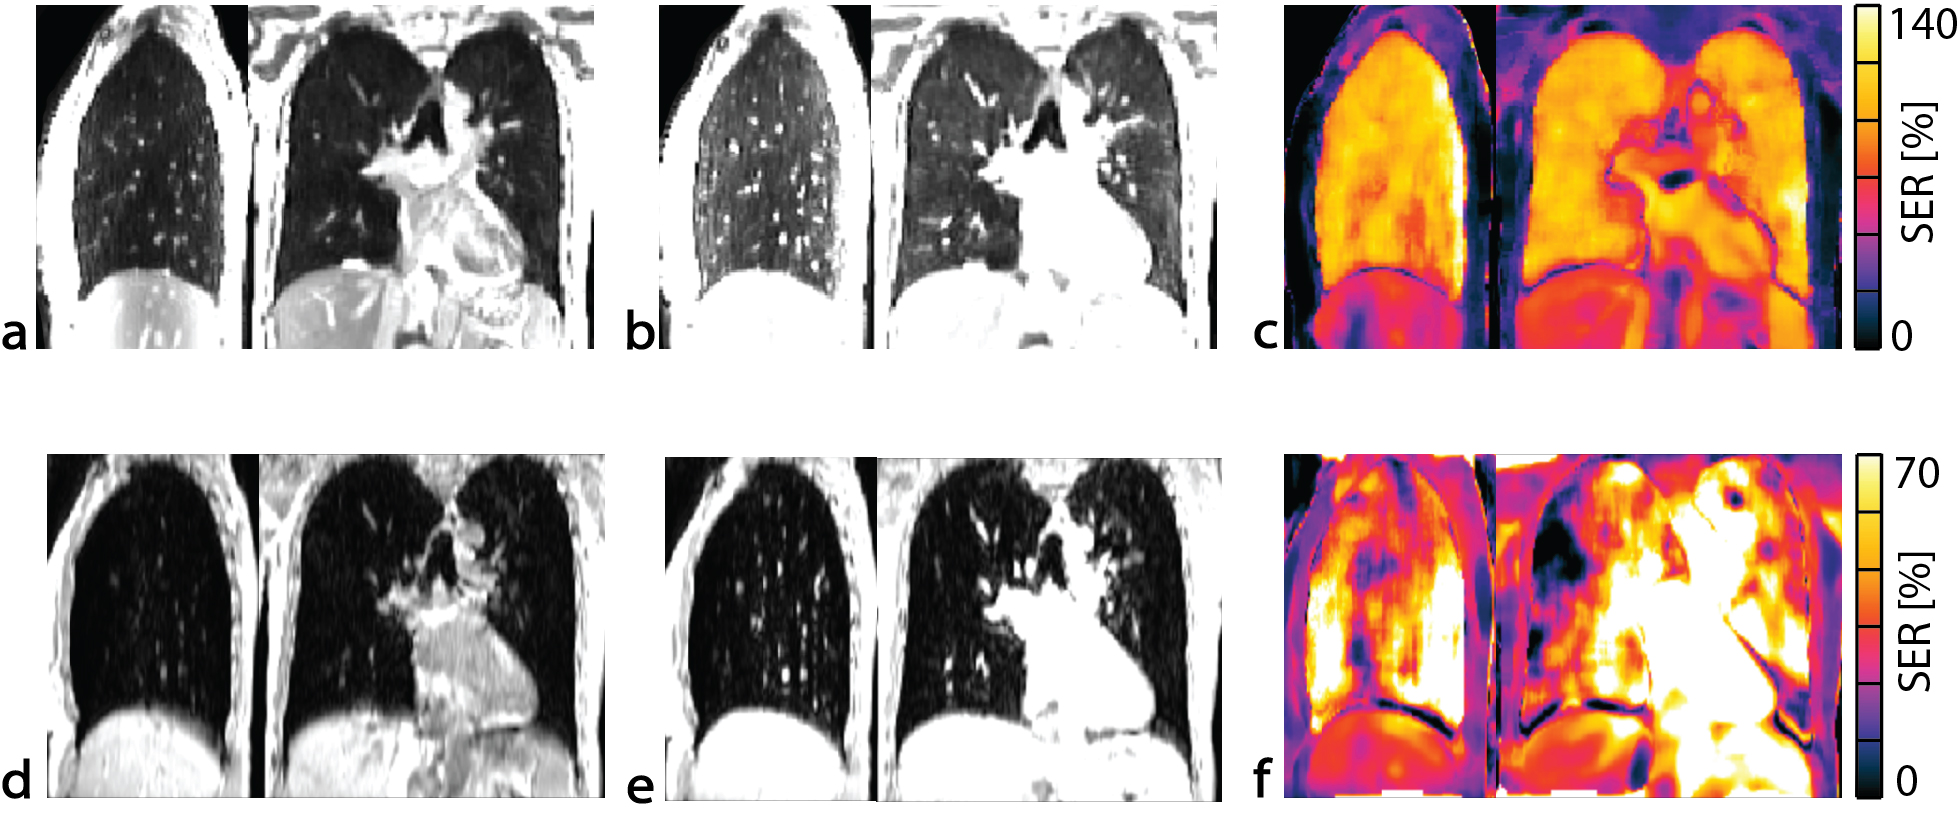

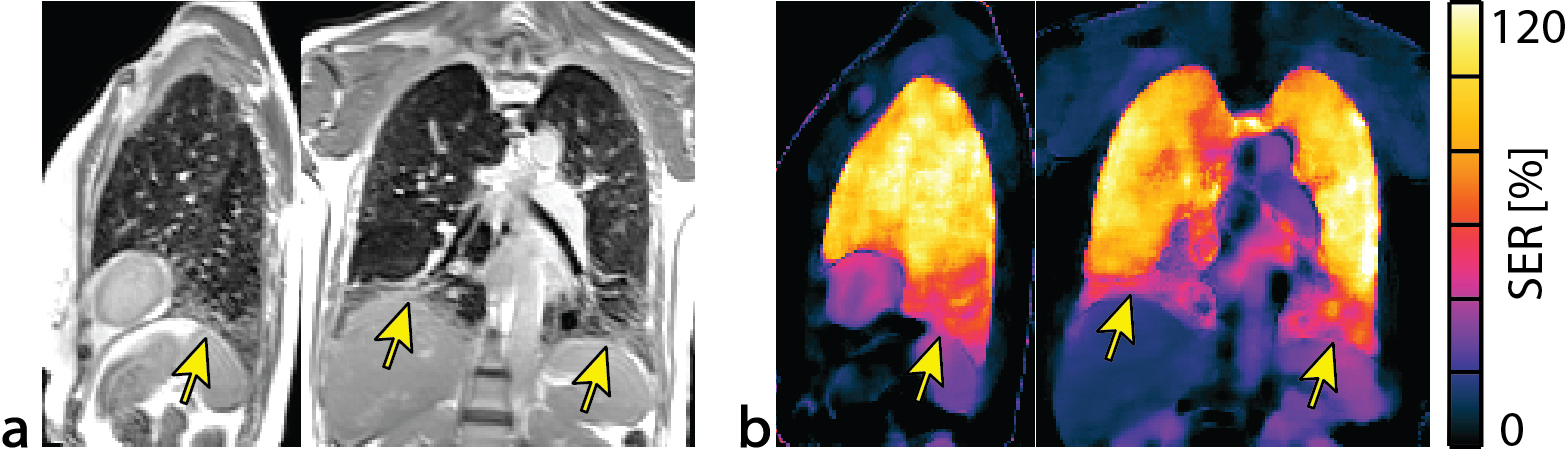
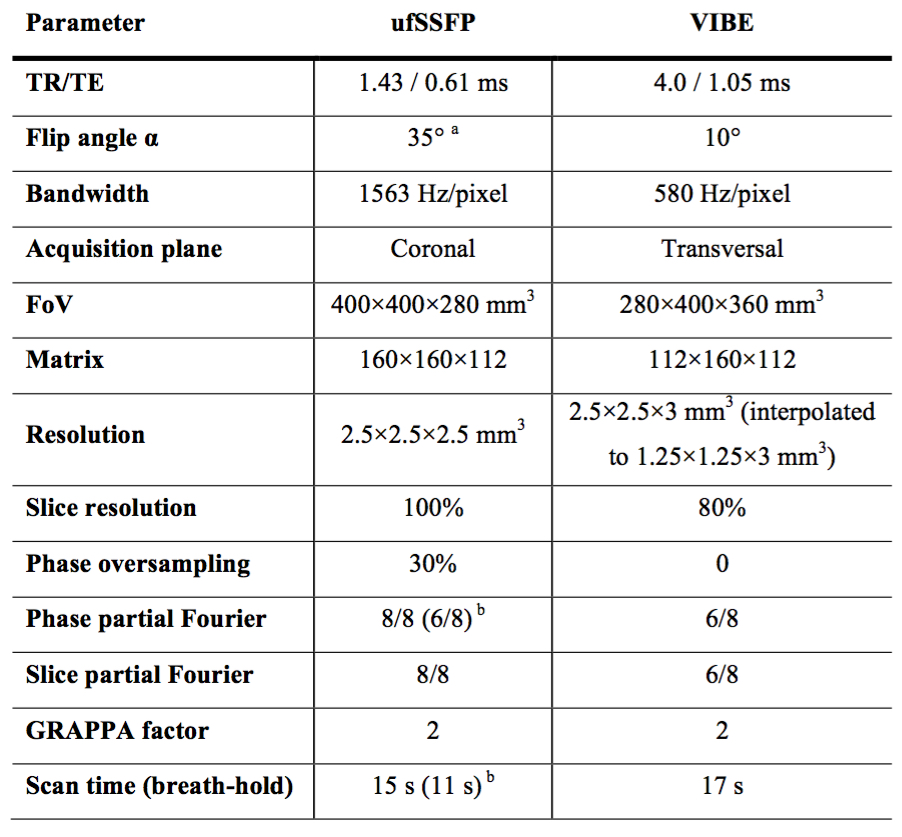
Table 1. Parameters of the ufSSFP and VIBE pulse sequences.
a Optimized for maximal lung signal intensity8.
b Acquisition time shortened by technicians, if necessary.