4905
4D and 2D phase-contrast MRI for the evaluation of pulmonary artery hemodynamics in patients with pulmonary hypertension and healthy volunteers1Clinic for Radiology and Nuclear Medicine, University Hospital Schleswig-Holstein, Lübeck, Germany, 2Medical Clinic III, Pulmonology, University Hospital Schleswig-Holstein, Lübeck, Germany
Synopsis
2D and 4D phase-contrast MRI (PC MRI) has been subject of recent studies to noninvasively diagnose pulmonary hypertension. The aim of this study was to compare values derived from both imaging techniques in a study collective consisting of healthy volunteers and patients with PH. Although 4D PC MRI generates higher quantitative values in comparison to 2D PC MRI, both sequences were able to distinguish volunteers from patients. In addition, 4D PC MRI visualized blood flow, underlining its additional value to detect secondary flow patterns in patients.
Background and Purpose
Diagnosis of pulmonary hypertension (PH) is based on an elevated mean pulmonary artery pressure (mPAP), which requires invasive right heart catheterization carrying the risk of complications. Hence, noninvasive methods of detecting PH are of great interest not only for diagnosis stating but particularly for monitoring of therapy efforts. Previous studies focused on 2D or 4D phase-contrast magnetic resonance imaging (2D PC MRI, 4D Flow-MRI) to diagnose PH, concentrating on changes in vessel anatomy1 or secondary flow patterns2-4. 2D PC MRI is widely used in clinical routine, whereas 4D Flow-MRI is still limited to experimental studies. Both methods allow the assessment of various hemodynamic and geometric parameters. Therefore, it was the aim of this work to compare 2D and 4D PC MRI in the pulmonary vessels in healthy volunteers and in patients diagnosed with PH with respect to previously established parameters to distinguish healthy volunteers from patients.Methods
MRI scans were performed in 11 patients with PH [“Pat”, 4 female, age, 63±15years], 15 age-matched healthy volunteers [“Vol”, 9 female, 56±11y], and 20 young healthy volunteers [13 female 23±2years] at 3T (Philips Achieva) with a 20 channel body surface coil after IRB approval and written informed consent. For 4D PC MRI, a retrospectively ECG-gated phase-contrast sequence with referenced Cartesian acquisition, SENSE, adaptive respiratory gating, Venc=100-120cm/s was used. Spatially, an acquired isotropic resolution of 2.0-2.4mm was interpolated to 2mm, temporally 20 frames were reconstructed resulting in an effective temporal resolution of 36-67ms. The acquisition time for 4D PC MRI ranged between 9-16 minutes. For 2D PC MRI, a one-directionally velocity encoded (“through-plane”) referenced sequence was used during breathhold. Typical imaging parameters were Venc=80-120cm/s and an isotropic resolution of 2.0mm in an axial slice placed perpendicular to the main pulmonary artery (MPA). 40 phases were reconstructed resulting in a temporal resolution of 17-34ms.
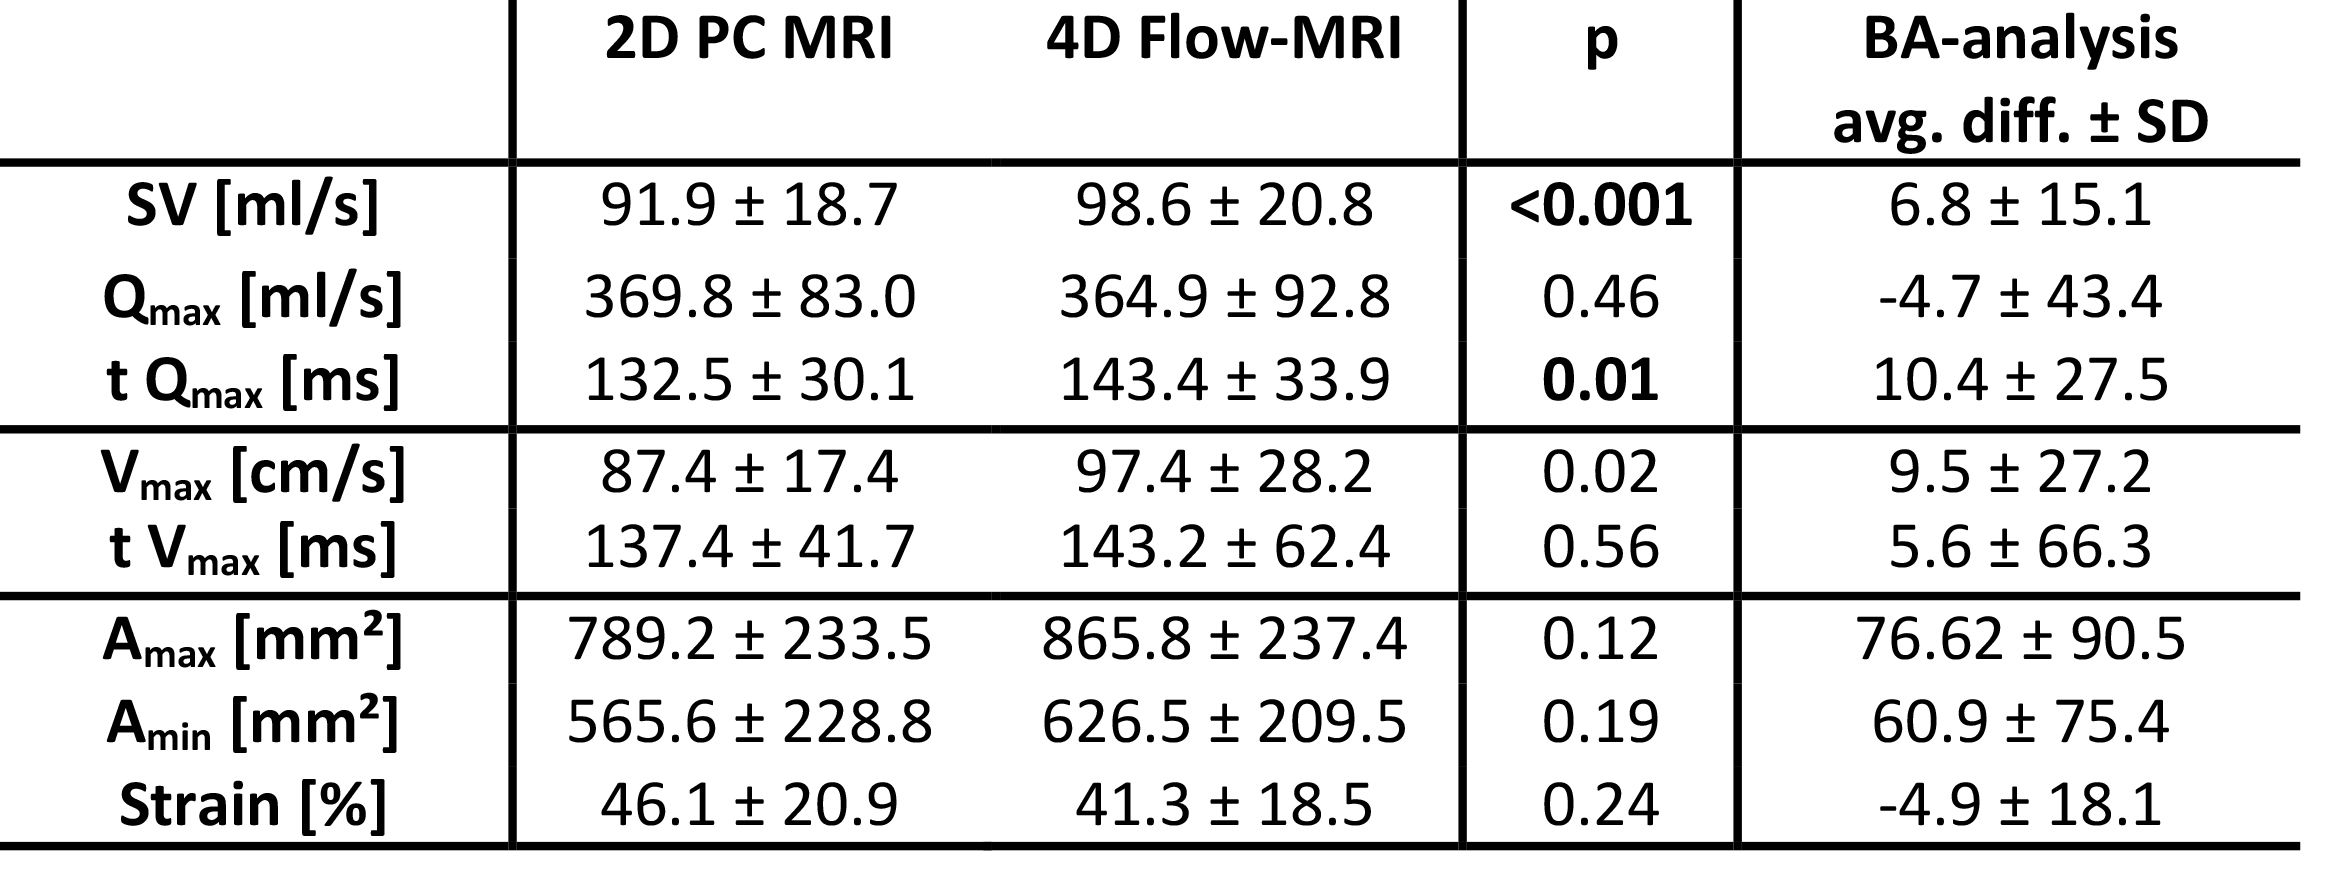
Data analysis was achieved using GTFlow (v2.2.6, GyroTools, CH). Slice location and vessel wall segmentation of 2D PC MRI was co-registered in the 4D volume, ensuring exact comparability of data. The following parameters relevant to PH diagnosis as demonstrated by Sanz et al.1 were extracted for further analysis: stroke volume (SV [ml/s]), max. velocity (Vmax [cm/s]), max. flow (Qmax [ml/s]), and their temporal maximum (t Vmax and t Qmax, respectively; [ms]), and maximum and mininum vessel area (Amin, Amax, respectively; [mm2]). Strain [%] was calculated as 100*(Amax-Amin)/Amin1.
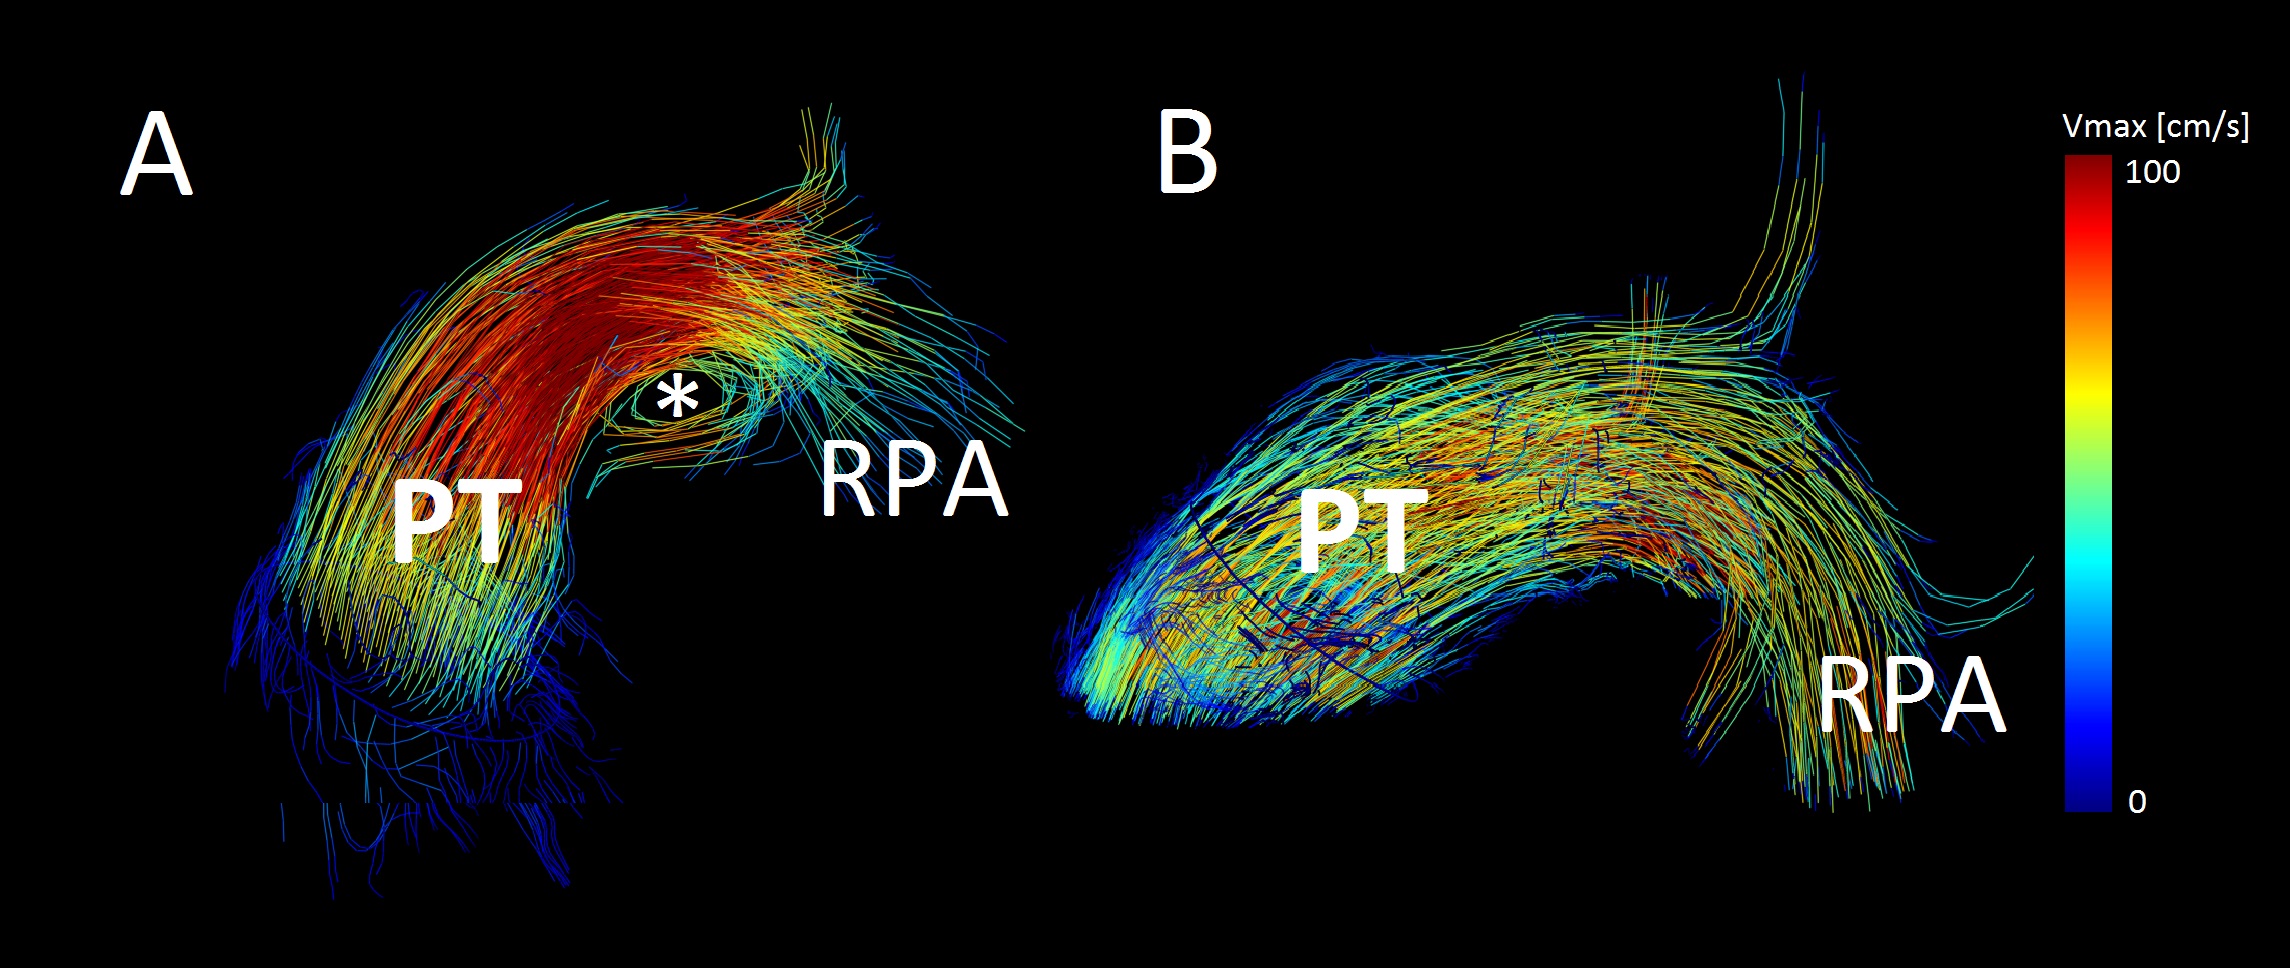
Statistical analysis included Student’s t-test, p<0.05 indicating statistical significance and Bland-Altmann (BA) analyses. In addition, flow was visualized in the 4D image volume employing streamlines, particle traces and 3D vectors, using contours as seed points.
Results
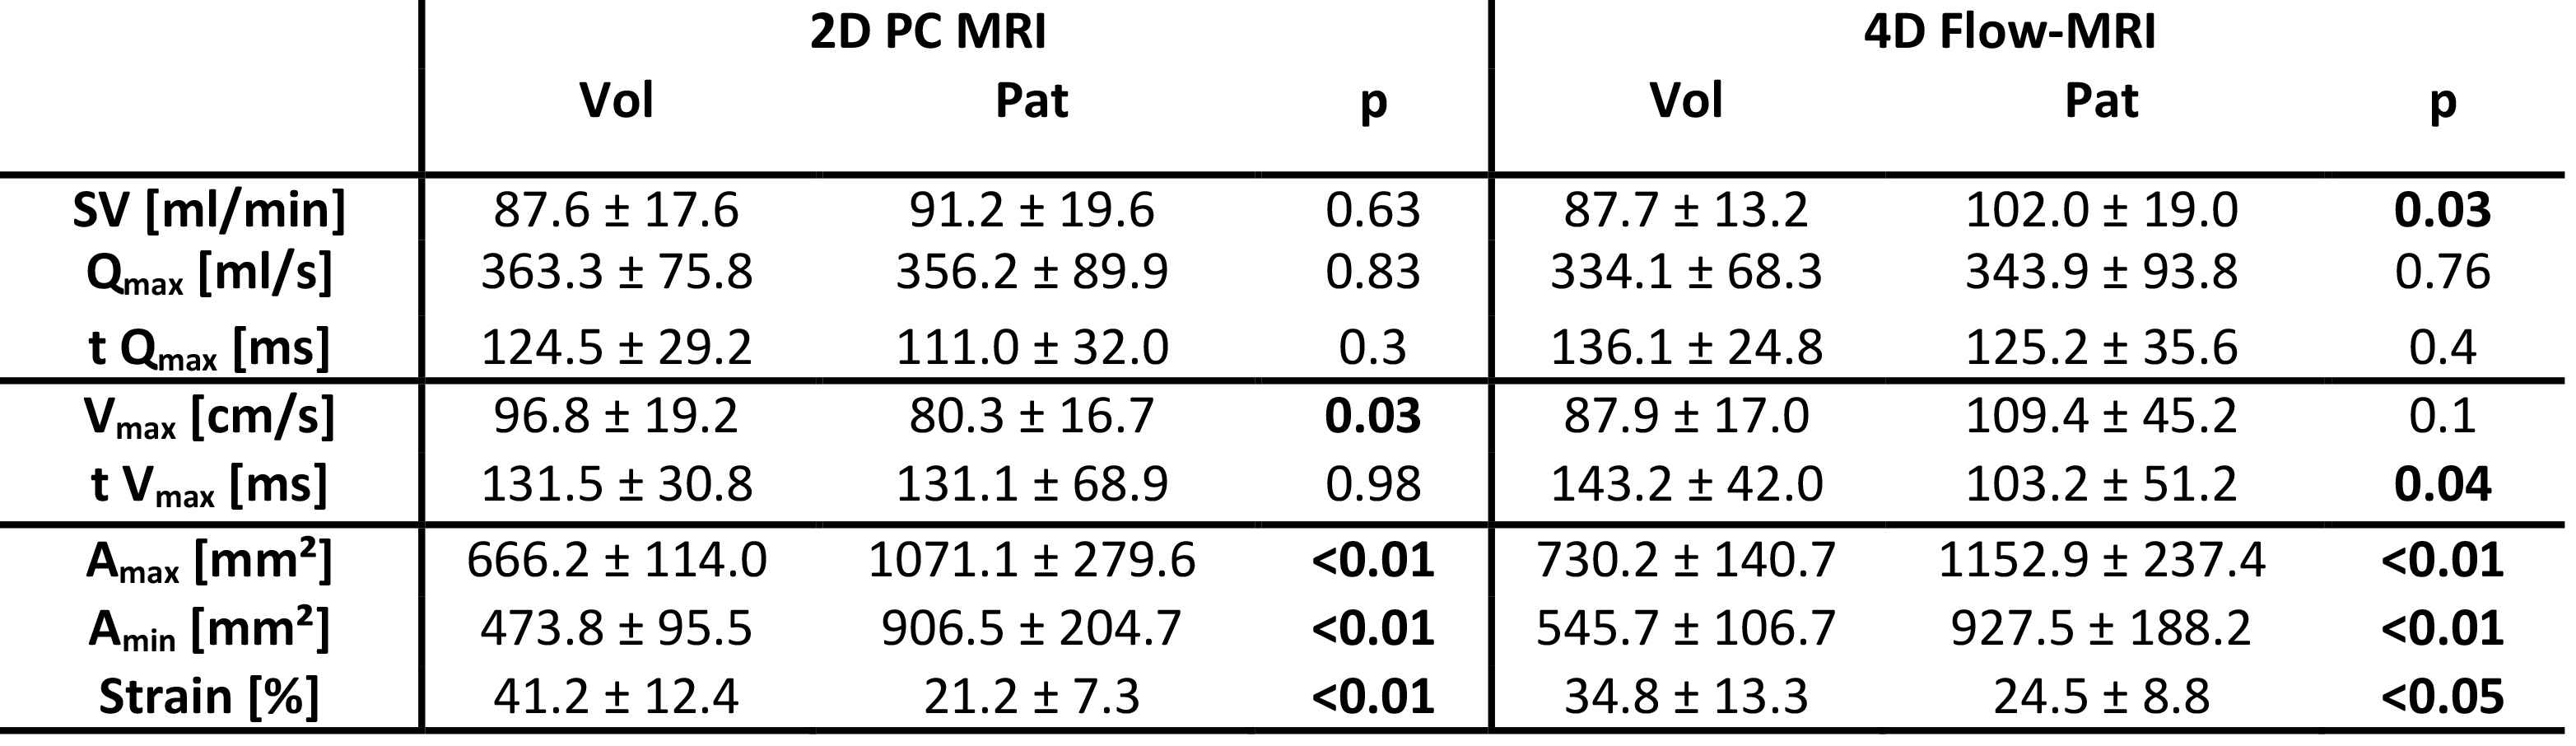
Table 1 summarizes overall results across all participants. Overall, there was good agreement between 2D and 4D PC MRI results of the whole study group with a tendency of 4D PC MRI to generate higher values in comparison to 2D PC MRI. However, SV and t Qmax revealed differences that showed statistical significance. The tested average Bland Altman difference was acceptably small. Table 2 provides an overview of the comparison between patients with pulmonary hypertension and age-matched volunteers. Both 2D and 4D PC MRI revealed concordant trends to differentiate patients from healthy individuals with area-measurements and strain analysis reaching statistical significance for both techniques. Secondary vortices2-4 were detected in the distal MPA, occurred in 9 patients and 2 volunteers. Resulting in a sensitivity of 81,8% and a specificity of 95,7% for detection of PH (see also Figure 1).Discussion and Conclusion
This study confirms that hemodynamic parameters used for the diagnosis of PH can be achieved using 4D PC MRI within reasonable clinical limits of agreement. Importantly, despite its unfavorable spatial and lesser temporal resolution, the identification of diseased study participants was possible. Both spatial and temporal resolution and the suboptimal signal-to-noise ratio in 4D PC MRI data can be made responsible for differences between both techniques. The diagnostic power of the 4D PC MRI sequence regarding the diagnosis of PH will be subject to ongoing studies exploiting the comprehensive nature of the data.Acknowledgements
No acknowledgement found.References
1. Sanz J, Kuschnir P, Rius T, Salguero R et al. Pulmonary arterial hypertension: noninvasive detection with Phase-Contrast MR imaging. Radiology. 2007;243(1):70 -9.
2. Reiter G, Reiter U, Kovacs G et al. Magnetic resonance-derived 3-dimensional blood flow patterns in the main pulmonary artery as a marker of pulmonary hypertension and a measure of elevated mean pulmonary arterial pressure. Circ Cardiovasc Imaging. 2008;1(1):23-30
3. Reiter G, Reiter U, Kovacs G et al. Evaluation of elevated mean pulmonary arterial pressure based on magnetic resonance 4D velocity mapping comparison of visualization techniques. PLoS One, 2013. 8(12): p. e82212.
4. Reiter G, Reiter U, Kovacs G et al. Blood flow vortices along the main pulmonary artery measured with MR imaging for diagnosis of pulmonary hypertension. Radiology. 2015;275(1):71-9.
Figures