4901
Evaluation of Regional Lung Function in Interstitial Lung Disease with Hyperpolarized Xenon-129 Lung 3D SB-CSIJaime Mata1, Kun Qing1, Nicholas Tustison1, Tallisa Altes1,2, John Mugler1, Michael Shim1, Lucia Flors1, Grady Miller1, and Borna Mehrad1
1University of Virginia, Charlottesville, VA, United States, 2University of Missouri, MO, United States
Synopsis
3D Single-Breath Chemical Shift Imaging (3D SB-CSI) is capable of non-invasively assessing regional lung ventilation and gas uptake/exchange within a single breath-hold, typically less than 10 seconds. From this study, we present preliminary clinical results of 3D SB-CSI from healthy and interstitial lungdisease (ILD) subjects. Having novel information on regional changes in ventilation and gas uptake/exchange allows for a better understanding of lung physiology, disease progression, and treatment efficacy.
Introduction
3D Single-Breath Chemical Shift Imaging (3D SB-CSI) is capable of non-invasively assessing regional lung ventilation and gas uptake/exchange within a single breath-hold typically less than 13 seconds. This method uses a combination of MR spectroscopic imaging and hyperpolarized xenon-129 gas (HP Xe-129) to detect MR spectral peaks corresponding to Xe-129 dissolved in the lung parenchyma (tissue) and red blood cells (RBCs) [1-2]. From this study, we present preliminary clinical results of 3D SB-CSI from healthy and subjects with the histologic or radiographic diagnosis of Usual Interstitial Pneumonia (UIP), the most common and dangerous form of interstitial lung disease.Methods
A total of 18 subjects: 8 healthy (27 ± 10yo) and 10 UIP (66 ± 12yo), underwent HP Xe-129 3D SB-CSI and 2D GRE, acquired on two separate breath-holds using same volume of HP Xe-129. Imaging was performed on a 1.5T clinical system (Avanto, Siemens Medical Solutions) with a transmit/receive RF coil (Clinical MR Solutions) tuned to the frequency of Xe-129. Enriched (~87%) Xe-129 was polarized to ~35%, using a commercial Xe-129 polarizer. The 3D SB-CSI sequence parameters were, TR/TE: 23.3ms/1.0ms, matrix: 128x128x6 voxels (after in-plane interpolation), FOV: 280-320mm2, and slice thickness: 20-25mm. Matlab (Mathworks, Natick, MA) was used for all post-processing of 3D SB-CSI using method described in [2]. Segmentation and analysis of the 2D GRE images was done using the ANTs package [3].Results
Three peaks were typically found in the HP Xe-129 3D SB-CSI spectrums of healthy subjects: gas (0 ppm), tissue (197 ppm), and RBC (216 PPM) (Fig. 1). Subjects with UIP had significantly increased volumes of ventilation defects, when compared with healthy subjects (p < 0.02). Healthy subjects had 15.39 ± 6.3 % of their total lung volume occupied by ventilation defects, while UIP subjects had 28.05 ± 6.4% of their total lung volume occupied by ventilation defects (Fig. 2). Additionally healthy subjects tended to have their FVC, 4.87 ± 0.7, and total volume calculated from the ventilation images, 4.25 ± 0.3, be in agreement ( p > 0.20), while UIP subjects had lower FVC values, 2.37 ± 0.7, compared to the total volume calculated from the ventilation images, 2.87 ± 0.84, ( p < 0.05). The average Tissue/Gas ratio and RBC/Gas ratio was significantly different between healthy and UIP subjects. The average Tissue/Gas ratio was significantly higher in UIP subjects, 1.38 ± 0.241, than healthy subjects, 1.07 ± 0.159, (p < 0.05). The average RBC/Gas ratio was significantly lower in UIP subjects, 0.234 ± 0.077, than in healthy subjects, 0.43 ± 0.070, (p < 0.05). The average Tissue/RBC was significantly higher in UIP subjects, 6.96 ± 2.286, than in healthy subjects, 2.61 ± 0.491, (p < 0.05) (Fig.3). While the ratio maps (Fig. 3) were of primary interest, additional insights could be gained from regionally probing the T2* and chemical shift of the Tissue and RBC compartments. Unlike direct dissolved-phase imaging techniques, 3D SB-CSI is able to regionally probe and generate maps describing these T2* and chemical shift parameters. Interestingly, regions with higher values in the RBC T2* map corresponded well with regions of higher Tissue/RBC ratios. A significant correlation was found between the RBC T2*and Tissue/RBC ratio (R = 0.84, p < 0.05). However, regional variations in the RBC T2* maps did not account for all heterogeneities observed in the Tissue/RBC maps. UIP subjects had a significantly larger average Tissue T2*, 2.20 ± 0.099 ms, than healthy subjects, 2.07 ± 0.070 ms, (p < 0.05). Similarly, the average RBC T2* was significantly larger in UIP subjects, 1.8 ± 0.04 ms than in healthy subjects 1.7 ± 0.020 ms , (p < 0.05). Ground glass opacity scores from HRCT was significantly correlated with the Tissue/RBC ratio (Fig. 4), and regions of high Tissue/RBC ratios were well-matched with regions of fibrosis and opacities in HRCT images (Fig. 4). The good agreement between the Tissue/RBC ratio and HRCT images supported that the regional heterogeneities indicating gas exchange impairment in the Tissue/RBC maps were strongly linked to the presence of fibrosis as seen in the HRCT images.Conclusion
HP Xe-129 3D-SBCSI is a promising clinical tool that has been shown to be capable of non-invasively assessing regional lung ventilation and gas exchange. By acquiring the full HP Xe-129 spectrum for each voxel, 3D SB-CSI provides unique spectral information, such as chemical shifts and T2* of the Tissue and RBC peaks, that can be potentially exploited to gain further insights into regional blood oxygenation and mechanisms of gas exchange impairment.Acknowledgements
Supported by NIH grant R01 CA172595-01 and Siemens Medical Solutions.References
[1] Mata J. ISMRM, Stockholm, 2010. [2] Guan et al. ISMRM, Singapore, 2016. [3] Tustison, N. et al., MRI 2011.Figures
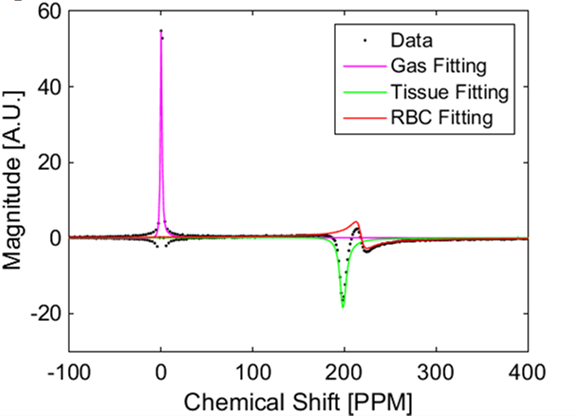
Figure 1: The fittings for each peak were superimposed on the real part
of the acquired data. Differences in the amplitude, width, chemical shift, and
phase of each individual peak can be seen.
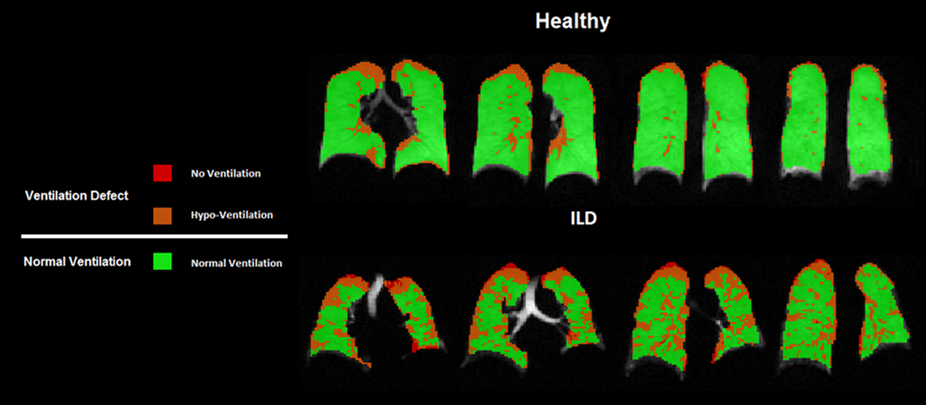
Figure 2: Comparison of the segmented ventilation images for a healthy
and UIP subject. The healthy subject has
mainly areas of normal ventilation, with ventilation defects located on the upper
lobes of the lungs probably due to poor RF coil coverage. In UIP subjects, the ventilation defects
increased in size and encroach further towards the center of the lung,
occupying 35.1% of the total lung volume for this subject.
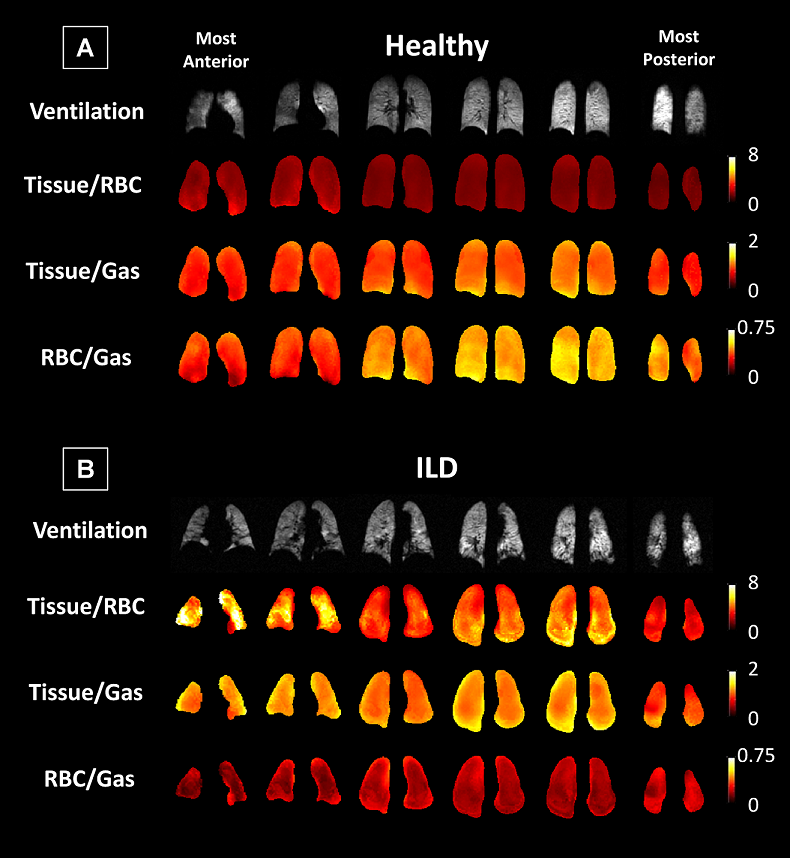
Figure 3: Coronal maps of Xe-129 ventilation images and 3D-SBCSI
Tissue/RBC, Tissue/ Gas, and RBC/Gas maps in a (A) healthy and (B) UIP subject.
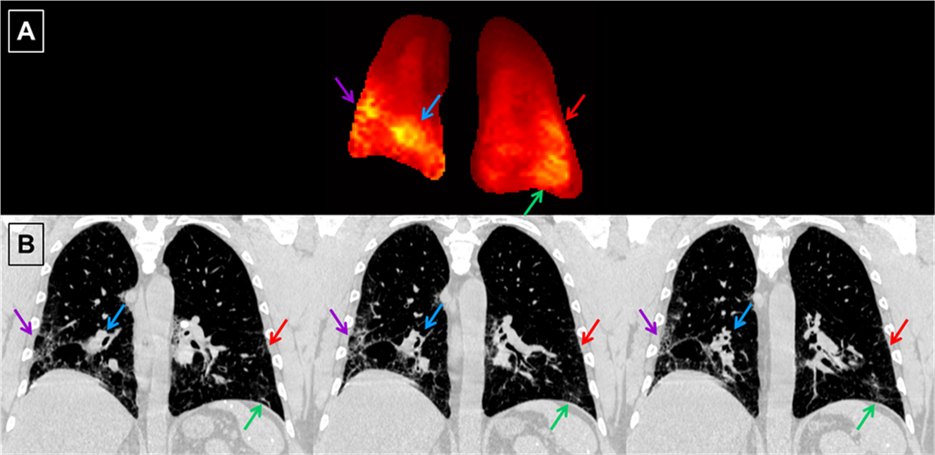
Figure 4: (A) Central coronal slice of the Tissue/RBC maps from a
single UIP subject. (B) Spatially matched coronal HRCT images of the same UIP subject.
Due to the difference in the slice thickness between the Tissue/RBC maps (15
mm) and HRCT images (0.7 mm), information from multiple nearby HRCT images
could appear in a single slice of the Tissue/RBC maps. Arrows point to regions
of high ratios in the Tissue/RBC maps and their corresponding regions of
fibrosis and opacities in the HRCT images.