4899
Free Breathing Regional Alveolar Ventilation Quantification - comparison to Fractional Ventilation derived by Fourier Decomposition Lung MRI1Institute of Radiology, Hannover Medical School, Hannover, Germany, 2Biomedical Research in Endstage and Obstructive Lung Disease Hannover (BREATH), Hannover, Germany
Synopsis
Fourier Decomposition (FD) is able to assess lung ventilation and perfusion in one free breathing measurement without any contrast agent. To establish a ventilation-perfusion (VQ) scan robust measurements and absolute quantification is required. Unlike for absolute perfusion quantification, there has been only little success regarding absolute ventilation quantification using FD MRI. Borrowing concepts from oxygen enhanced imaging a regional alveolar ventilation measurement in free breathing is introduced. This method is compared with Fractional Ventilation (FV) and tested for physiological plausibility by assessment of volunteers in supine and prone position. The results show good agreement with available literature and show a similar gravitational behaviour as FV.
Purpose
Lung ventilation imaging, which does
not require hyperpolarized gases gained interest during the last years. The
most known technique - Fourier Decomposition (FD)1 is carried out in
free-breathing without any contrast agent and offers perfusion and ventilation mapping
in one measurement. Since one important goal is to establish a VQ scan, FD is a valuable candidate for clinical translation in the future.
Although there are already methods for absolute perfusion quantification2,
ventilation is usually quantified using FV3,4,
which is only a relative measurement. In this study, similarly to
oxygen-enhanced MRI5, the proton density is measured in the lung by
acquisition of two FD acquisitions with different echo times and quantified using a phantom to calculate Alveolar Ventilation (AV).
Thus the study purpose was
to test the feasibility of absolute ventilation quantification method in
free-breathing in prone and supine position in comparison to FV derived by FD
MRI.
Methods
Six healthy volunteers (3 female and 3 male, age 24-51) were enrolled in this study. Scans in prone and supine position were performed on a 1.5T scanner. A gadolinium doped water phantom (matching a lung T1 of approx. 1200ms) was situated on or under the subject’s chest depending on the posture during the scan as a reference for proton density quantification. A sagittal slice of the right lung was measured in free breathing using a 2D spoiled gradient echo sequence for two different echo times (TE1=0.82ms, TE2=1.3ms, FOV 50x50cm2, Matrix size=128x128, Slice thickness=15 mm, TR=3ms, bandwidth=1500 Hz/pixel, FA=5°, GRAPPA=2) over a period of 48s at a temporal resolution of 192ms. The measurement was repeated with the body coil. All images were registered by Advanced Normalization Tools6 towards the intermediate respiratory image. The exponential decay model was used to determine the proton density weighted signal S0, using the averaged signal S in inspiration and expiration:$$S = S_{0}e^{-TE/T2^{*}}.$$ Next, the body coil acquisition was used to calculate a coil sensitivity profile and used for correction of S0. Using the phantom the water content in the S0 images was calculated. Assuming that the air content can be approximated by (1–water density) and a known voxel volume, the AV in mm/min/ml can be calculated from the air difference (expressed in ml) between expiration and inspiration multiplied by the breathing frequency. Alternatively, AV with units of ml per breath per ml was calculated to calculate a respiratory rate independent AV. The FV was determined using the mean expiration and inspiration image according to Zapke et al.3: $$FV = \frac{S_{Exp} - S_{Insp}}{S_{Exp}}.$$ The lung parenchyma region of interest (ROI) was segmented to evaluate FV and AV. The ROI was divided into quarters (ventral, mid-ventral, mid-dorsal and dorsal), for which mean FV and AV values were calculated. The mean of all subjects was calculated for each quarter and used to determine the slope as follows: $$Δ = \frac{Val_{1} – Val_{2}}{Val_{1}}*100,$$ where Val1 represents FV or AV in ventral quarter and Val2 represents FV or AV in the dorsal quarter of the ROI.Results
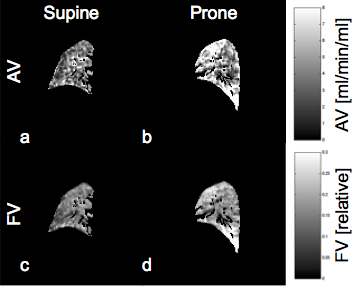
Figure 1 shows AV and FV maps of exemplary volunteer in prone and supine position. Similar ventilation
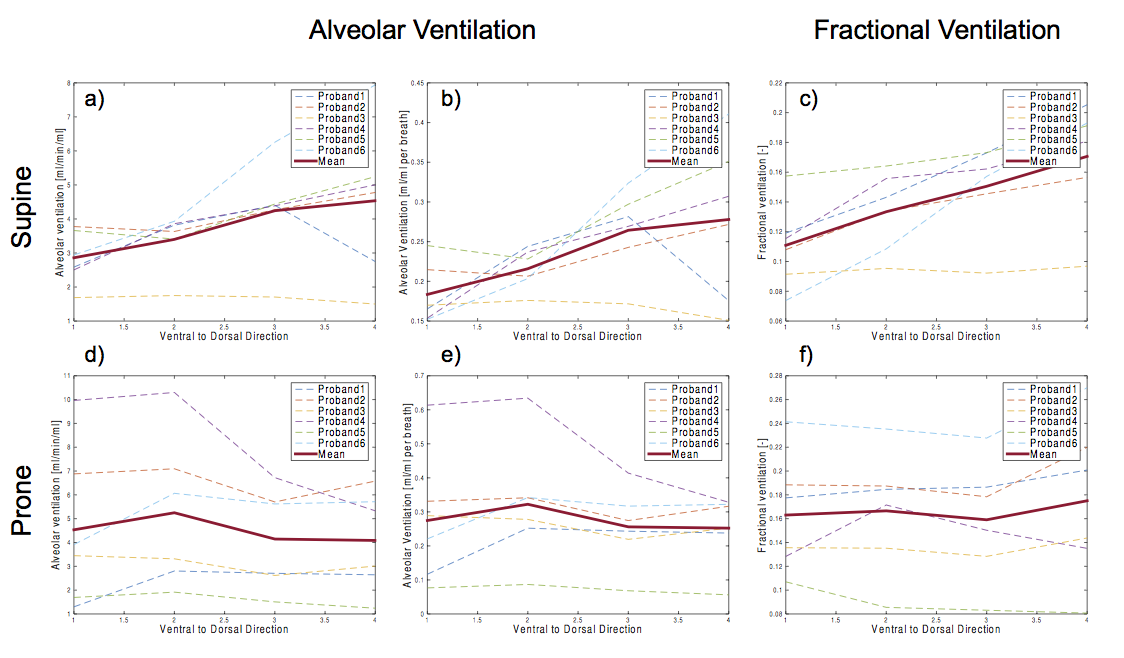
distributions can be observed with both methods. Figure 2 demonstrates ventral-dorsal
distributions of AV and FV values in supine (2a-c) and prone position (2d-f). A gravitational decrease from dorsal to ventral quarter is observed
for AV (Δ=51%) and FV (Δ=54%) in supine posture. On the contrary, the results for
prone posture delivered a more homogenous dorsal-ventral distribution of AV and
FV values.Discussion
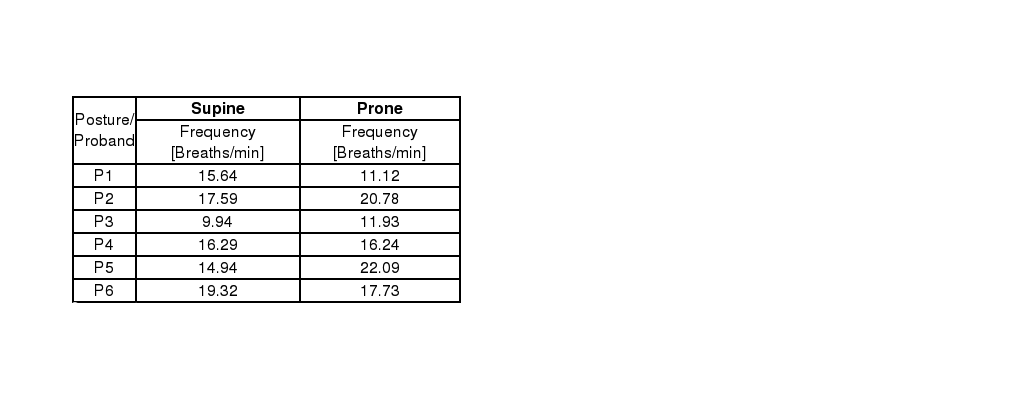
The quantified regional lung ventilation was obtained. Similarly to previous results the differences of FV and AV between ventral and dorsal lung regions were more pronounced in supine than in prone posture.5 Although the absolute AV values are higher than in the literature5, these differences can be attributed to different breathing frequencies (Table 1). Multiplying the AV (with units of ml/ml per breath) from our study (Figure 2b and 2e) with the breathing frequency similar to the respiratory commands in the Henderson study1 leads to AV values in a very similar range (1-3 ml/min/ml). Although FV lacks an absolute unit, AV as well as FV show a physiologic behaviour in prone and supine position. A limitation of this study is the susceptibility to errors due to proton density mapping using only two TE measurements. Consequently, more robust proton density measurements could be implemented.Conclusion
The feasibility of a novel free-breathing method for absolute ventilation quantification was demonstrated. Although the presented protocol and image quality has potential for improvement, an important step towards a fully quantified FD V/Q measurement has been taken.Acknowledgements
No acknowledgement found.References
1. Bauman G, Puderbach M, Deimling M, et al. Non-contrast-enhanced perfusion and ventilation assessment of the human lung by means of fourier decomposition in proton MRI. Magnetic resonance in medicine 2009;62(3):656-664.
2. Kjorstad A, Corteville DM, Fischer A, et al. Quantitative lung perfusion evaluation using Fourier decomposition perfusion MRI. Magnetic resonance in medicine 2014;72(2):558-562.
3. Zapke M, Topf H-G, Zenker M, et al. Magnetic resonance lung function - a breakthrough for lung imaging and functional assessment? A phantom study and clinical trial. Respir Res 2006;7(1):106.
4. Kjorstad A, Corteville DM, Henzler T, et al. Quantitative lung ventilation using Fourier decomposition MRI; comparison and initial study. MAGMA 2014;27(6):467-476.
5. Henderson AC, Sá RC, Theilmann RJ, et al. The gravitational distribution of ventilation-perfusion ratio is more uniform in prone than supine posture in the normal human lung. Journal of Applied Physiology 2013;115(3):313-324.
6. Avants BB, Tustison NJ, Song G, et al. A reproducible evaluation of ANTs similarity metric performance in brain image registration. Neuroimage 2011;54(3):2033-2044.
Figures