4898
Retrospective Image Sorting for Phase REsolved Lung Perfusion Imaging (PRELP)1Diagnostic and Interventional Radiology, Medical School Hannover, Hannover, Germany, 2Biomedical Research in Endstage and Obstructive Lung Disease Hannover (BREATH), German Center for Lung Research (DZL), Hannover, Germany
Synopsis
Currently, only self-gated or ultra-fast sequences allow an adequate temporal resolution to resolve different cardiac phases during lung perfusion. First studies show the benefit of this additional information. Nevertheless such techniques are not widely available. Therefore, in this study a post processing method is assessed, which can increase the temporal resolution by sorting images according to their cardiac phase using a piecewise cosine fit. The feasibility is demonstrated in 6 healthy volunteers and two patients with chronic thromboembolic hypertension (CTEPH). The easy implementation and possibility of retrospective evaluation of existing Fourier Decomposition acquisitions are the advantages of this method.
Purpose
Fourier Decomposition (FD)1
imaging with sufficient temporal resolution to resolve different cardiac phases
during lung perfusion were either achieved using ultra-fast sequence design
with highly accelerated parallel imaging2 or using a self-gating
approach3. Using these methods regional delayed blood inflow time was
shown in patients with cystic fibrosis2,4. However, while the self-gating
approach requires long acquisition times and advanced sequence design, ultra-fast
acquisition is limited in signal-to-noise ratio and spatial resolution due to
the very short acquisition time.
In this study a standard spoiled gradient
echo sequence with a temporal resolution comparable to conventional FD imaging
is used in conjunction with an image-sorting algorithm to produce Phase REsolved
Lung Perfusion imaging (PRELP). The purpose of this study was to assess the
feasibility of this method and to test for perfusion distributions in supine
and prone positions5.Methods
Six healthy volunteers (age 24-51, 3 female) were enrolled in this study. For each subject a sagittal acquisition of the right lung was performed on a 1.5T scanner during free breathing in prone and supine position using a spoiled gradient sequence (FOV=50x50 cm2, matrix size=128x128, slice thickness=15mm, TE=0.82, TR=3ms, flip angle=5° and GRAPPA=2) over a period of 48s at a temporal resolution of 192ms. Additionally, three coronal acquisitions were performed in supine position only. A retrospective analysis was performed on FD data of two patients with chronic thromboembolic hypertension (CTEPH) acquired with a similar sequence protocol as described above and compared with dynamic contrast enhanced (DCE) MRI.
PRELP analysis was as follows: After image registration (ANTS6) an edge-preserving filter (guided image filtering7) was applied to all images using the averaged image of the registered image time series as the guiding image. This filtering is especially suited for registered image time series, since it enables to use the sharp edge information of the averaged image, which has a higher signal to noise ratio, and at the same time preserves the contrast information of the individual images. To remove signal variations due to respiration a high-pass filter at 0.8 Hz was applied.
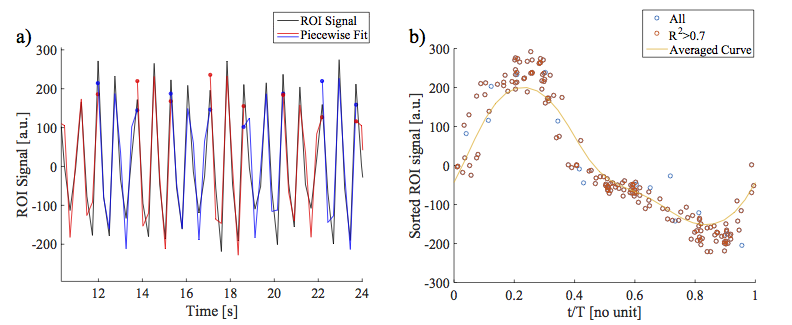
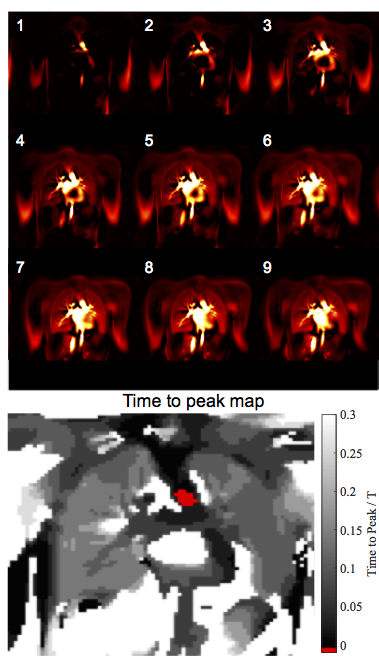
Next, a group of vessels were segmented and used as a region of interest (ROI) for spatial averaging to obtain a signal time series (TS) for phase sorting. The local maxima were used to subdivide the TS into smaller sections. Subsequently, piecewise cosines were fitted (fit parameters: amplitude, phase offset, frequency, Figure 1a). Since a cosine has a definite phase at each time point, phase can be assigned to each measurement. Using this information the images were sorted into one cardiac cycle (Figure 1b). Using a Gaussian kernel (sigma = 0.1) 30 images were interpolated at an equidistant time grid (Figure 2) covering one cardiac cycle, achieving a nominal temporal resolution of 33ms depending on the heart rate. The phase of each voxel was determined in relation to the vessels ROI in relative units of a full cardiac cycle. Using this information time-to-peak (TTP) maps were calculated.
Results
Figure 2 shows the exemplary blood flow in
the coronal slice of one healthy volunteer. A physiologic dispersion of blood
beginning at the arteries and aorta can be noticed, followed by a shortly
delayed blood arrival in the lung parenchyma. Similar to SENCEFUL4
and ultra-fast imaging2, homogenous results for TTP were obtained in
the lung parenchyma for all healthy volunteers: median TTP 0.02, minimum TTP
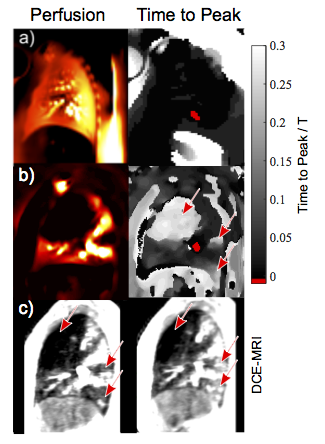
0.002, maximum TTP 0.039. Contrary, the CTEPH patients showed lung segments of
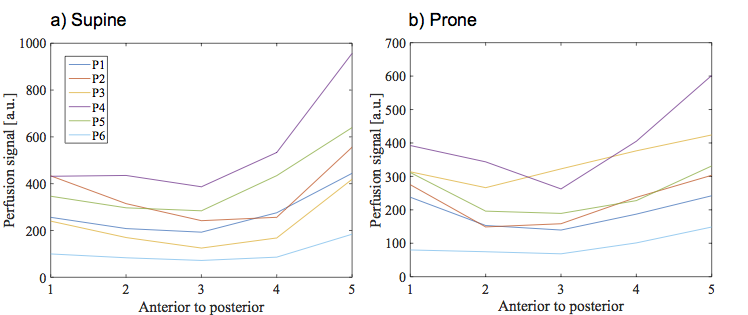
increased TTP (Figure 3, 4) with very good correspondence to DCE. In accordance
with the results of Henderson et al.5, the perfusion gradient is reduced in
prone position in comparison to supine.Discussion
The presented results confirm the
feasibility of the PRELP method in healthy volunteers and patients. There is a
good correspondence between dynamic contrast enhanced (DCE) MRI and PRELP.
Overall, the results suggest that the cosine model is appropriate for
estimation of the cardiac phase. Depending on the Gaussian kernel size there is
trade off between signal and the effective temporal resolution, which was not
further analyzed in this study. A drawback of PRELP is the possible
synchronization of the data sampling with the heart frequency, which results in
the repeated acquisition of only a few heart phases.Conclusion
This study shows the feasibility of a
post-processing based image sorting to gain quantitative information regarding
lung parenchymal perfusion without the need for ultra-fast imaging or
implementation of self-gating techniques, which will be especially advantageous
for clinical sites without access to advanced sequence technology or as an
additional tool for analysis of conventional FD data.Acknowledgements
This work was supported by a grant from the German Federal Ministry of Education and Research (IFB-Tx, reference number: 01EO1302) and the German Centre for Lung Research (DZL).References
1. Bauman G, Puderbach M, Deimling M, et al. Non-contrast-enhanced perfusion and ventilation assessment of the human lung by means of fourier decomposition in proton MRI. Magnetic resonance in medicine 2009;62(3):656-664.
2. Bauman G, Eichinger M, Uecker M. High temporal resolution radial bSSFP sequence with nonlinear inverse reconstruction for the measurement of the pulmonary blood inflow time using Fourier decomposition MRI. Proc Intl Soc Mag Reson Med 2012;20:1340.
3. Fischer A, Weick S, Ritter CO, et al. SElf-gated Non-Contrast-Enhanced FUnctional Lung imaging (SENCEFUL) using a quasi-random fast low-angle shot (FLASH) sequence and proton MRI. NMR in Biomedicine 2014;27(8):907-917.
4. Veldhoen S, Weng AM, Wirth C, et al. Pulmonary Phase Imaging using Self-Gated Fourier Decomposition MRI in Patients with Cystic Fibrosis. Proc Intl Soc Mag Reson Med 2016;24:1144.
5. Henderson AC, Sá RC, Theilmann RJ, et al. The gravitational distribution of ventilation-perfusion ratio is more uniform in prone than supine posture in the normal human lung. Journal of Applied Physiology 2013;115(3):313-324.
6. Avants BB, Tustison NJ, Song G, et al. A reproducible evaluation of ANTs similarity metric performance in brain image registration. Neuroimage 2011;54(3):2033-2044.
7. He K, Sun J, Tang X. Guided Image Filtering. IEEE Transactions on Pattern Analysis and Machine Intelligence 2013;35(6):1397-1409.
Figures