4891
Early Prediction of Chronic Infarct Size by Acute Strain: A Cardiac MRI Study of Myocardial Infarction in Pigs1Translational Biomarkers, Merck Sharp & Dohme, Singapore, Singapore, 2Cardiovascular Research Institute, National University Heart Centre, Singapore, 3Department of Surgery, Yong Loo Lin School of Medicine, National University of Singapore, Singapore, 4Comparative Medicine Imaging Facility, Center for Life Sciences, National University of Singapore, Singapore, 5Translational Biomarkers, Merck & Co., Inc., West Point, PA, United States
Synopsis
We characterized cardiac
structure and function longitudinally in myocardial infarcted pigs, induced by
permanent ligation of left circumflex artery of left ventricle (LV), to identify
early strain biomarkers that are predictive of late stage remodeling. Pigs were
imaged pre- and post-surgery at 1-wk and 4-wk. Reduction of percentage of
infarct was observed at basal antero-lateral and mid infero-lateral regions at
4-wk post-surgery. Decreased peak circumferential strain was observed at
infarcted areas showing compromised contractility. In addition, ROC analyses
revealed that acute strain at 1-wk and early strain change from baseline can
predict chronic infarct size suggesting that LV strain could potentially serve
as early biomarker for novel therapies.
Purpose
Myocardial Infarction (MI) is one of the leading causes of morbidity and mortality globally [1]. Approximately, 20-30% of cases following MI, left ventricles (LV) remodel adversely and subsequently ascribe to high rates of heart failure (HF) and death [2]. Thus, early identification of subjects prone to LV adverse remodeling is critical to optimizing the treatment strategy for HF patients. Cardiac MRI can provide region-specific quantitative measurements, of both LV contractility (as measured by strain) and LV remodeling or infarct volume post MI (as measured by LGE) with good reproducibility and accuracy [3]. In this study, we aim to characterize cardiac structure and function longitudinally in MI pigs (pre- and post-surgery at 1-wk and 4-wk) and identify early strain biomarkers that are predictive of adverse ventricular remodeling at the later stage.Methods
Animals: Eight healthy pigs (weight = 52 ± 6 kg, age = 4 - 6 month) were imaged for this study. All intervention and imaging experiments were reviewed and approved by the IACUC of Merck & Co., Inc., West Point, PA USA and National University of Singapore (NUS). MI was induced by left-circumflex coronary artery (LCx) ligation following median sternotomy.
MRI: All imaging experiments were performed using a 3T Skyra MRI system (Siemens Medical Solutions, Erlangen Germany). Pigs were imaged at 0-wk (Baseline), 1-wk (Acute) and 4-wk (Chronic) post LCx ligation. The baseline heart rate was 76 ± 10 bpm. Multi-phase gated CINE structural images [FOV: 290x290 mm2, imaging matrix (IM): 256x256, slice thickness (ST): 8 mm, echo spacing (ES): 3.6 ms, bandwidth (BW): ±125 KHz, TR/TE: 36.4 ms/1.6 ms] and SPAMM [4] tagged images [FOV: 290x290 mm2, IM: 224x179, ST: 8 mm, averages: 1, BW: ±50 KHz, TR/TE: 50.04 ms/2.65 ms, FA: 10°, tag separation: 8 mm] were acquired for 6 short-axis and 2 long-axis slices. In addition, at the same slice locations, late gadolinium enhanced (LGE) images [FOV: 340x255 mm2, IM: 256x205, ST: 8 mm, ES: 2.9 ms, BW: ±147 KHz, TR/TE: 724.16 ms/1.22 ms, FA: 37°] were acquired 10-12 min after injecting Magnevist at 0.2 mmol/kg.
Data analysis: CINE structural imaging datasets, to quantify structural and functional parameters were analyzed using the SEGMENT software tool [5]. Harmonic Phase (HARP) [6] analyses were performed on tagged images to quantify myocardial displacement and circumferential strain. LV segmentation and infarct delineation were carried out on LGE images using in-house MATLAB scripts. Peak circumferential strain and percentage of infarct within a region was computed for a 17-Segment American Heart Association (AHA) model [7], except the apex region. Receiver operating characteristics (ROC) analyses was done on acute strain at 1-wk or its change from the baseline to classify infarcted segments at 4-wk, where infarct segments were assigned if the percentage of infarct within the segment was ≥ 12% [8].
Results and Discussion
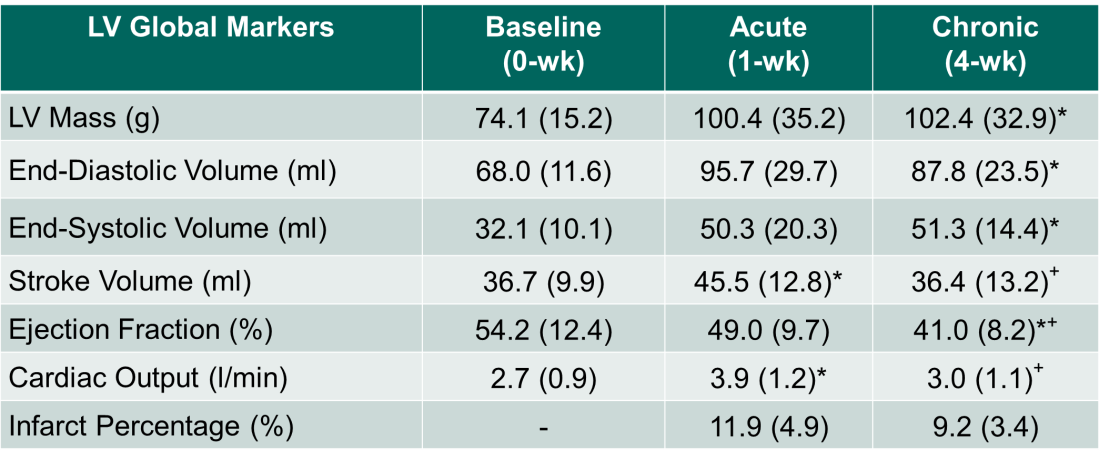
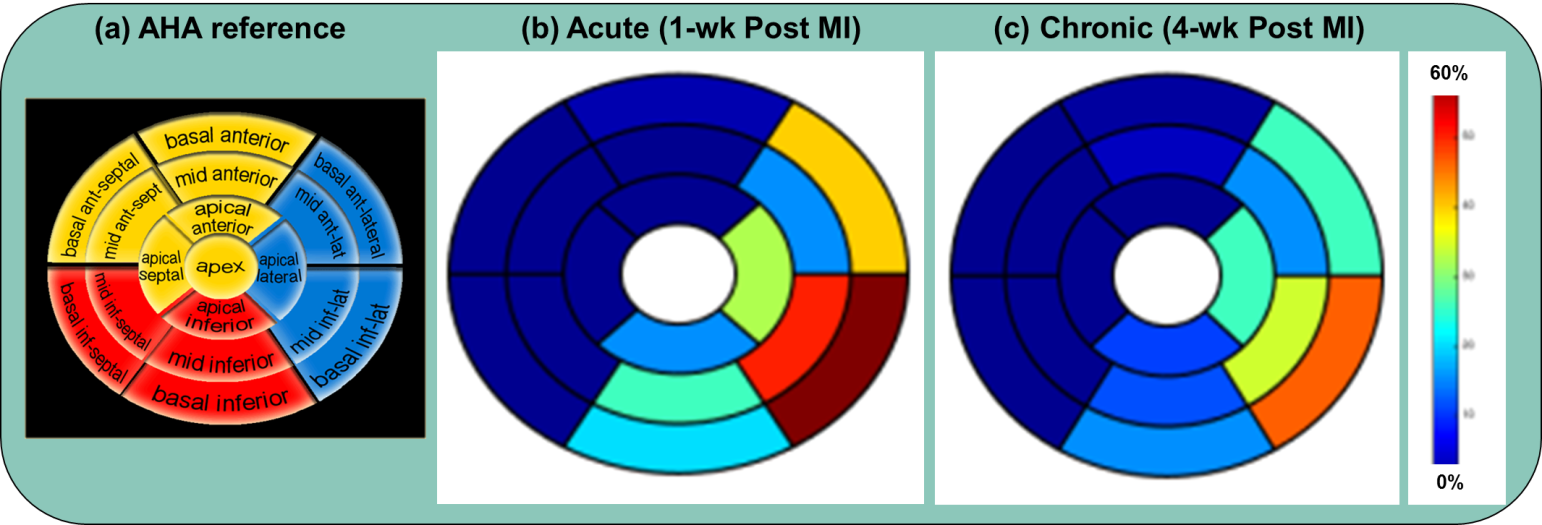
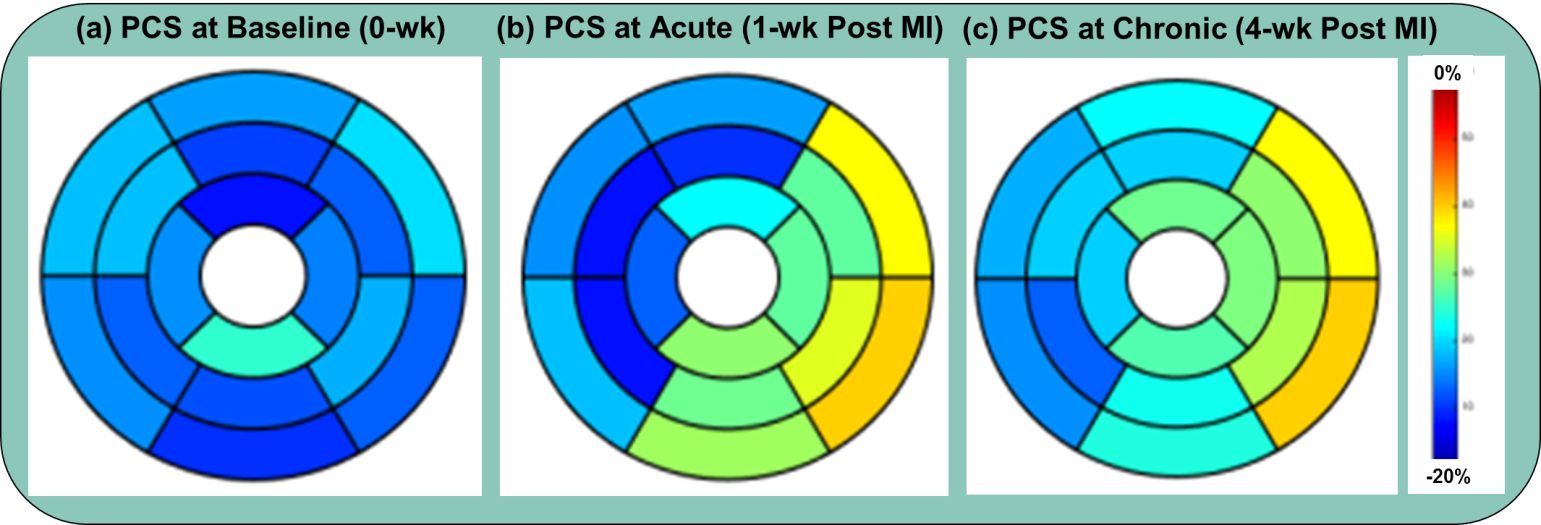
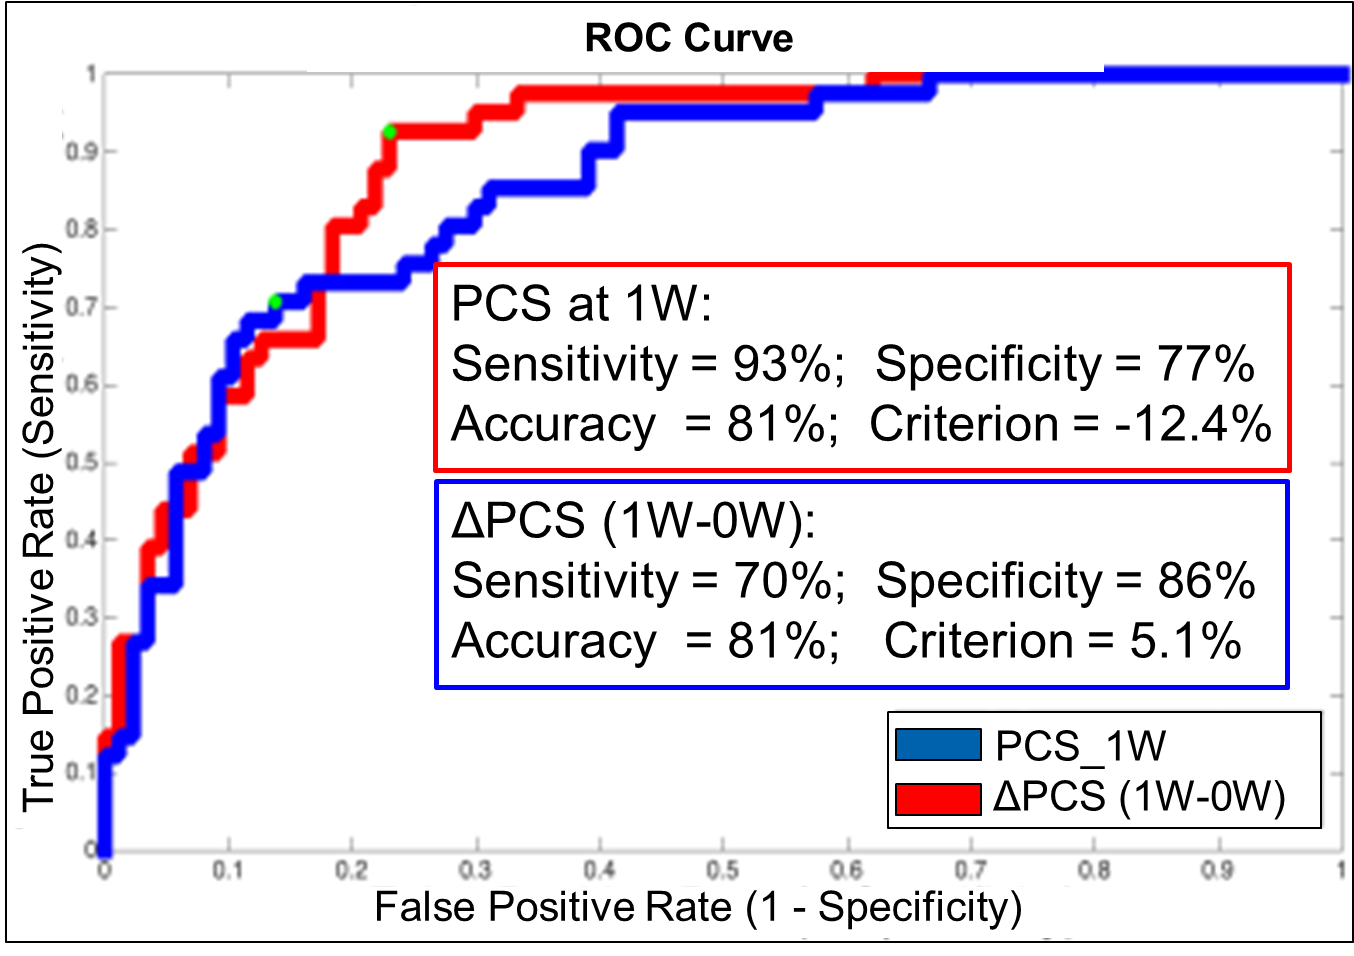
Table 1 lists the longitudinal measurements of global structural parameters, where ventricular remodeling post MI is evident. To depict regional mean percentage infarct, data was standardized into the AHA format (N=8, see Figure 1) and infarction was clearly observed in the inferior and lateral regions of the heart. Also, percentage infarct was found to be greater at 1-wk (vs 4-wk, two-tailed t-test) at specific regions: basal antero-lateral (p < 0.05) and mid infero-lateral (p < 0.05), indicating postive remodeling occurred in these areas. Average peak circumferential strain (PCS) is shown in Figure 2 (N=8) and reduced PCS values were found at these infarcted regions (vs baseline, p < 0.05, two-tailed t-test). ROC analyses (Figure 3) demonstrated that PCS at 1-wk (PCS_1W) and its change from the baseline (ΔPCS(1W-0W)) could reliably predict infarcted segments observed at 4-wk time point. Using a cut-off of the infarct size over 12%, PCS_1W and ΔPCS (1W-0W) can predict the infarct, with a sensitivity/specificity of 93%/77% or 70%/86%, respectively.Conclusions
In this longitudinal study, we have demonstrated feasibility of using cardiac strain biomarkers to characterize LV structure and function in pre- and post-MI pigs. Reduced percentage infarct was found in basal antero-lateral and mid infero-lateral regions at 4-wk post-MI, suggesting positive remodeling during the disease progression. Decreased PCS was observed at infarct areas, which can be reconciled with compromised contractility. ROC analyses revealed that acute strain at 1-wk and early strain change from baseline can predict chronic infarct size. Our data suggest LV strain may serve as an early biomarker to evaluate novel therapies.Acknowledgements
No acknowledgement found.References
[1] Lloyd-Jones D, Adams JR, Brown MT et al. Heart disease and stroke statistics -- 2010 update: a report from the American Heart Association. Circulation. 2010; 121: e46-e215.
[2] Mathers CD, Loncar D. Projections of global mortality and burden of disease from 2002 to 2030. PLoS Medicine. 2006; 3: e442.
[3] Gerber BL, Garot J, Bluemke DA et al. Accuracy of contrast-enhanced magnetic resonance imaging in predicting improvement of regional myocardial function in patients after acute myocardial infarction. Circulation. 2002; 106:1083-9.
[4] Axel L, Dougherty L. Heart wall motion: improved method of spatial modulation of magnetization for MR imaging. Radiology. 1989; 172(2): 349-350.
[5] Heiberg E, Sjorgren J, Ugander M, et. al. Design and validation of Segment-freely available software for cardiovascular image analysis. BMC Med Imaging. 2010; 10:1.
[6] Osman NF, McVeigh ER, Prince JL. Imaging heart motion using harmonic phase MRI. IEEE TMI. 2000; 19:186-202.
[7] Cerqueira MD, Weissman NJ, Dilsizian V et al. Standardized myocardial segmentation and nomenclature for tomographic imaging of the heart. Circulation 2002; 105(4):539-542.
[8] Loutfi M, Sadaka MA, Sobhy M. Outcomes of DES in diabetic and nondiabetic patients with complex coronary artery disease after risk stratification by the SNTAX score. Clinical Medicine Insights: Cardiology. 2016; 10:103-10.
Figures