4888
Histological validation of loading lag of heart iron with respect to liver iron in a rabbit model1Affiliated hospital of Guangdong Medical College, Zhanjiang, People's Republic of China, 2Sun Yat-Sen Memorial Hospital, Guangzhou, People's Republic of China, 3Tsinghua University, Beijing, People's Republic of China, 4Shiyan People’s Hospital, 5Peking University Shenzhen Hospital, 6Sun Yat-Sen Memorial Hospital, 7The Fifth Affiliated Hospital of Sun Yat-Sen University, 8Philips Healthcare, Hong Kong, 9Philips Healthcare, Guangzhou, 10Tsinghua University
Synopsis
Whether there exists a lag in the iron loading between liver and heart in transfusion dependent patients has clinical significance in prevention and treatment of heart iron overload. We performed this study to verify this time lag on a rabbit model. The result shows that the iron loading, measured with pathology, MRI and atomic absorption spectrophotometer, was much faster and heavier in the liver than that in the heart. Therefore, there existed a time lag between heart and liver iron overload on the rabbit model. This may lead to improved clinical guidelines for cardioprotection.
PURPOSE
To date, iron-mediated cardiac toxicity remains the main cause of death in transfusion-dependent patients(1). Noetzli et al reported that there existed an iron loading lag between the heart and liver in their longitudinal study(2), which is clinically significant in prevention and treatment of heart iron overload (HIO). However, it had not been verified as they did not provide calibration against tissue iron of heart by biopsy due to its risk and inherited limitations. In this study, we aim to verify whether there exists loading lag of heart iron with respect to liver iron in a rabbit model.METHODS
A total of 44 rabbits were included in this study. 35 of rabbits (Group A, 5 for standby) were injected dextran iron in the buttock for 15 weeks to induce the iron overload model. 9 rabbits were injected isometric saline as the control group (Group B, 4 for standby). Liver and heart iron of all rabbits were measured using a T2* sequence in vivo and in vitro at different time points. Ex vivo liver and heart pathology were obtained for all rabbits with Hematoxylineosin staining and Prussian blue staining. Postmortem assessments of liver iron concentration (LIC) and heart iron concentration (HIC) were conducted in an atomic absorption spectrophotometer (AAS).RESULTS
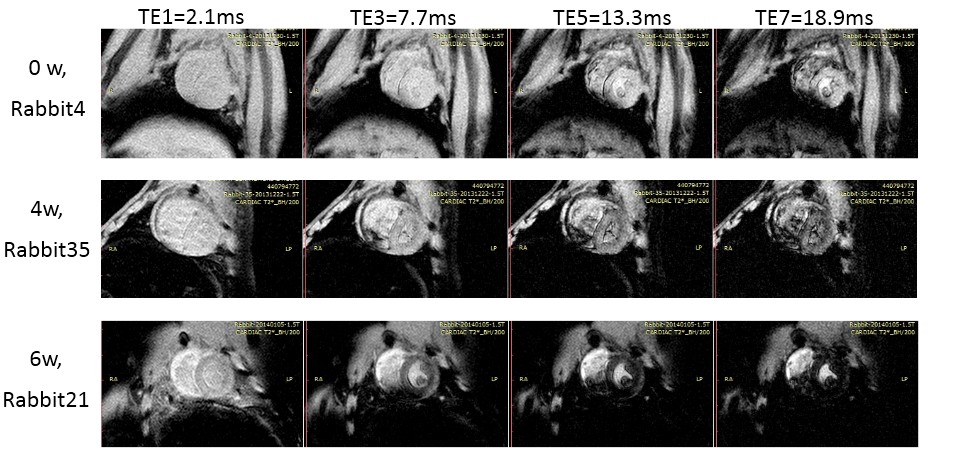
Calibration against tissue iron of heart and liver with Prussian blue staining is shown in Figure 1 and 2. Table 1 and Figure 3 are the dynamic information of HIC and LIC from 0 to 15 weeks measured with AAS. LIC after 11 weeks is too heavier to be measured with AAS. T2* measurement of heart iron and liver iron is shown in Figure 4. For the control group, the mean heart T2* in vivo and in vitro was 37.26±4.43 ms and 30.42±4.81 ms respectively. The mean HIC was 0.14±0.04 (mg/g, dry). And the mean liver T2* in vivo and in vitro was 17.32±2.46 ms and 14.51±2.50 ms respectively. The mean LIC was 0.13±0.08 (mg/g, dry). For the experimental group, the mean heart T2* in vivo and in vitro was 7.71±4.12 ms and 9.11±3.25 ms respectively. The mean HIC was 1.21±0.49 (mg/g, dry). The mean liver T2* in vivo and in vitro was 8.46±10.30 ms and 3.82±4.52 ms respectively. The mean LIC was 26.40±11.36 (mg/g, dry). Both liver and heart iron levels of control group were significantly less than those in the experimental group. The iron loading, measured with pathology, MRI and AAS, was faster and heavier in the liver than that in the heart.DISCUSSION
In this study, we successfully induced a rabbit model with liver iron overload (LIO) and HIO and measured the dynamic changes of liver and heart iron. Preliminary results suggested that the loading of liver iron was much earlier than that in the heart of rabbits, which was consistent with that reported by Noetzli et al(2). One possible explanation is that there exist different mechanisms of iron uptake in the heart and liver. The liver, bone marrow and spleen are the natural storage for body iron. Transfusional iron is transported among these organs by some specific means. When the iron burden is beyond normal storage levels, iron overload will happen in these organs firstly. The heart and endocrine glands also have iron uptake but the element is well-regulated transferrin-mediated. When the transferrin is fully saturated, the unregulated influx of non-transferrin bound iron (NTBI) may happen and then iron deposition will occur in these organs(3-5). Also, up-regulated heart iron transport may cause this phenomenon of delayed iron overload(3).
Interestingly, we could also observe that the loading of heart iron slowed a little down in the 12 weeks, and after that the heart iron loading even showed a little decreasing trend up to 15 weeks. We speculate that one possible explanation for this phenomenon is that there may exist a self-regulating mechanism for iron overload in the heart or body(3).
There are some limitations in this study. First, we just observed the loading of heart and liver iron, but did not show the unloading process. Second, we used rabbit as the experimental subject. The process of iron metabolism may not be fully the same as that in human body. The exact difference were not evaluated in this pilot study but deserve attention in future work.
CONCLUSION
Our data suggests the existence of a time lag between HIO and LIO in a rabbit model. The loading of liver iron was much faster and severer than that in the heart. This further supports the statement that heart iron lags the changes of liver iron.Acknowledgements
This work was supported by the Sun Yat-Sen University Clinical Research 5010 Program (2013004), the National Natural Science Foundation of China (61271132), the Beijing Natural Science Foundation (7142091),and the 2015 Doctoral Fund of the Affiliated Hospital of Guangdong Medical College (BJ201521).References
1. Pennell DJ, Udelson JE, Arai AE, et al. Cardiovascular Function and Treatment in beta-Thalassemia Major: A Consensus Statement From the American Heart Association. Circulation. 2013;128(3):281-308.
2. Noetzli LJ, Carson SM, Nord AS, Coates TD, Wood JC. Longitudinal analysis of heart and liver iron in thalassemia major. Blood. 2008;112(7):2973-2978.
3. Parkes JG, Hussain RA, Olivieri NF, Templeton DM. Effects of iron loading on uptake, speciation, and chelation of iron in cultured myocardial cells. J Lab Clin Med. 1993;122(1):36-47.
4. Randell EW, Parkes JG, Olivieri NF, Templeton DM. Uptake of non-transferrin-bound iron by both reductive and nonreductive processes is modulated by intracellular iron. J Biol Chem. 1994;269(23):16046-16053.
5. Oudit GY, Sun H, Trivieri MG, et al. L-type Ca2+ channels provide a major pathway for iron entry into cardiomyocytes in iron-overload cardiomyopathy. Nat Med. 2003;9(9):1187-1194.
Figures
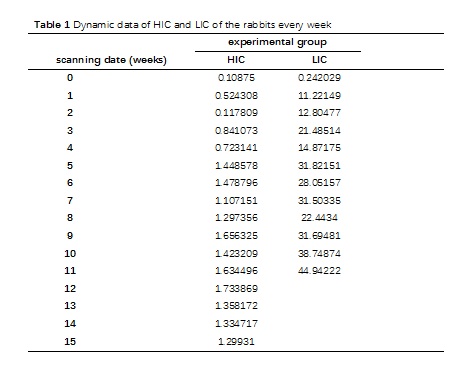
Table 1. Dynamic data of HIC and LIC of the rabbits every week It shows that the iron loading, measured with atomic absorption spectrophotometer, is faster and heavier in the liver than that in the heart.
Note: the HIC and LIC above is the average value of 2 rabbits every week. LIC after 11 weeks is too heavier to be measured with atomic absorption spectrophotometer. HIC: heart iron concentration; LIC: liver iron concentration
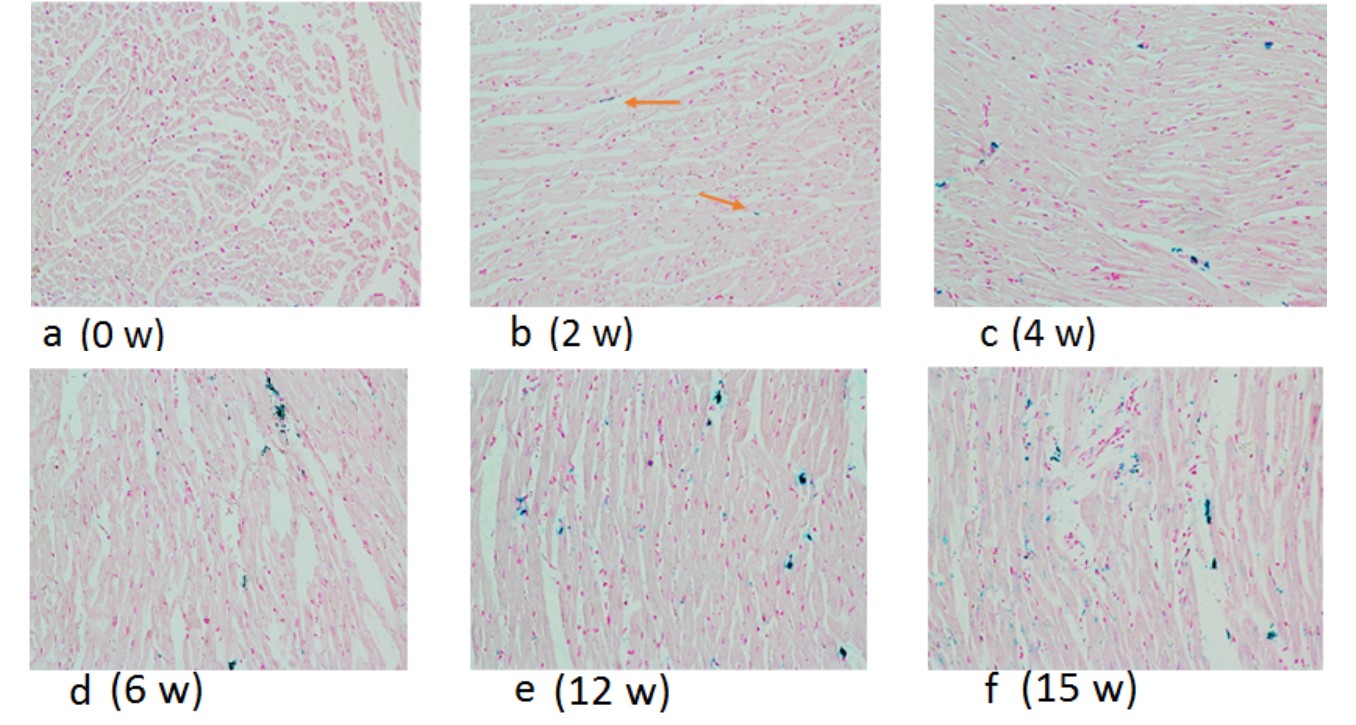
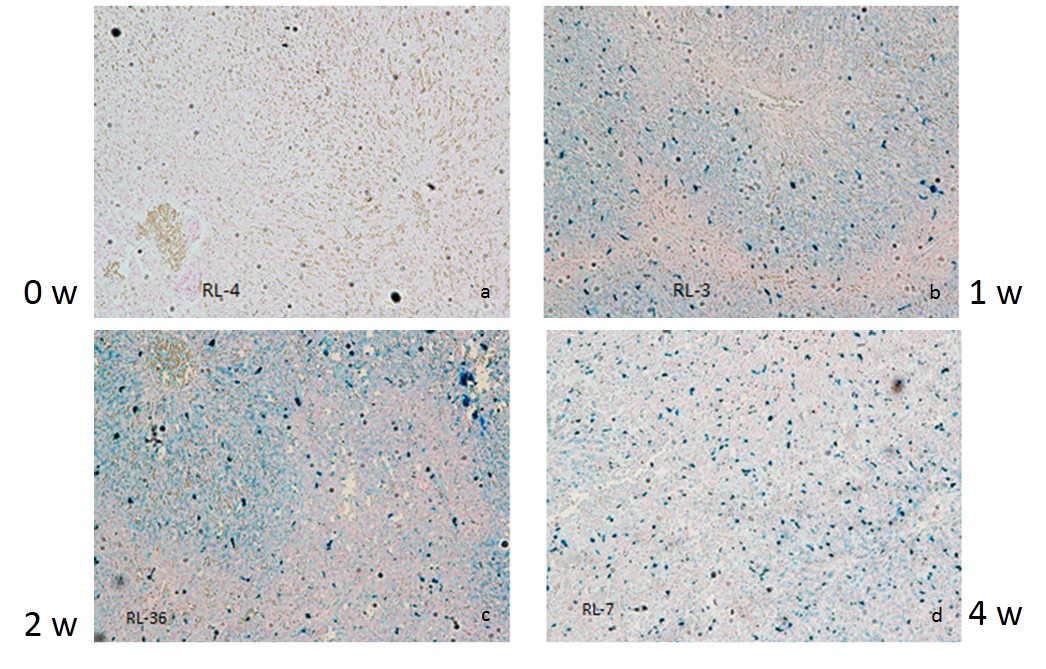
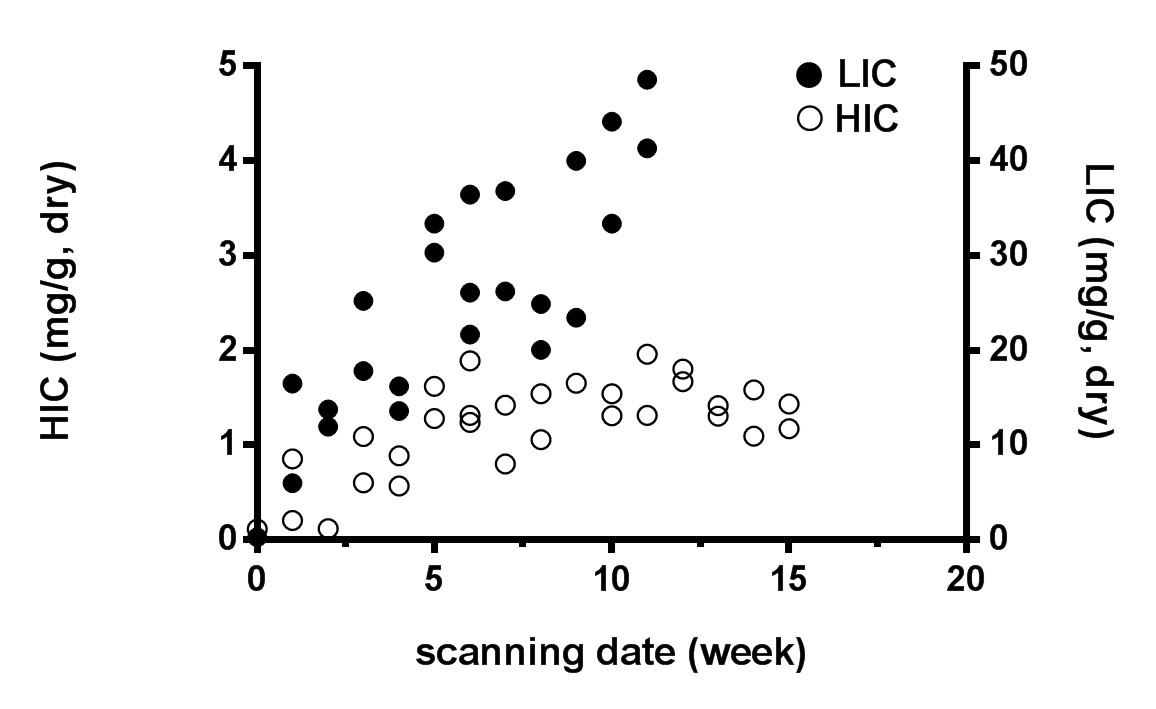
Figure 3. Comparison of the process of heart and liver iron deposition in the scatter plots. The heart iron concentration (HIC) and liver iron concentration (LIC) were measured by atomic absorption spectroscopy. It clearly demonstrated that the loading of excessive iron in the liver (steep oblique line shape) was much faster than that in the heart (gentle ascending trajectory shape).
Note:These data are without control group except the first control rabbits in the 0 week