4887
Gadobutrol- vs. gadoterate meglumine-enhanced multi-phase 3D-MRA and 4D-MRA at 1.5T and 3T: an intra-individual quantitative and qualitative comparison of macrocyclic contrast agents in minipigs1Radiology, University of Bonn, Bonn, Germany, 2MR and CT Contrast Media Research, Bayer Pharma AG, Berlin, Germany, 3Zentrum für Radiologie, Neuroradiologie, Sonographie und Nuklearmedizin, Krankenhaus der barmherzigen Brüder, Trier, Germany
Synopsis
In an animal
model bolus kinetics and image quality of the macrocyclic contrast agents (CA) gadobutrol
(standard and half-dose) and gadoterate meglumine (standard-dose) were investigated
intra-individually in multi-phase 3D- (MP3D) MRA and in 4D-MRA at 1.5T and 3T. Standard
dose gadobutrol provided significantly higher signals in both MP3D- and 4D-MRA
at both field strengths. Differences were most prominent in venous imaging
phases. At 3T, arterial first pass peaks were truncated in 7/8 minipigs using
standard dose CA. Image quality analysis of MP3D confirmed higher image quality
in venous phases with standard-dose gadobutrol compared to gadoterate meglumine
at both field strengths.
Aim of the study
To analyze bolus kinetics and diagnostic image quality of gadoterate meglumine and gadobutrol at half- and standard dose in time-resolved thoracoabdominal 4D-MRA and multi-phase 3D (MP3D)-MRA at 1.5T and 3T.Introduction
4-dimensional magnetic resonance angiography- (4D-MRA) applications are used for evaluation of vascular flow in many centers (1-5). High-resolution imaging of abdominal vessels, on the other hand, is usually performed with multi-phase 3D-MRA. Even though physico-chemical properties including relaxivity, bolus application and concentration of gadolinium have a major impact on quantitative and qualitative parameters of MRA, studies on optimized contrast agent (CA) protocols remain rare (6-8). 1.0M gadobutrol has been shown to provide a more compact bolus shape and significantly higher peak Gadolinium concentrations in vessels (9-10). At 3T, standard dose gadobutrol was recently shown to lead to truncated peaks in arterial phases of 4D-MRA and benefits in the later phases of imaging (11).Methods
8 anaesthetized Goettingen minipigs (7 female, body weight = 33.4±3.7 kg) received MP3D- and 4D-MRA examinations at whole body 1.5T Siemens Avanto and 3T Philips Intera scanners. The animals were handled in compliance with the German animal welfare legislation and with the approval of the state animal welfare committee. Technical parameters of MP3D-MRA included 4 scans (3D FLASH), 64 slices, dynamic scan time = 12s, time to k0 =4.6s, TR/TE = 35/1.06 ms; flip angle = 25°, GRAPPA factor = 2, partial Fourier 6/8 (slice) 7/8 (phase), voxel size = (1.2mm)³ at 1.5T and 4 scans (3D FFE), 40 slices, dynamic scan time = 12s, time to k0 =6s, TR/TE = 5.1/1.8 ms; flip angle = 30°, SENSE acceleration (AP = 3.7), voxel size = (1.2×1.25×1.5) mm³, reconstructed voxel size = (1.1×1.1×1.5 mm)³ at 3T. 4D-MRA at 1.5T was performed with TWIST (Region A/B = 20%/25%; image update time = 1.48s, 40 dynamics, TR/TE = 2.41/0.87 ms; flip angle = 25°, GRAPPA factor = 2, Partial Fourier = 6/8, voxel size = (1.7mm)³ (36 slices), 4D-MRA at 3T using 4D-TRAK (Keyhole-factor 25%, keyhole scan duration = 1.5s, 40 dynamic scans, TR/TE = 7.7/1.3 ms; flip angle= 25°, SENSE factor (AP = 3; LR =2), voxel size = (1.6mm)³ (25 slices), reconstructed voxel size = (1.2×1.2×1.6)mm³. CA applications in 4D-MRA included a standard dose (0.1 mmol/kg, sGB) and a half dose (0.05 mmol/kg, hGB) of gadobutrol at a flow rate of 1ml/s and a standard dose (0.1 mmol/kg, sGM) of gadoterate meglumine at a flow rate of 2 ml/s, in 3-Phase 3D-MRA applications of sGB and sGM. MRA examinations were performed in a randomized order with 45 min in between to allow for wash-out of the previous CA. Quantitative analysis of MP3D- and 4D-MRA was based on signal intensity analysis of aorta, inferior vena cava and vena portae derived by normalization to baseline signal intensity with fixed signal amplification factors. Qualitative image analysis was performed by three independent radiologists regarding visibility of small and large arteries and veins. Statistics of quantitative results included repeated measurement one-way ANOVA followed by paired t-tests for groupwise comparison in 4D-MRA and paired t-tests (aorta, first phase; inferior vena cava, second phase; vena portae, third phase) in MP3D-MRA. Differences of image quality were tested using a Student’s t-test and Fleiss kappa to judge interobserver-agreement.Results
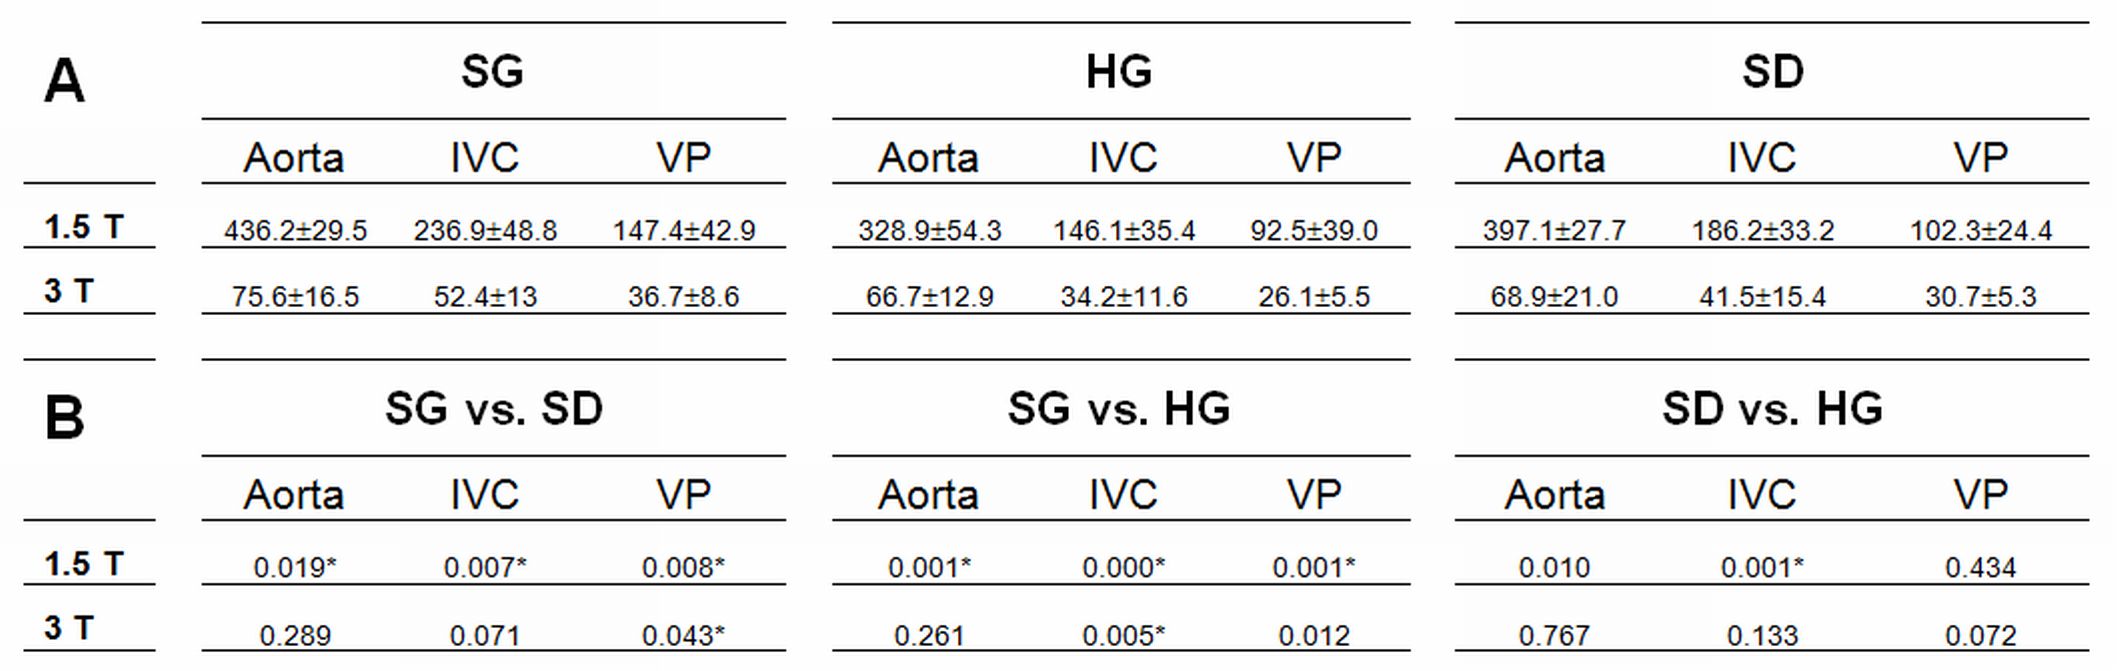
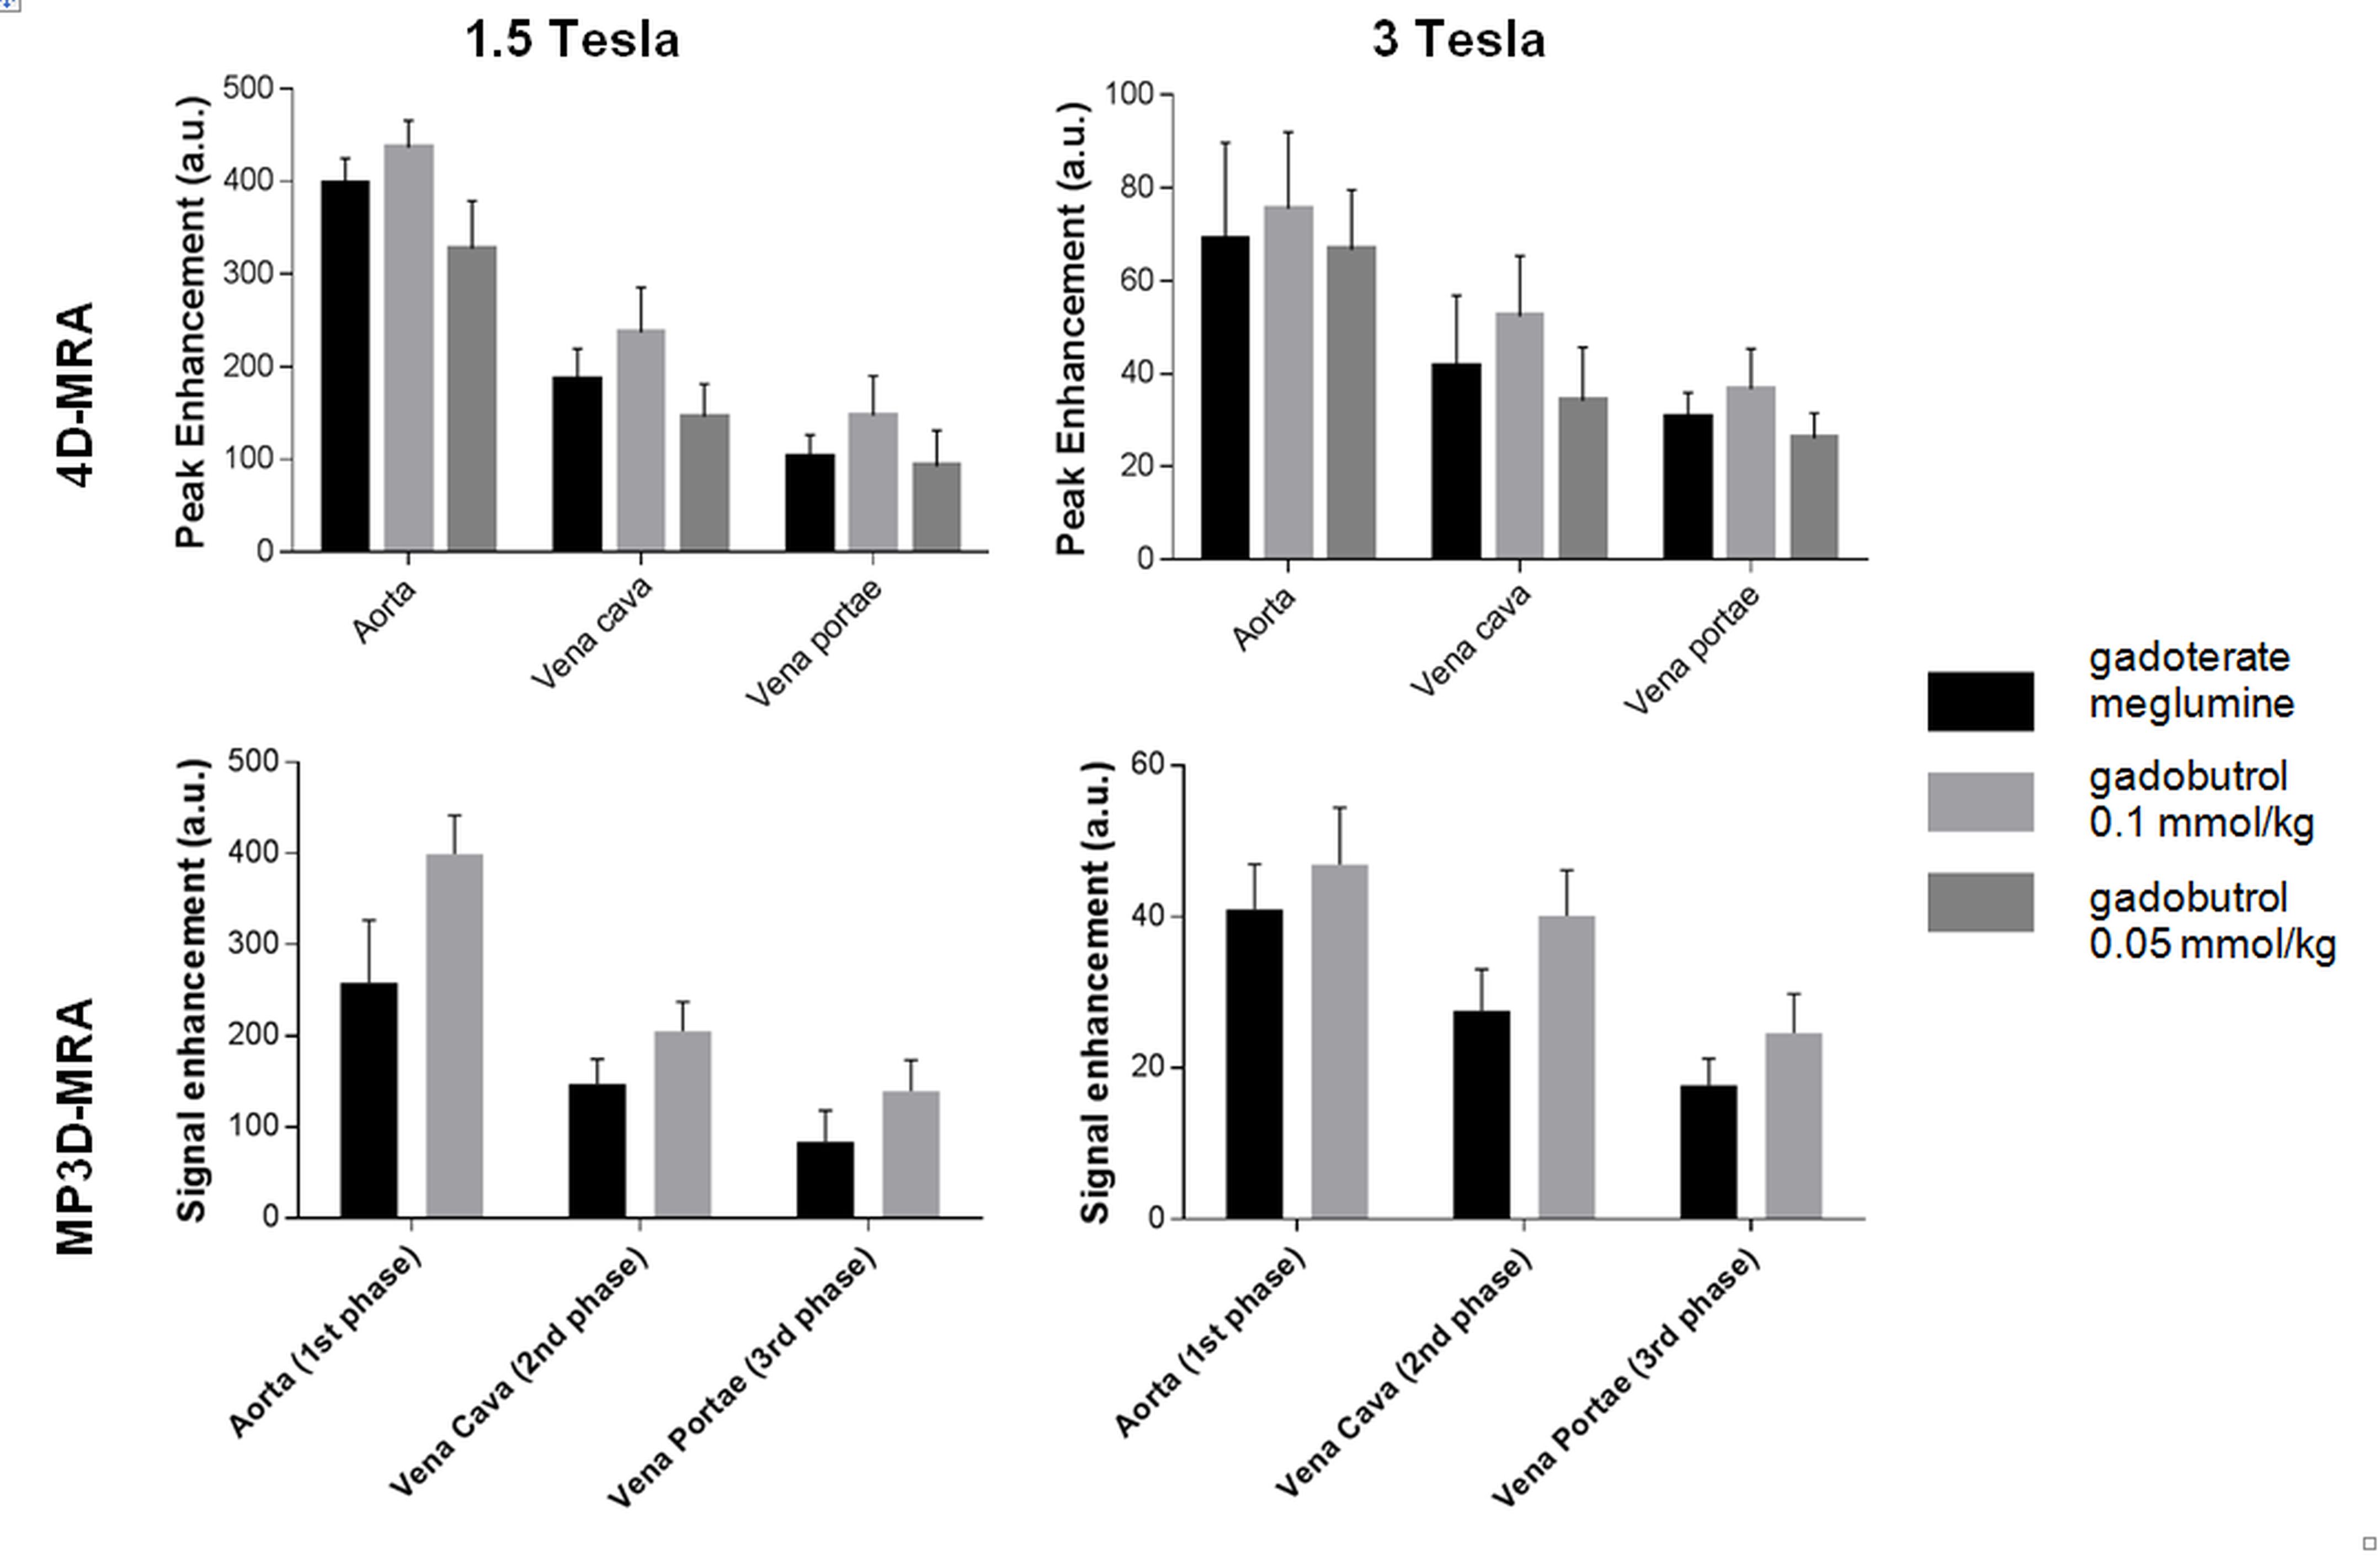
Apart from one failed examination at 1.5T, all examinations were successfully carried out and completed. Heart rates of animals remained unchanged throughout the examinations (p=0.09, One-way ANOVA). In 4D-MRA at 3T, we observed truncated first pass arterial bolus peaks (plateau or peak reversal) in 7/8 animals when using sGB and sGM. Using hGB at 3T and in all examinations at 1.5T truncated peaks were not observed. sGB provided the highest signals in all MP3D- and 4D-MRA examinations (figure). The arterial bolus arrived somewhat earlier after sGM-injections. 4D-MRA peak signals were significantly higher with sGB than sGM or hGB in all vessels at 1.5T and in venous vessels at 3T (table). In MP3D-MRA signal enhancement was significantly higher using sGB compared to sGM. Again, these differences were particularly marked in the venous imaging phases. Image quality analysis of MP3D-MRA revealed significantly higher image quality in venous phases with standard-dose gadobutrol compared to gadoterate meglumine at both 1.5T and 3T with excellent overall interobserver-agreement (Fleiss Kappa = 0.94).Conclusion
Truncated peaks are observed in arterial first passage boluses at 3T after standard-dose gadobutrol and gadoterate meglumine application. Nevertheless, standard dose gadobutrol offers the highest signal both in MP3D- and 4D-MRA at 1.5T as well as at 3T. Venous peaks are particularly enhanced using standard-dose gadobutrol compared to other CA applications.Acknowledgements
No acknowledgement found.References
(1) Griffin M et al. Magn Reson.Imaging Clin.N.Am. 2009; 17: 77-9
(2) Goyen M et al. J.Magn Reson.Imaging 2001; 13: 372-7
(3) Mata JF et al. Magn Reson.Imaging 2010; 28: 139-45
(4) Hadizadeh DR et al. RöFo 2014; 186: 847-59
(5) Jeong HJ. J.Magn Reson.Imaging 2011; 33: 225-31
(6) Hadizadeh DR et al. AJR Am.J.Roentgenol. 2010; 194: 821-9
(7) Voth M et al. Eur Radiol 2011; 21: 337-44
(8) Hadizadeh DR et al. AJNR Am.J.Neuroradiol. 2012; 33: 1095-101
(9) Rohrer M et al. Invest Radiol 2005; 40: 715-72
(10) Hadizadeh DR et al. Invest Radiol 2014; 49: 457-64
(11) Hadizadeh-DR et al. Proc.Intl.Soc.Mag.Reson.Med. 2016; 24:2679
Figures