4881
Evaluation of accelerated preclinical 4D-flow imaging with UNFOLD1Medical Physics, University Medical Center Freiburg, 79106, Germany
Synopsis
There is growing interest in preclinical imaging and analysis of complex flow patterns. For example, 4D flow imaging of mouse models with vascular plaques or aortic constriction could provide insights into the development and pathogenesis of cardiovascular diseases. Unfortunately, 4D-flow MRI is often compromised by a trade-off of reasonable acquisition durations and achievable spatial resolution. Our work evaluates an undersampling strategy, namely UNFOLD, for preclinical 4D flow MRI, which has the potential to decrease measurement time by 50%. Artifacts emerging from the undersampling are removed by unaliasing in the temporal domain using a lowpass filter after fourier transformation.
Purpose
Preclinical 4D-flow imaging is compromised by very long acquisition times due to the required 3D spatial and velocity encoding. Parallel imaging techniques are less advantageous in preclinical applications than in human MRI, as the number of available receiver coils is typically smaller which limits the achievable acceleration factors. In our study, we quantitatively compare fully sampled datasets to retrospectively undersampled datasets in combination with the UNFOLD reconstruction technique1 to evaluate the performance of the UNFOLD method for preclinical phase contrast MRI. This method has the potential to reduce measurement time by 50%, while preserving high quality magnitude image and velocity data.Methods
Preclinical MR imaging was done on a Bruker Biospec 70/20 USR equipped with a two channel transmit/receive cryogenic (26 K helium cooled, Bruker) mouse head surface coil. Six C57BL/6 mice were measured under the approval of the ethics committee (Ref: G-14-91). A respiration and ECG gated balanced four point cartesian phase contrast sequence2 was used (FOV = 20x16x14 mm³, TE/TR = 2/5; Matrix = 60x50x50 (interpolated to 125x100x88), VENC = 150-170 cm/s; FA = 15°, acquisition time ~ 45 min). Image reconstruction was done offline using Matlab 2015b. To evaluate the UNFOLD technique1, fully sampled datasets were retrospectively undersampled by using every other phase encoding line in an alternating fashion: for odd timeframes all odd phase encoding lines and for even time frames all even encoding lines were maintained, while the remaining lines were discarded as shown in figure 1. A fast fourier transform (FFT) was then applied along the time direction in the undersampled k-space domain and undersampling artifacts were removed with a rectangular filter. The rectangular filter was defined so that the six central frames around the zero frequency after FFT were left unchanged whereas the outer ones are set to zero. Afterwards an inverse FFT was applied in the temporal domain and the unfolded data was conventionally reconstructed. Flow values and peak velocities were evaluated in four planes which were placed perpendicular to the aorta as shown in figure 4 using Ensight (CEI, USA) and in-house built Matlab tools3,4. In each plane, the aorta was manually segmented for every time point. Flow values were analysed via Bland-Altman plot.Results
Aliasing artifacts from undersampling are substantially reduced in the reconstructed UNFOLD images (figure 5). Residual artifacts can be observed in the first and last timeframe of the magnitude images. The comparison of velocity data between fully sampled and undersampled dataset shows minor deviations as seen from the Bland-Altman plot (figure 2). Higher velocities seem to be slightly underestimated whereas at low velocities UNFOLD values appear systematically higher. The highest discrepancy is observed at the first acquired timepoint of the cardiac cycle. The streamlines of fully sampled and undersampled datasets agree very well and reveal the same complex flow pattern (figure 5). Exemplary flow curves over the cardiac cycle of one animal are illustrated in figure 4. Mean peak velocities at the four different evaluation planes for each dataset are shown in figure 3.Discussion
The undersampling artifacts in the magnitude images were strongly reduced and only apparent in the first and last timepoint. Residual artifacts originate mainly from the chest wall that has a very high signal due to its high fat content and its proximity to the surface coil. There is a good agreement between peak velocities and flow curves, the slight underestimation of the peak velocities, as seen in the Bland-Altmann plot, may arise from a temporal filtering effect. Here, improvements could be achieved using tailored filters5 or an increased temporal sampling rate with a higher number of cardiac frames. Nevertheless, the comparison of fully sampled and unfolded data shows consistent flow values and even streamlines of the complex flow pattern in the aorta agree well. Therefore, the implementation of UNFOLD undersampling would enable a shortened measurement time without substantially compromising velocity information. Shorter measurement time may be beneficial to ensure a more stable heart rate during the acquisition, as heart rate changes are more likely to occur over longer timespans6. Additionally shorter measurement times allow higher scanner throughput and reduce animal stress.Conclusion
Measurement time could be decreased by 50% using the UNFOLD technique while preserving the complex flow pattern of the murine aorta. The described technique allows combining 4D-flow imaging together with other imaging protocols, or increase the resolution while maintaining reasonable total scan times. Improvements could be made with a more sophisticated temporal filter design.Acknowledgements
No acknowledgement found.References
1. Madore, B., Glover, G. H. & Pelc, N. J. Unaliasing by fourier-encoding the overlaps using the temporal dimension (UNFOLD), applied to cardiac imaging and fMRI. Magn. Reson. Med. 42, 813–828 (1999).
2. Braig, M. et al. High Quality Preclinical 4D-Flow Phase Contrast Imaging. in (2016).
3. Bock, J., Kreher, W., Hennig, J. & Markl, M. Optimized pre-processing of time-resolved 2d and 3d phase contrast MRI data. in In Proceedings of 15th Scientific Meeting of International Society for Magnetic Resonance in Medicine, (2007).
4. Stalder, A. F. et al. Quantitative 2D and 3D phase contrast MRI: optimized analysis of blood flow and vessel wall parameters. Magn. Reson. Med. 60, 1218–1231 (2008).
5. Kellman, P., Sorger, J. M., Epstein, F. H. & McVeigh, E. R. Low Latency Temporal Filter Design for Real-Time MRI Using UNFOLD. Magn. Reson. Med. Off. J. Soc. Magn. Reson. Med. Soc. Magn. Reson. Med. 44, 933–939 (2000).
6. Constantinides, C., Mean, R. & Janssen, B. J. Effects of Isoflurane Anesthesia on the Cardiovascular Function of the C57BL/6 Mouse. ILAR J. Natl. Res. Counc. Inst. Lab. Anim. Resour. 52, e21–e31 (2011).
Figures
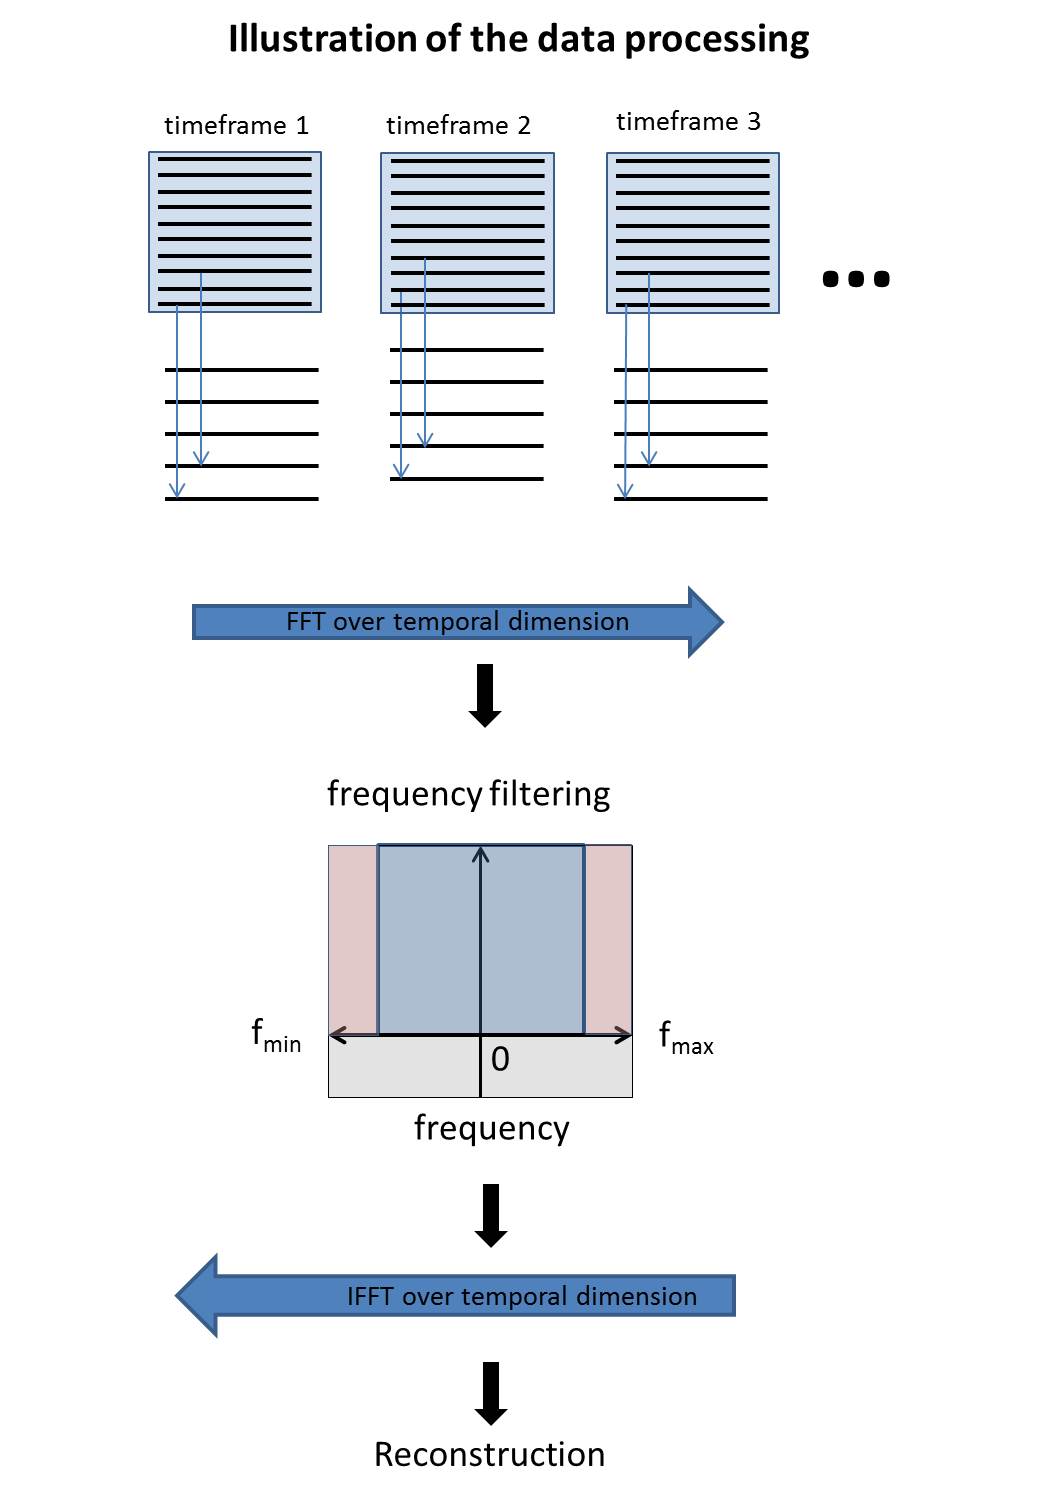
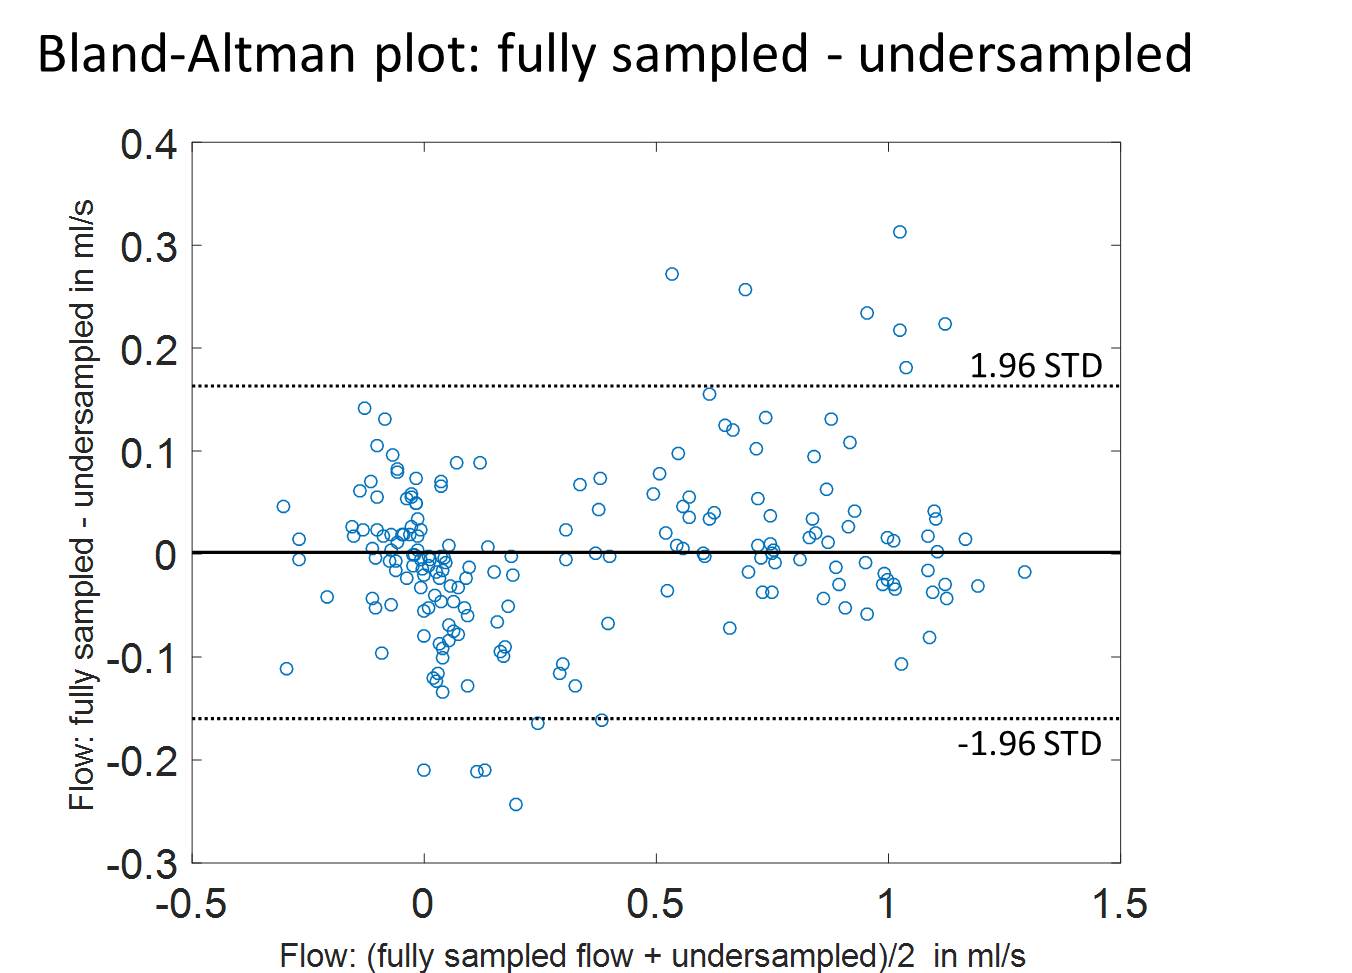
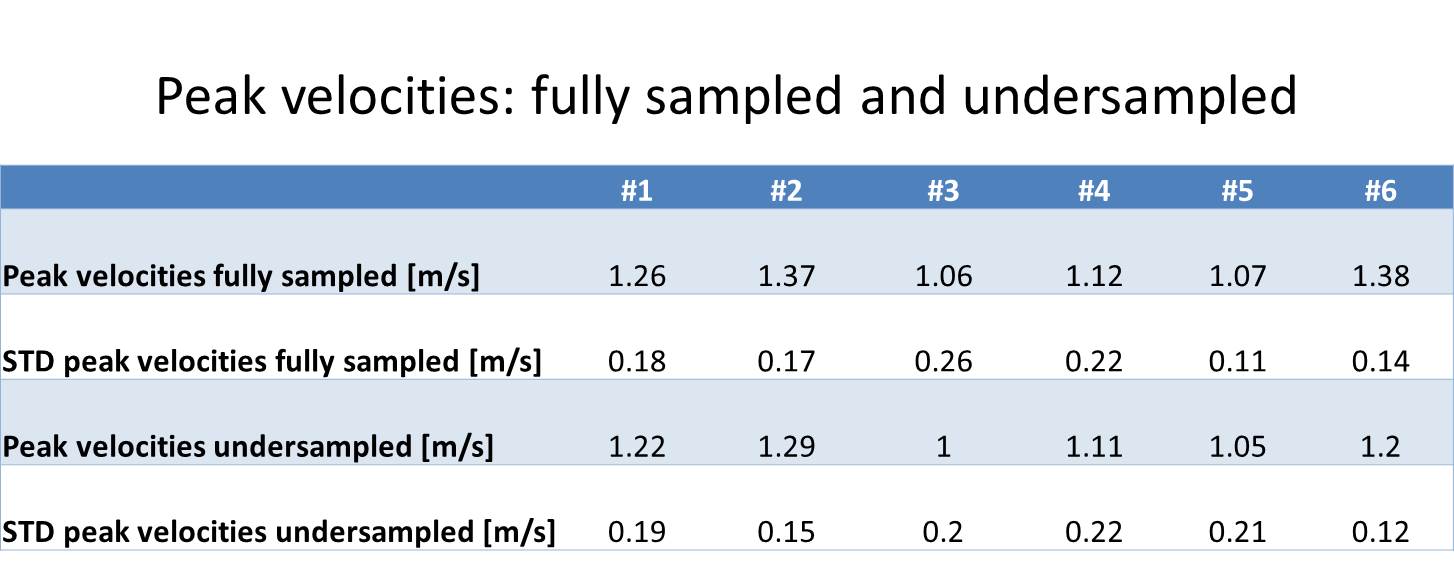
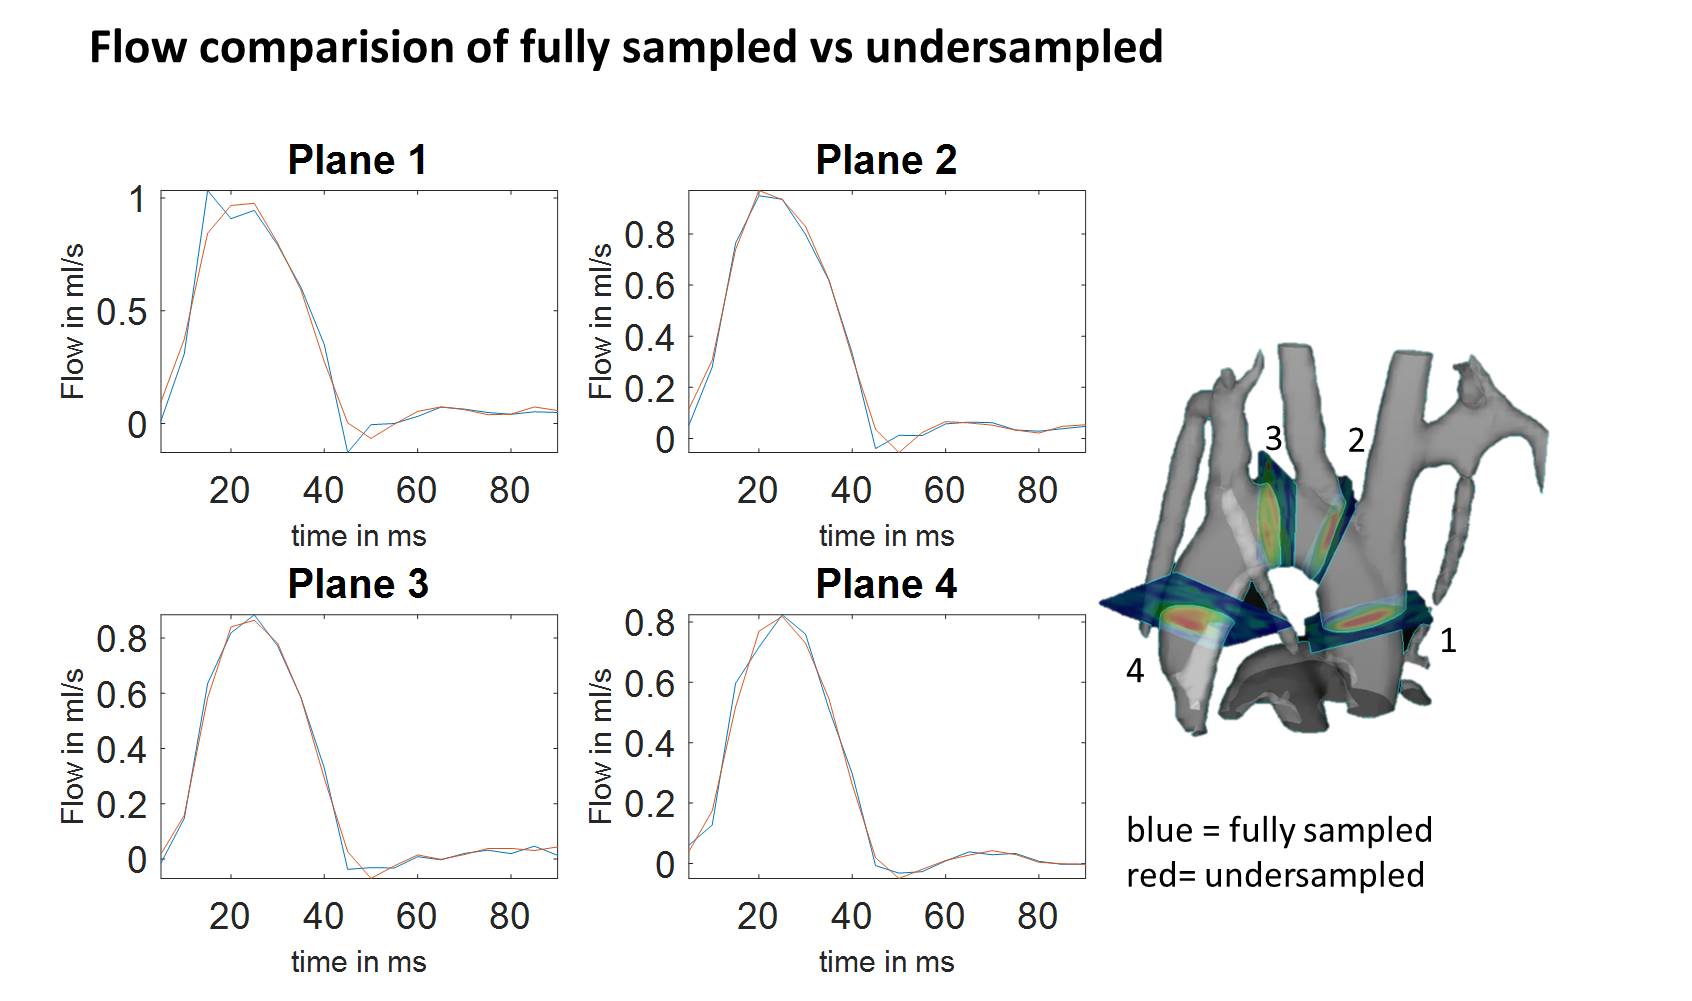
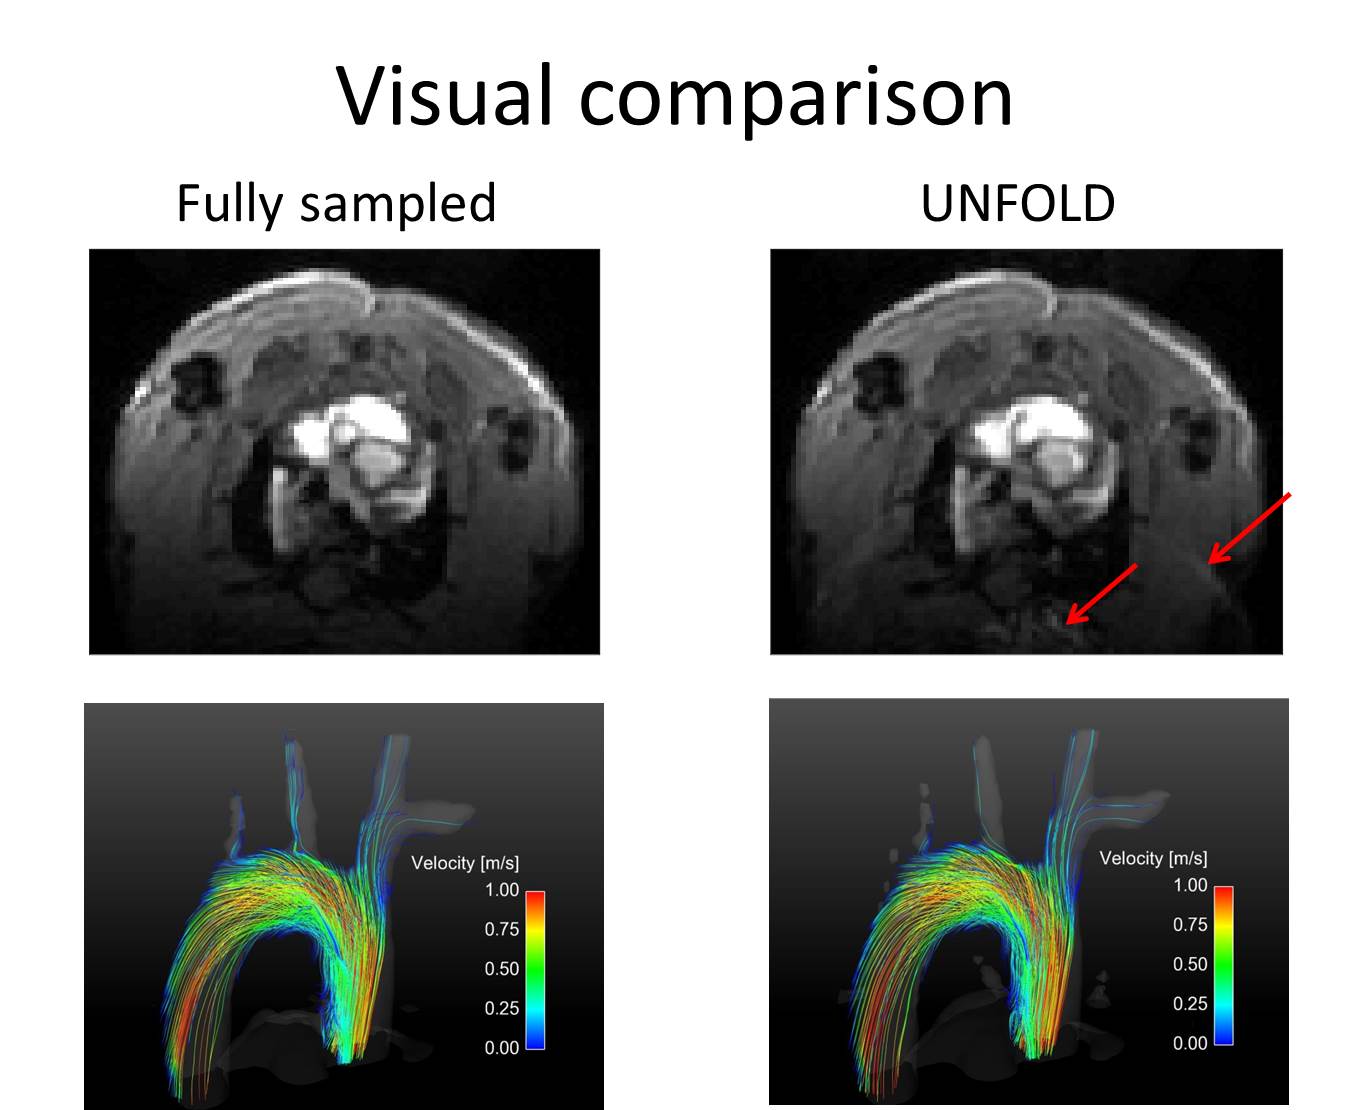
Figure 5:
Top: Sample axial magnitude images (first timepoint) of the fully sampled and unfolded dataset. Images are brightened in order to visualize the residual artifacts as indicated by the red arrows.
Bottom: Streamline representation of the aorta of one subject during mid systole, comparing the fully sampled dataset to the UNFOLD dataset. Streamlines are color coded according to the color bar. Only slight changes are apparent in the blood flow visualization, the complex flow pattern is preserved.