4879
Feasibility of 4D-Flow Imaging of Uterine Blood Flow in the Pregnant Rhesus MacaquePhilip Corrado1, Jacob Macdonald1, Sydney Nguyen2, Kevin Johnson1, Chris Francois3, Ronald R. Magness4, Scott B. Reeder1,3,5,6,7, Ian Bird8, Dinesh Shah8, Thaddeus G. Golos8,9, and Oliver Wieben1,3
1Medical Physics, University of Wisconsin Madison, Madison, WI, United States, 2Endocrinology & Reproductive Physiology, University of Wisconsin Madison, Madison, WI, United States, 3Radiology, University of Wisconsin Madison, Madison, WI, United States, 4Obstetrics & Gynecology, University of South Florida, Tampa, FL, United States, 5Biomedical Engineering, University of Wisconsin Madison, 6Medicine, University of Wisconsin Madison, 7Emergency Medicine, University of Wisconsin Madison, 8Obstetrics & Gynecology, University of Wisconsin Madison, Madison, WI, United States, 9Comparative Biosciences, University of Wisconsin Madison, Madison, WI, United States
Synopsis
4D-Flow MRI is introduced as an alternative to Doppler velocimetry in monitoring blood flow to the placenta in pregnancy. Our 3D radially undersampled PC-VIPR technique provided volumetric coverage of uterus and relevant vasculature with a 10-minute scan. Uterine arteries and ovarian veins were visualized in a 0.83mm isotropic resolution angiogram and flow rates and vessel sizes were measured retrospectively. Repeated scans of four rhesus macaques on subsequent days showed reproducibility of flow rate and cross sectional area measurements in vessels of interest, demonstrating the potential for 4D-Flow MRI for assessing utero-placental vascular health.
Purpose
Reduced uterine blood supply has been shown to cause complications in pregnancy including fetal growth restriction1. The uterine arteries and uterine branches of the ovarian arteries supply most of the oxygenated blood to the uterus. Doppler velocimetry is used clinically to assess blood flow in the uterine arteries2 but it is dependent on operator skill and patient anatomy and not routinely used to assess contributions of the uterine branches of the ovarian artery. There is an unmet need for a more robust imaging method3,4. Attempts at using 2D PC MRI have been unsuccessful so far due to complexity of anatomy5. Here we examined the feasibility of a new approach using 4D-Flow MRI, which can capture vascular anatomy and the blood velocity field over a large imaging volume. We aimed to visualize the uterine and ovarian arteries and veins and the corresponding flow rates in a rhesus macaque. Measurements were taken on two consecutive days to assess their reproducibility.Methods
Four healthy, pregnant rhesus macaques were imaged on two consecutive days on a 3.0 T scanner (Discovery MR750, GE Healthcare, Waukesha, WI) with a 32 channel phased array torso coil (Neocoil). All procedures were approved by our institution’s animal care and use committee (IACUC). All monkeys were in the late 2nd trimester and imaged in right lateral position. Imaging was performed with a radially undersampled (PC-VIPR6) acquisition (TR/TE=6.4/2.8ms; FA=8°; VENC=60cm/s; FOV=16x16x16cm3; voxel size=0.83x0.83x0.83mm, scan duration=10min) with retrospective ECG and respiratory gating (50% efficiency). During each scan, the mother and, thereby, the fetus were sedated with isoflurane to minimize motion. Segmentation of maternal vessels (from the PC MRA images) was performed using MIMICS (Materialise, v18.0). Flow and cross sectional area were measured and visualized at midpoints in the uterine and ovarian vessels using Ensight (CEI Inc., v10.0). Reproducibility was quantified as the relative change in the measurement from day 1 to day 2.Results
Figure 1 shows the segmented
maternal and fetal vessels for Monkey 1. In this scan both uterine arteries and
ovarian veins were visualized. As in all other scans, uterine veins and ovarian
arteries were not visible. For each monkey, only one of the two ovarian veins
was visible on both scans, and in one monkey the right uterine artery (RUA) was
not visible on day 2, so a total of 11 vessels were analyzed for
reproducibility: 4 left uterine arteries (LUA), 3 RUAs, 1 left ovarian vein
(LOV), and 3 right ovarian veins (ROV). Descending aorta measurements were also
included for comparison. Figure 2a shows a visualization with velocity vectors
and streamlines of a Monkey 1 scan. Figures 2b and 2c show closer views of the
ROV and LOV, respectively, and figures 2d and 2e show the transverse velocity
profile of the RUA at the location of a manually placed plane. Figure 3
compares measurements of flow and vessel cross sectional area from consecutive
days. Eight of eleven flow measurements and eight of eleven area measurements varied
less than 20% between days 1 and 2.Discussion
Uterine
arteries were reliably visualized using this 4D-Flow technique. The ovarian
arteries could not be visualized, likely due to velocity to noise ratio or spatial
resolution limitations. At least one ovarian vein was present in all images,
however, and flow in these vessels may be of interest as a surrogate to ovarian
arterial flow. Most of the subsequent flow measurements vary by a margin
contributable to physiologic fluctuations, but the variation between day-to-day
flow measurements in the LUA for monkeys 2 and 3, and in the RUA for monkey 4 was
larger than anticipated. This might be due to physiological variations (e.g. postprandial,
anesthetic effects) or limitations of our approach (spatial resolution in small
vessels, suboptimal VENC for these vessels, operator segmentation errors, or
other sources). In future validation studies, we will assess repeatability for
back-to back scans and include inter-operator assessment, flow comparisons with
Doppler studies, and area comparisons with high resolution contrast-enhanced
MRA.Conclusion
This feasibility study demonstrated that 4D-Flow MRI can indeed be used to determine flow rates and vessel lumen cross sectional areas in the uterine arteries and ovarian veins of the pregnant rhesus macaque with acceptable reproducibility. Uterine veins and the ovarian arteries as well as the uterine branches of the ovarian arteries could not be assessed, most likely due to small vessel size and/or low blood velocity. Larger vessels and flow rates in humans may improve the accuracy of this technique in humans, albeit presenting additional challenges with fetal motion and the need to cover a larger imaging volume.Acknowledgements
The authors acknowledge the support of the NIH Human Placenta Project (NICHD U01HD087216) and NIH grant number P51 OD011106 to the Wisconsin National Primate Research Center. We also thank GE Healthcare for their support.References
1. Browne et al. Uterine artery blood flow, fetal hypoxia and fetal growth. Philosophical Transactions of the Royal Society B: Biological Sciences. 2015;370(1663):20140068. 2. Palmer et al. Quantitative estimation of human uterine artery blood flow and pelvic blood flow redistribution in pregnancy. Obstet Gynecol 1992;80(6):1000-6. 3. Nohr et al. Maternal obesity and neonatal mortality according to subtypes of preterm birth. Obstet Gynecol 2007;110(5):1083–1090. 4. Santolaya et al. Ultrasonographic growth and Doppler hemodynamic evaluation of fetuses of obese women. J Reprod Med. 1994;39(9):690-4. 5. Pates et al. Determining uterine blood flow in pregnancy with magnetic resonance imaging 2010;28:507-10. 6. Gu et al. PC VIPR: A High-Speed 3D Phase-Contrast Method for Flow Quantification and High-Resolution Angiography. Am J Neuroradiol 2005;26:743–749.Figures
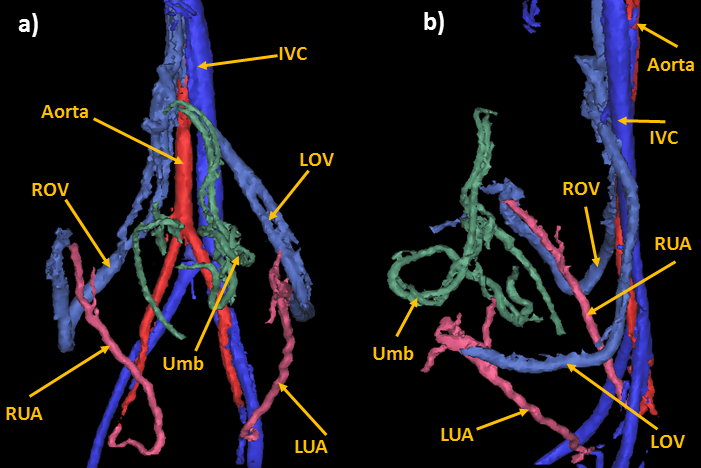
Figure 1: PC MRA of the maternal and fetal
vasculature of Monkey 1 after segmentation in a coronal (a) and a sagittal view
(b). IVC: inferior vena cava, ROV: right ovarian vein, LOV: left ovarian vein, RUA:
right uterine artery, LUA: left uterine artery, Umb: umbilical cord.
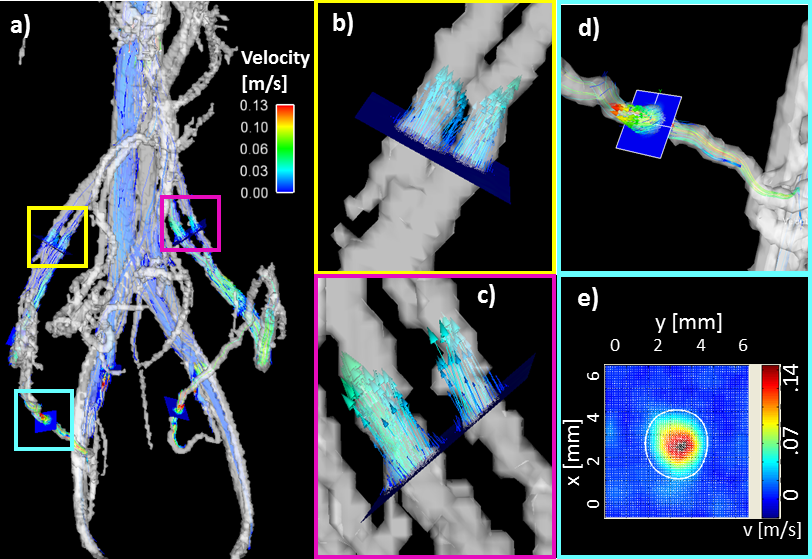
Figure
2: a) 3D rendering of the vasculature of Monkey 1: PC MRA is shown in
semi-transparent greyscale; velocity vectors and streamlines characterize blood
flow and cut planes are placed for flow and area analysis. b) Right and c) Left
ovarian vein, respectively, with velocity vectors representing local speed and
direction of blood flow. In both cases, the ovarian vein splits into two
parallel segments before rejoining near the inferior vena cava, and the ovarian
arteries were not visualized. d) Cut plane placed on right uterine artery. e)
Corresponding RUA transverse velocity map for vessel cross sectional area and
flow rate measurements.
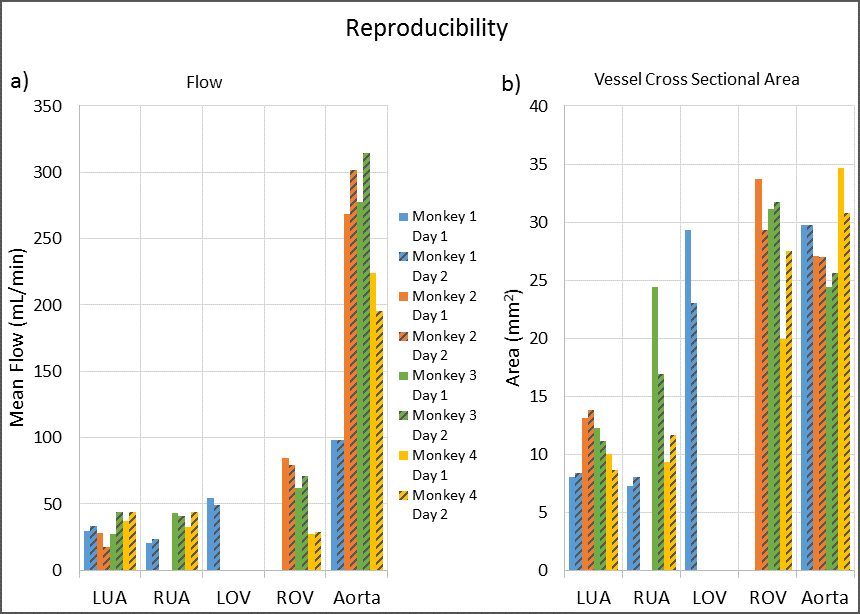
Figure 3: a) Flow and b) Cross sectional area
measurements on consecutive days in left uterine artery (LUA), right uterine
artery(RUA), left ovarian vein (LOV), right ovarian vein (ROV), and aorta for
four monkeys. Measurements were omitted for both days when a vessel was not
visualized on either day 0 or 1. Most measurements were reproducible to within
20%, but several exceptions exist. These discrepancies might stem from (1) physiological
changes, (2) technical limitations of the approach (limited spatial resolution,
suboptimal VENC, etc.), (3) operator errors (plane placement and vessel
boundary segmentation), or (4) other sources