4878
TWO-DIMENSIONAL PHASE-CONRAST MAGNETIC RESONANCE IMAGING AS TOOL TO DETERMINE HEPATIC HEMODYNAMICS IN RATS WITH A HEALTHY, FIBROTIC OR CIRRHOTIC LIVER1Institute for Exercise- und Occupational Medicine, Center for Medicine, Medical Center - University of Freiburg, Freiburg, Germany, 2Faculty of Medicine, University of Freiburg, Freiburg, Germany, 3Department of Pharmaceutical Biology and Biotechnology, University of Freiburg, Freiburg, Germany, 4Department of Radiology Medical Physics, Medical Center – University of Freiburg, Freiburg, Germany, 5Institute of Clinical Pathology, Medical Center – University of Freiburg, Freiburg, Germany, 6German Cancer Consortium (DKTK), Heidelberg, Germany, 7German Cancer Research Centre (DKFZ), Heidelberg
Synopsis
In this work we wanted to test a Magnetic Resonance (MR) scanning protocol as a non-invasive tool to determine hepatic hemodynamics and to assess the liver fibrosis degree in an animal model of liver fibrosis and cirrhosis. MR rat liver images provided a good discrimination of healthy from diseased liver, but for the assessment of liver fibrosis degree histology is indispensable. The results show that portal and aortal flow patterns for a cardiac cycle could be measured with high reliability in Conclusion, this MR scanning protocol presents a reliable non-invasive tool to determine hepatic hemodynamics in healthy and diseased rats
Introduction
Liver cirrhosis is a frequent and worldwide disease. The altered hepatic architecture leads to circulatory abnormalities, namely portal hypertension, splanchnic vasodilation and hyperdynamic circulation1, thus causing serious hemodynamic alterations. Multi-dimensional phase-contrast MR (PC-MR) imaging is a preferred technique to determine blood flow in preclinical and clinical studies. Some preclinical hemodynamic studies in small laboratory animals using multi-dimensional PC-MR imaging have been already performed; mostly investigating cardiovascular hemodynamics2-4, whereas only few focus on portal hemodynamic changes induced by liver cirrhosis5+6. In this experimental study, we wanted to test a MR scanning protocol as a non-invasive tool to determine hepatic hemodynamics and to assess the liver fibrosis degree in an animal model of liver fibrosis and cirrhosis.Materials and Methods
Animal care was performed in accordance to the local rules and regulations of the German animal protection law and the European animal care guidelines. Fifty-four male Wistar rats (Charles River, Germany) were studied. Fifteen rats were left untreated, whereas 39 rats received Thioacetamide [TAA] (Sigma-Aldrich, Germany) in their drinking water to induce liver disease. From the 39 TAA-treated rats 15 received TAA for 12 weeks and 24 for 16 weeks. One or two days before TAA treatment was finished, MR measurements were performed using a 9.4 T preclinical scanner (Bruker, Germany) and a dedicated quadrature volume rat coil under isoflurane anesthesia. The following hemodynamic parameters were investigated: portal cross-sectional area, mean portal flow velocity, portal and aortal flow volume rate. A T1-RARE axial sequence was carried out to detect any morphological changes in the liver tissue due to disease- related changes. Parameters of the axial flow-sensitive 2D PC-MR sequences were TE/TR/FA 5ms/16.5ms/70°, slice thickness 2.5 mm for the portal vein and TE/TR/FA 5ms/16,5ms/70 for the abdominal aorta. Velocity encoding settings were committed to 30 cm/s for the portal vein and 120 cm/s for the abdominal aorta. The flow-sensitive 2D PC-MR data were postprocessed by an experienced and blinded preclinical radiologist with a homebuilt analysis tool (Matlab; Math-Works, Mass). 2D PC-MR slices being positioned orthogonal to the portal vein and the abdominal aorta enable the selection of the region of interest (ROI) of the two vessels. Since ROI is equivalent to the vessel´s cross-sectional area, it was multiplied by the corresponding flow velocity to calculate the flow volume rate (‘Volume rate = Area * Velocity’) of the portal vein and the abdominal aorta for a cardiac cycle. Furthermore, the degree of liver fibrosis was assessed by a self-established MR score and verified by a standardized histological score (Desmet score)7.Results and Discussion
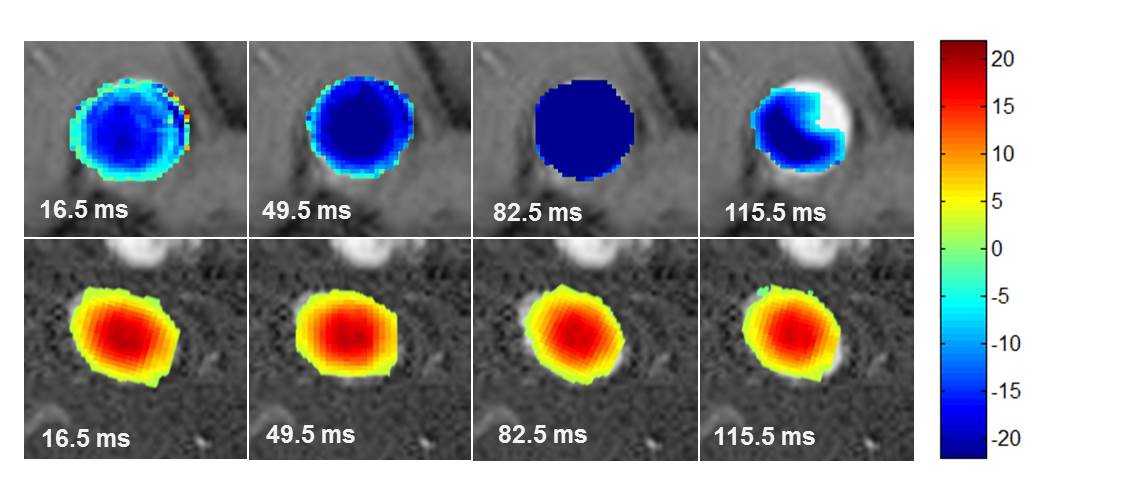
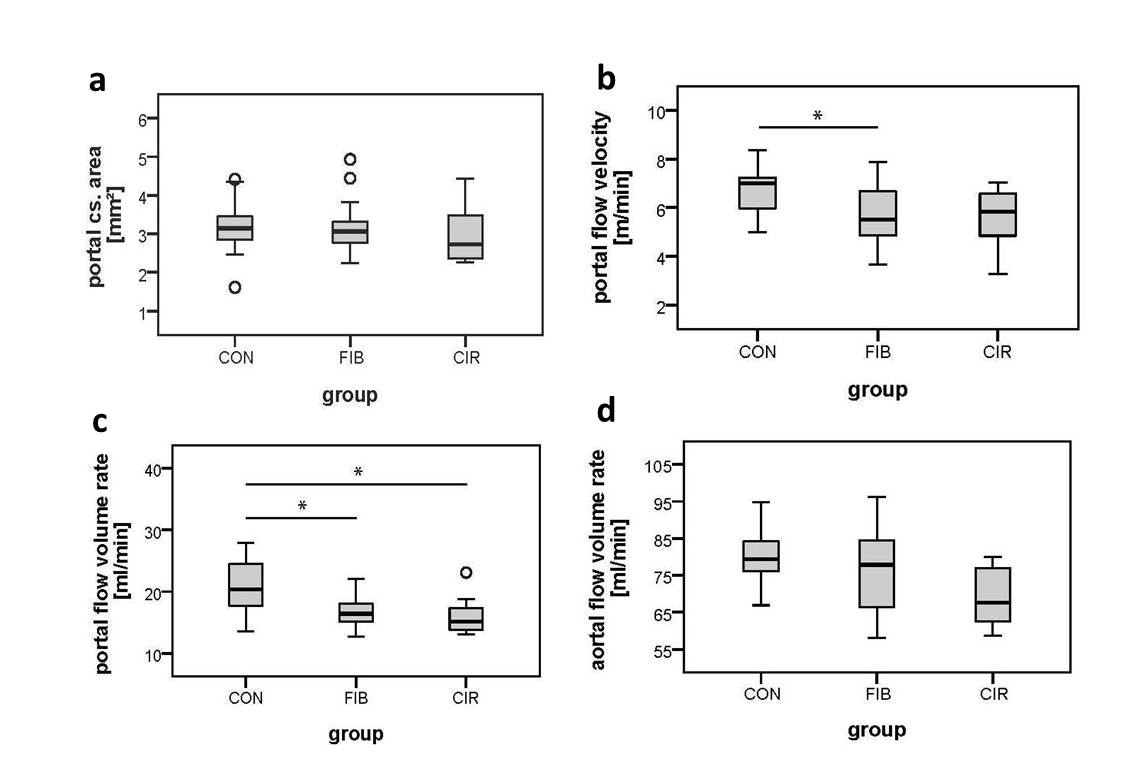
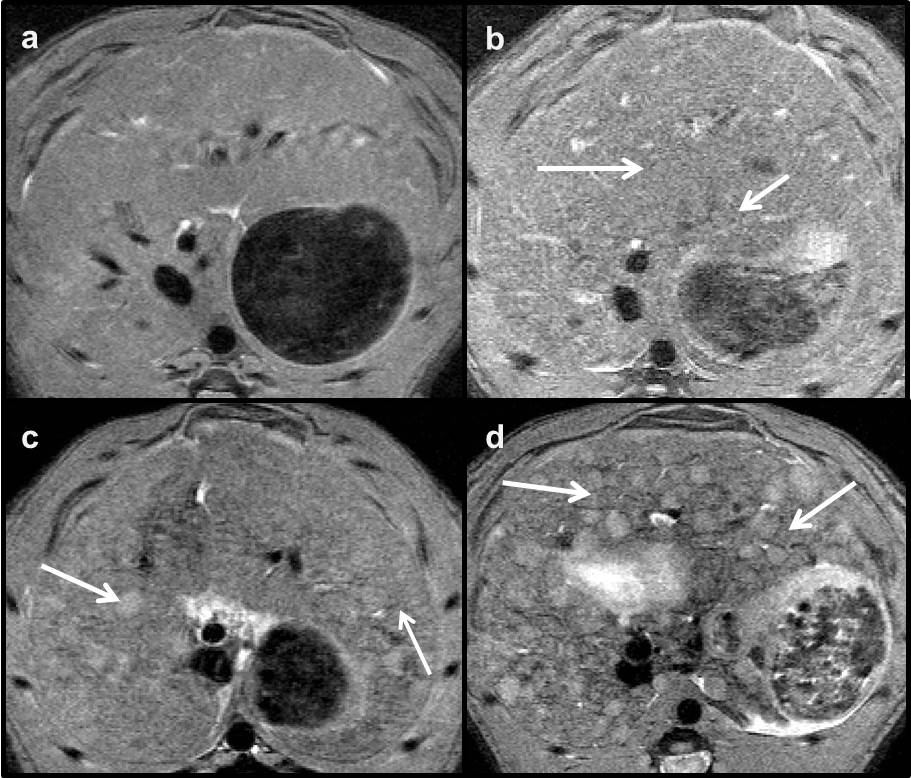
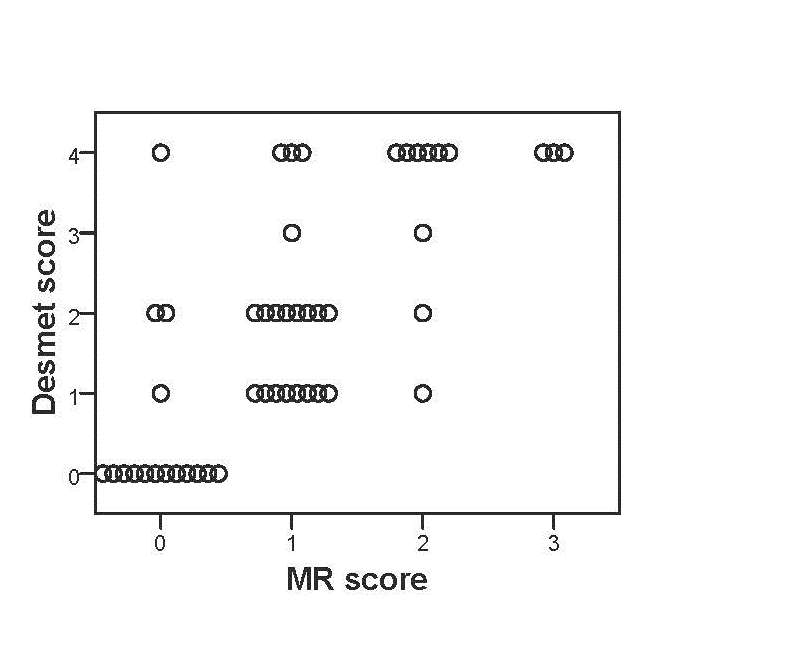
Flow velocities of the portal vein and the abdominal aorta of the rats were monitored for a cardiac cycle (fig. 1). Flow patterns reflect physiological conditions with a constant portal and a pulsatile aortal flow pattern. For the statistical analysis of the hemodynamic parameters the rats (n=46) were divided into three groups: control (CON) n=13, fibrosis (FIB) n=25 and cirrhosis (CIR) n=8. In this animal model the development of fibrosis was sufficient to cause a significant decrease in portal flow velocity (FIB vs. CON: -21%, p=0.006 and CIR vs. CON: -17%, p=0.105) and portal flow volume rate (FIB vs. CON: -20%, p=0.009 and CIR vs. CON: -25%, p=0.024) (fig.2). Considering the portal cross-sectional area and the aortal flow volume rate no significant differences among groups could be found. Liver fibrosis degree was assessed with an MR approach and a self-established four-level MR score (n=48) (fig. 3+4). If the histological score is taken as standard, the MR score has a sensitivity of 89% (32/36) to identify diseased livers and a specificity of 100% (12/12) to identify healthy livers. The accurate assessment of liver fibrosis degree in diseased rats as well as the detection of CCCs is not possible by MR rat liver images evaluation. Instead histological evaluation is necessary. The testing showed that the scanning protocol facilitates a reliable determination of hemodynamic parameters even in small vessels like the portal vein of rats. It furthermore enables the detection of hemodynamic alterations induced by liver disease. In this particular animal model, even in fibrotic rats a markedly reduced portal flow velocity and volume rate was found compared to healthy rats. Moreover, the evaluation of the MR rat liver images enables a good differentiation of a healthy from a diseased liver. In conclusion, this study proposes a MR scanning protocol as a non-invasive tool to determine hepatic hemodynamics with high reliability even in small vessels of healthy and diseased rats.Acknowledgements
No acknowledgement found.References
1. Prin M1, Bakker J1, Wagener G1. Hepatosplanchnic circulation in cirrhosis and sepsis. World J Gastroenterol. 2015 Mar 7;21(9):2582-92. doi: 10.3748/wjg.v21.i9.2582.
2. Kristine Skårdal, Emil KS Espe, Lili Zhang, Jan Magnus Aronsen, Ivar Sjaastad. Three-Directional Evaluation of Mitral Flow in the Rat Heart by Phase-Contrast Cardiovascular Magnetic Resonance. PLoS One. 2016; 11(3): e0150536. Published online 2016 Mar 1. doi: 10.1371/journal.pone.0150536
3. Bovenkamp PR1, Brix T, Lindemann F, Holtmeier R, Abdurrachim D, Kuhlmann MT, Strijkers GJ, Stypmann J, Hinrichs KH, Hoerr V. Velocity mapping of the aortic flow at 9.4 T in healthy mice and mice with induced heart failure using time-resolved three-dimensional phase-contrast MRI (4D PC MRI). MAGMA. 2015 Aug;28(4):315-27. doi: 10.1007/s10334-014-0466-z. Epub 2014 Nov 8.
4. Dall'Armellina E1, Jung BA, Lygate CA, Neubauer S, Markl M, Schneider JE. Improved method for quantification of regional cardiac function in mice using phase-contrast MRI. Magn Reson Med. 2012 Feb;67(2):541-51. doi: 10.1002/mrm.23022. Epub 2011 Jun 14.
5. Wang Y, Booth CJ, Kim H, Qiu M, Constable RT. Evaluation of hepatic fibrosis with portal pressure gradient in rats. Magn Reson Med. 2009 May; 61(5):1185-92. doi: 10.1002/mrm.21964.
6. M. Chouhan, A. Bainbridge, N. Davies, R. Mookerjee, R. Jalan, S. Walker-Samuel, M. Lythgoe, S. Punwani, S. Taylor. Invasive validation and assessment of baseline portal venous flow in normal and cirrhotic rats using phase-contrast MRI at 9.4T. ECR 2013, C-1651, DOI: 10.1594/ecr2013/C-1651
7. Desmet VJ, Gerber M, Hoofnagle JH et al. (1994) Classification of chronic hepatitis: diagnosis, grading and staging. Hepatology 19: 1513–1520
Figures