4877
Simultaneous Cardiac and Renal oblique-slice T1-Mapping Differentiates Contrast Agent Activity in Normal and Doxorubicin-treated Rats1MRI Research Center, Auburn University, Auburn, AL, United States, 2Department of Anatomy, Physiology and Pharmacology, Auburn University, Auburn, AL, United States, 3Department of Chemistry and Biochemistry, Auburn University, Auburn, AL, United States, 4MR R&D, Siemens Healthcare, Malvern, PA, United States
Synopsis
We developed a cardiac multi-oblique-slice T1-mapping sequence,
called Tmax, for simultaneous in vivo
cardiac and multi-region T1-mapping in rats. We
validated Tmax with gadolinium contrast agent (CA) scans then applied it to support our concurrent development of a reactive
oxygen species activated T1-shortening agent, called H4qtp2, in doxorubicin-treated (Dox) rats. The new Tmax sequence performed excellent at simultaneously
quantifying gadolinium T1 effects in cardiac and renal regions. However, application of Tmax with low dose
levels of H4qtp2 CA in Dox rats gave marginal results from
too low dose of H4qtp2 to sufficiently affect
the T1 and quantify Dox-induced pathology
Pupose
T1-shortening contrast agents (CA) enhance MRI diagnostic sensitivity and specificity. This creates a need for versatile MRI sequences that simultaneously quantify CA activity in multiple regions of the body. We developed a cardiac multi-oblique-slice T1-mapping sequence (called Tmax) for simultaneous multi-region in vivo T1-mapping in rats. This Tmax sequence is used to support our concurrent development of a reactive oxygen species-activated T1-shortening agent (called H4qtp2)1. We previously demonstrated with cardiac T1-mapping that high-dose H4qtp2 specifically detects myocardial oxidative stress in doxorubicin-treated (Dox) rat hearts2, where Dox-treatment is established to induce congestive cardiac failure3, 4. However, this previous work T1-mapped only the heart without quantifying H4qtp2 activity in other regions. In this study, we validated the new Tmax T1-mapping sequence with gadolinium CA, and then applied Tmax to Dox-treated rats with low dose levels of H4qtp2Methods
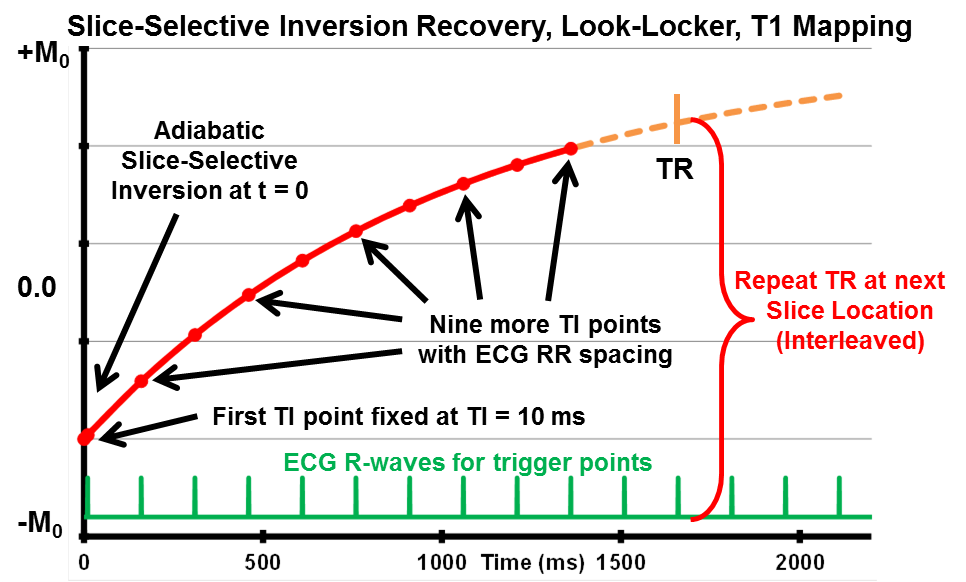
Tmax is a cardiac-gated, multi-oblique, slice-selective inversion recovery (IR), Look-Locker, T1-mapping sequence for rodent heart rates. Multiple slices are ECG-gated and temporally interleaved at each TR which creates identical timing and extended T1 recovery time for each slice. Figure 1 shows the sequence timing for one slice with an initial fixed TI at 10 ms and 9 more TI points spaced at the rodent heart-rate RR period (140-190 ms) for a total 10 TI points along the T1 IR curve that each occur at end-diastole. Parameters included: flip angle = 4°, averages = 8, per-slice TR = 1600 ms, BW = 520 Hz/pix, field-of-view = 48x48 mm, pixel size = 0.33x0.33 mm, and slice thickness = 2 mm. All scans were accomplished on a 7T human-size scanner (Siemens, Erlangen, DE) with a birdcage animal RF coil (Rapid, Columbus, OH). Rats in this study were treated under the guidelines of our institutional animal care and use committee. Groups of Sprague Dawley rats included 1) normal Controls (n=3) and 2) Dox-treated for 7-days (15 mg/kg, n=6). During MRI rats were anesthetized with 1% isoflurane and kept warm in a custom warmed animal holder. All MRI scans include dark-blood cine for cardiac function, then 2-slice Tmax T1-mapping with slice-1 positioned as cardiac mid-left ventricular (LV) short-axis slice and slice-2 as abdominal coronal slice to intersect both kidneys. Gadolinium CA was used for initial Tmax validation where Control rats received 2-slice Tmax T1-mapping before and 15 minutes after receiving intraperitoneal injected Gd-DO3A-butrol (Gadovist, 0.2 mmol/kg). For low dose H4qtp2 testing, Dox rats received 2-slice Tmax T1-mapping before and 15 minutes after receiving intravenous injected H4qtp2 (4 mg /kg). All T1 curve-fitting and image analyses were performed on custom Matlab programs (Mathworks, Natick, MA) where regions of interest (ROI) included the segmented LV myocardium for cardiac T1-maps and both kidneys for renal T1-maps .Results
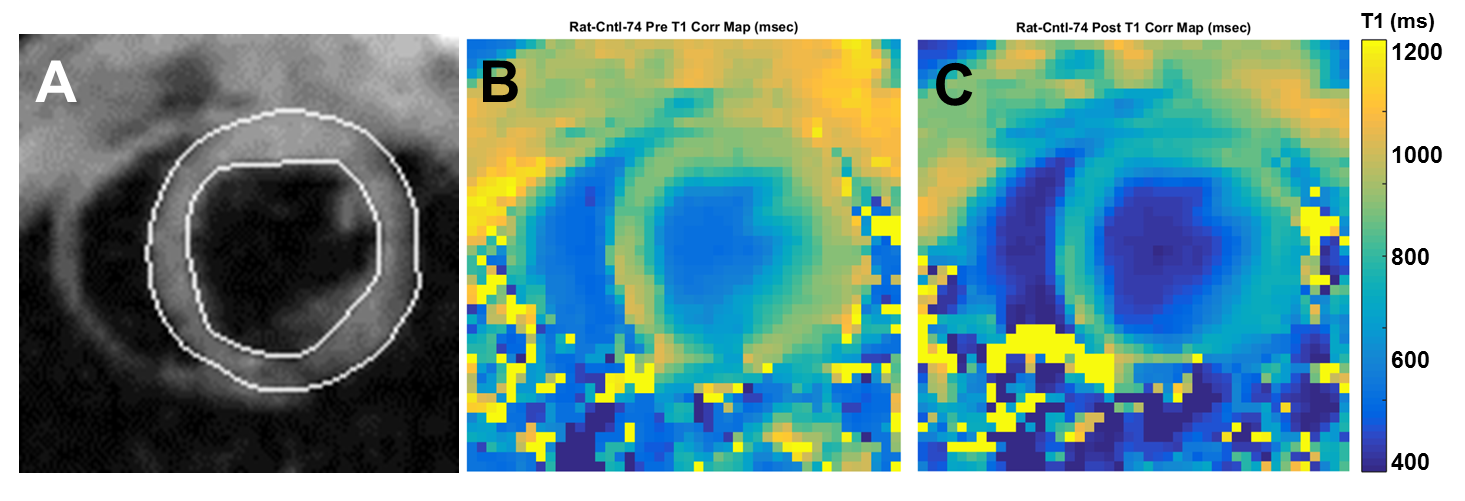
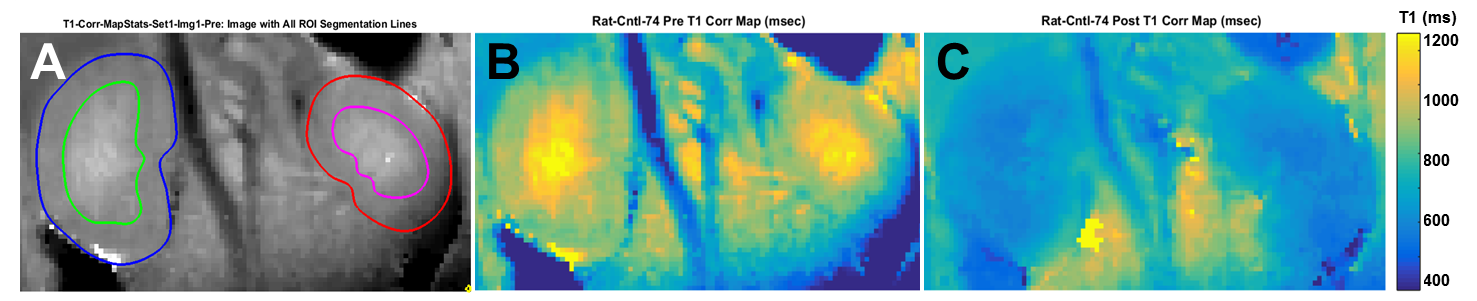
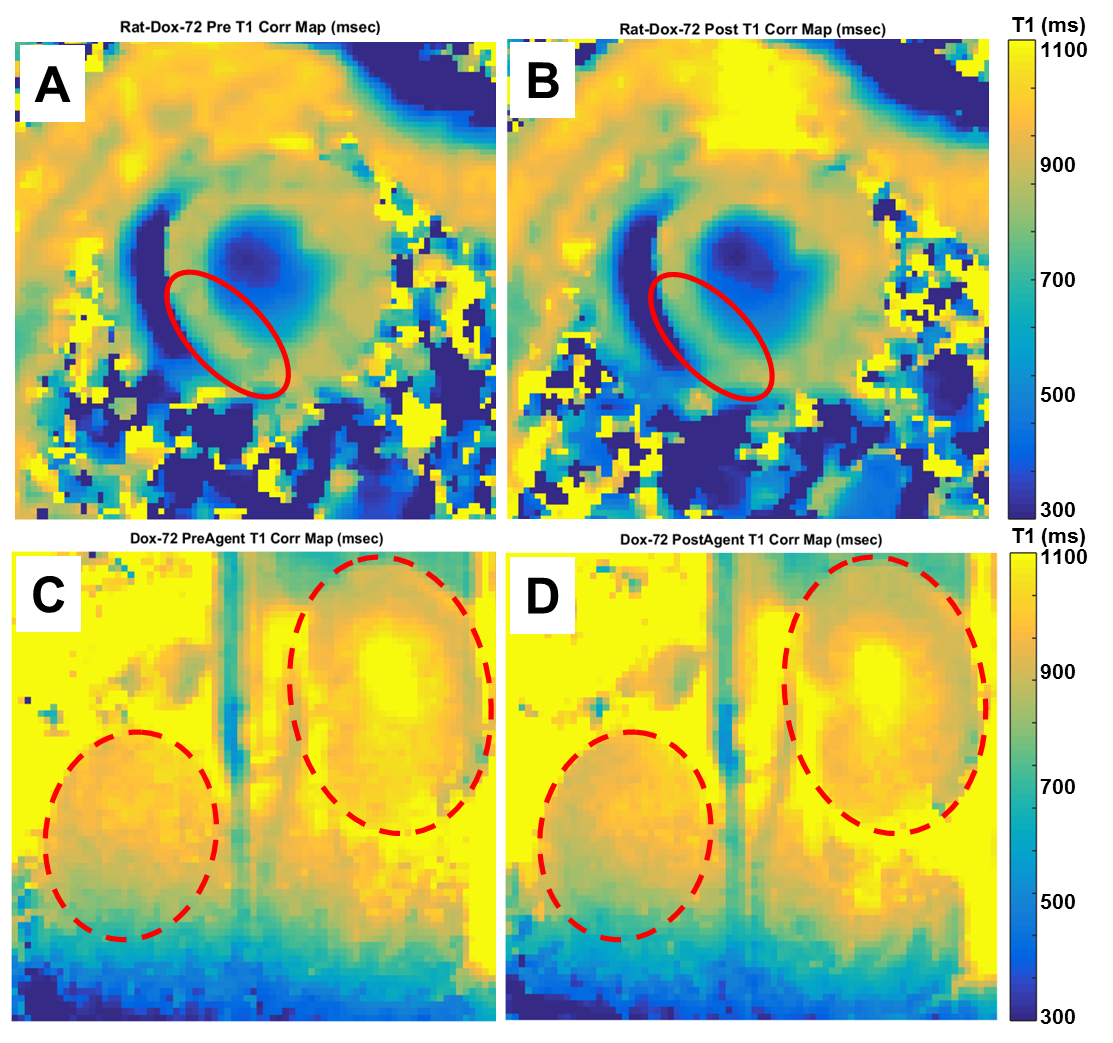
Tmax validation scans with Gadolinium CA in Control rats gave excellent results. Figure 2 presents cardiac Tmax T1-mapping results with Panel A: dark-blood cine image frame with LV segmentations lines, Panel B: pre-gadolinium T1-map with entire LV ROI estimated T1 = 1055±75 ms (mean±sd), Panel C: post-gadolinium T1-map with entire LV ROI estimated T1 = 890±62 ms. This gadolinium-induced drop of ΔT1 = 165 ms validates that Tmax T1-mapping successfully quantifies changes of cardiac T1. Figure 3 presents renal Tmax results with Panel A: kidney coronal image with segmentations lines for outer renal cortex and inner renal medula, Panel B: pre-gadolinium T1-map with outer renal cortex estimated T1 = 1140±105 ms and inner renal medula estimated T1 = 1290±195 ms, Panel C: post-gadolinium T1-map with outer renal cortex estimated T1 = 761±95 ms and inner renal medula estimated T1 = 710±115 ms. These respective ΔT1 drops of 379 and 580 ms further validate Tmax ability to quantify different T1 changes in different regions. Unfortunately, high morbidity allowed only two Dox rats to receive MRI with marginal results. Figure 4 presents Dox rat cardiac and renal Tmax T1-mapping results before and after low-dose H4qtp2 injection with Panel A: cardiac before H4qtp2, Panel B: cardiac after H4qtp2 where a weak drop of ΔT1 = 110 ms was detected only in the inferior septum (red circle). Panel C: renal before H4qtp2 and Panel D: renal after H4qtp2 show no change of T1 from low-dose H4qtp2.Discussion
The Tmax sequence simultaneously quantified gadolinium-induced cardiac and renal T1 changes. Compared to previously effective high-dose H4qtp2 results, low-dose results were ineffective for detecting oxidative stress in Dox rats; however, the Tmax sequence helped characterize this shortfall.Conclusions
We developed and validated a new cardiac multi-region T1-mapping sequence for rats. This capability will be used with H4qtp2 at various dose levels to investigate oxidative stress.Acknowledgements
Special appreciation to Martha Forloines for her valuable management of MRI operations and technical assistance.References
1. Yu M, et al, "A Mononuclear Manganese(II) Complex Demonstrates a Strategy to Simultaneously Image and Treat Oxidative Stress", J Am Chem Soc 2014, 136:12836-9
2. Beyers RJ, et al, “Cardiac in vivo T1-Mapping with Novel Reactive Oxygen Species Sensing Agent Specifically Detects Cardiac Oxidative Stress in Doxorubicin-treated Rats", Proc ISMRM 24th AM, Singapore, ISSN 1545-4428, 2016
3. Kayama Y, et al, “Diabetic Cardiovascular Disease Induced by Oxidative Stress", Int J Mol Sci 2015, 16(10):25234-63
4. Hershman DL, et al, “Doxorubicin, Cardiac Risk Factors, and Cardiac Toxicity in Elderly Patients With Diffuse B-Cell Non-Hodgkin's Lymphoma”, JCO 2008, 26(19):3159-65
Figures