4874
Repeatability and User Variability of Myocardial Tissue Phase Mapping in MiceNivedita K. Naresh1, Cynthia Yang1, Sol Misener1, Bradley D. Allen1, Michael Markl1,2, James C. Carr1,3,4, and Daniele Procissi1
1Radiology, Northwestern University, Chicago, IL, United States, 2Biomedical Engineering, Northwestern University, Chicago, IL, United States, 3Medicine, Northwestern University, Chicago, IL, United States, 4McCormick School of Engineering, Northwestern University, Chicago, IL, United States
Synopsis
Mouse models can help investigate the molecular mechanisms underlying complex cardiovascular diseases. Assessment of myocardial regional wall motion plays a very important role in the diagnosis and management of several cardiovascular diseases and can be linked to many underlying biological processes. In this study, we evaluated the repeatability and inter-user variability of the myocardial tissue phase mapping method in mice. We found that myocardial tissue phase mapping can be performed with good repeatability and little user variability in mice to reliably quantify both global and regional myocardial velocities.
Introduction
Mouse models can help investigate the molecular mechanisms underlying complex cardiovascular diseases. Assessment of myocardial regional wall motion plays a very important role in the diagnosis and management of several cardiovascular diseases and can be linked to many underlying biological processes. Our purpose was to study the repeatability and inter-user variability of myocardial tissue phase mapping (TPM) method and to quantify the variability in TPM-derived global and regional velocities.Methods
10 week old female C57Bl/6 mice (n=6) were imaged at 7T. Mice were maintained at 1.25% isoflurane and 36±10C during MRI. 2D cine black-blood phase-contrast MRI with prospective ECG and respiratory triggering of the mouse heart was performed at basal, mid-ventricular, and apical locations. Imaging parameters included: TE/TR =3.4/5.2 ms, FOV=30x30 mm2, phase resolution=50%, image resolution =117x117 µm2, flip angle=150, slice thickness=1 mm, averages=3, in-plane VENC= 4 cm/s and through-plane VENC= 4cm/s. A segmented acquisition (1 line per heartbeat) was used and the velocity–encoded scans were acquired in consecutive heartbeats to perform imaging at a high temporal resolution. The scan time was 7-8 min per slice depending on the ECG and respiratory rates. All mice were scanned on two separate days to test for reproducibility of the TPM method. For all mice, radial and longitudinal mean velocity-time curves were measured at base, mid, and apex. Global peak and time-to-peak (TTP) radial and longitudinal velocities were also quantified for all mice. For regional analysis, all velocity data were mapped on the standard American Heart Association 16 segment LV model. Regional peak radial and longitudinal velocities were calculated by averaging over all LV segments in the basal, mid-ventricular and apical slices. All data was analyzed by two users in an independent and blinded manner. Bland-Altman analysis was used to compare the between-session repeatability and inter-user variability of the technique. Paired t-test was used to compare the inter-scan and inter-user variability.Results
Example magnitude and phase difference images obtained in a mouse using the TPM method are shown in Figure 1 (A-B, C-D). Figure 2 (A-B) shows mean radial and longitudinal velocity-time curves over all 6 mice obtained from a mid-ventricular slice for the two sessions showing good agreement between the two scans. Figure 2 (C-D) shows mean radial and longitudinal velocity-time curves over all 6 mice as calculated by the two users, showing little inter-user variability. Bland-Altman plots (Figure 3) shows the repeatability of peak radial (A) and longitudinal velocities (B) and inter-user variability of peak radial (C) and longitudinal velocities (D). No systematic bias was observed for the velocity measurements. Table 1 compares the global and regional systolic and diastolic peak radial and longitudinal velocities for the basal, mid-ventricular and apical slice locations obtained from the two scans. No significant differences were observed between the two scans globally and for all slice locations. Also no significant differences were observed for the peak radial and longitudinal velocities assessed by the two users.Conclusion
In conclusion, myocardial TPM can be performed with good repeatability and little user variability in mice to reliably quantify both global and regional myocardial velocities.Acknowledgements
No acknowledgement found.References
No reference found.Figures

Example magnitude (A-B) and phase difference (C-D) images obtained at
end-diastole (ED) (A,C) and end-systole (ES) (B,D) using the tissue phase
mapping method in a mid-ventricular slice location in mice.
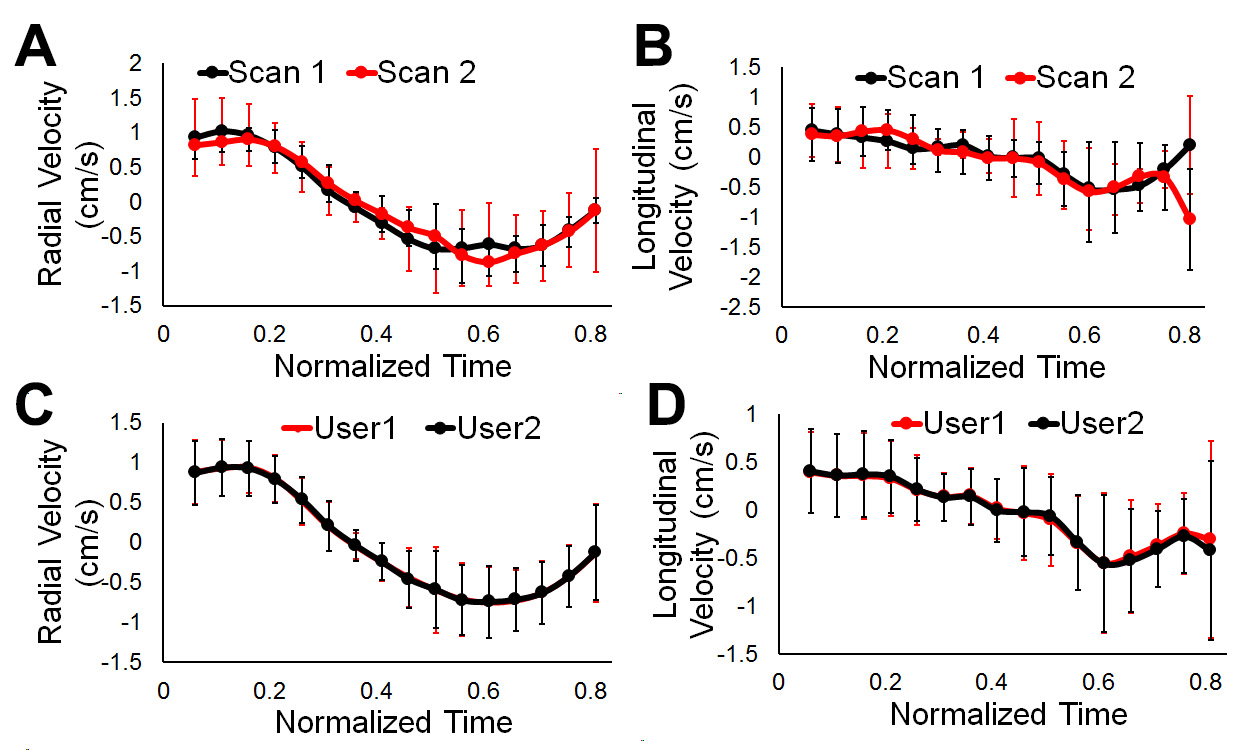
Mean radial (A) and longitudinal (B) velocity-time curves for scan 1 and
scan 2. The velocity-time curves represent the temporal evolution of mean radial
velocities for all n=6 mice in a mid-ventricular slice location. The standard
deviations reflect inter-subject differences in mid-ventricular radial
velocities. Mean radial (C) and longitudinal (D) velocity-time curves for user
1 and user 2 for all n=6 mice and both the scans in a mid-ventricular slice
location.
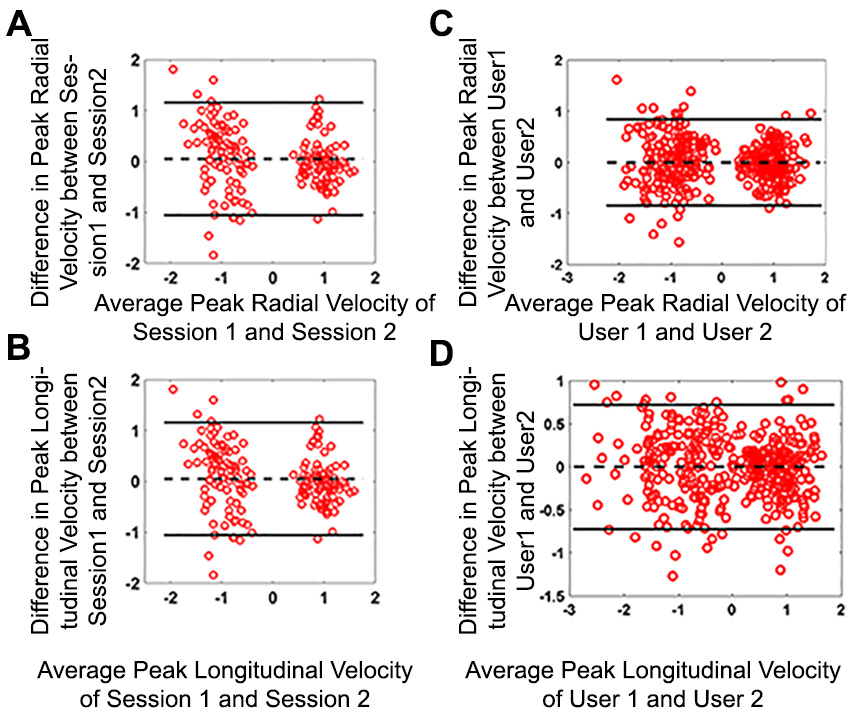
Bland-Altman analysis of repeatability and inter-user variability for
peak radial and longitudinal velocities. For repeatability analysis, each
Bland-Altman analysis included all 6 subjects and data from all 16 segments for
one user were included. For inter-user variability, each Bland-Altman analysis
included data from all 16 segments for both sessions for both users.