4871
Assessment of Renal Fibrosis in Murine Diabetic Nephropathy Using Quantitative Magnetization Transfer MRI1Institute of Imaging Science, Vanderbilt University, Nashville, TN, United States, 2Radiology and Radiological Sciences, Vanderbilt University, Nashville, TN, United States, 3Division of Nephrology and Hypertension, Vanderbilt University, Nashville, TN, United States
Synopsis
Current clinical tests are insufficient for non-invasively assessing renal fibrosis. Here we evaluated the utility of high-resolution quantitative magnetization transfer (qMT) MRI to detect renal fibrosis using a murine model of progressive DN and compared the results with histological analyses. Our results show that high-resolution qMT could provide an index to reveal renal cortical fibrosis.
Purpose
Renal fibrosis is a hallmark of progressive renal disease including diabetic nephropathy (DN), but current clinical tests are insufficient for non-invasively assessing renal fibrosis. Here we evaluated the potential of high-resolution quantitative magnetization transfer (qMT) MRI for detecting and grading renal fibrosis using a murine model of progressive DN and compared the results to histological analysis.Methods
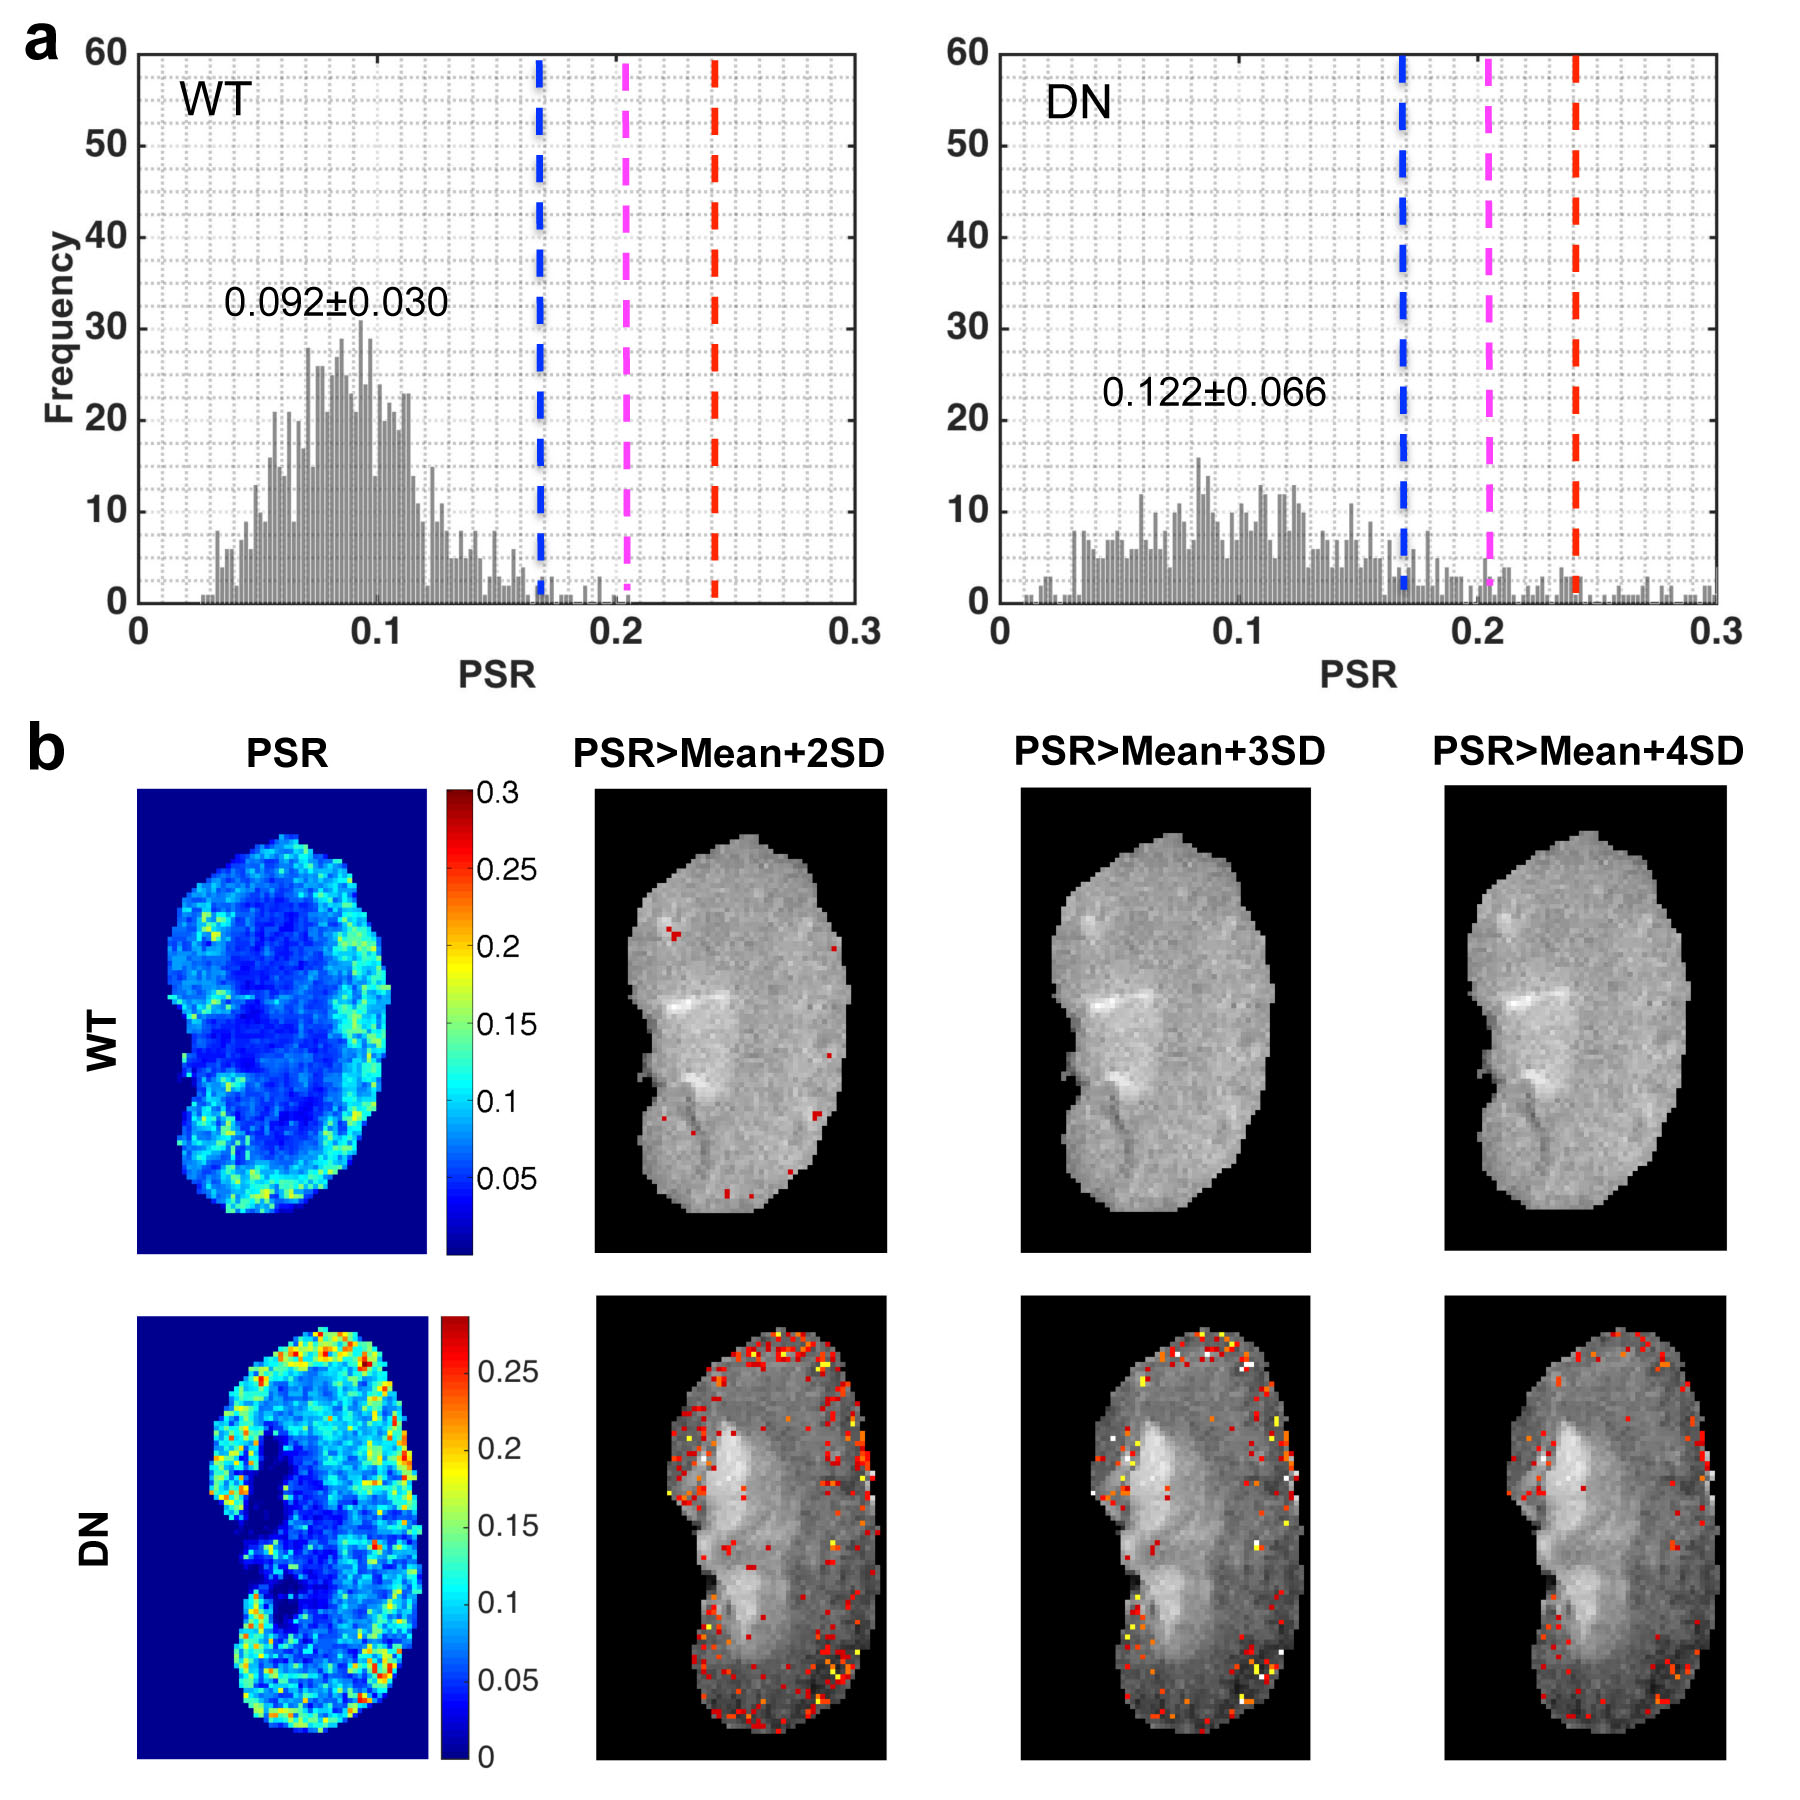
Normal wild type (WT) mice and eNOS deficient diabetic mice that show progressive nephropathy were imaged at 7T. All procedures were approved by the Institutional Animal Care and Use Committee of Vanderbilt University. A Doty 38-mm inner diameter transceiver coil was used due to the large size of the diabetic mice. Anesthesia was induced and maintained with a 1.5%/98.5% isoflurane/oxygen mixture, and a constant body temperature of 37.5 ºC was maintained using heated air flow. QMT data were collected for a coronal slice using a 2D MT-weighted spoiled gradient recalled-echo sequence (TR 24 ms, flip angle = 7°, resolution = ~0.133x0.133x1 mm3, 24 acquisitions). Gaussian-shaped saturation pulses (θsat = 220° and 820°, pulse width = 10 ms) were used with 7 different RF offsets spaced at a constant logarithmic interval between 1 and 80 kHz. All MRI data were analyzed using MATLAB. The model of Ramani et al. was applied to derive qMT parameters.1, 2 A normal pool size ratio (PSR) range was defined as Mean ± 2SD (standard deviation, 95%) of the normal WT mice, and regions with significantly higher PSR were identified in the DN kidneys. Cortical regions with PSR values above a given threshold were detected and the fibrosis level was evaluated using
$$tPSR = \frac{Area(PSR>threshold)}{Total Area}\times100$$
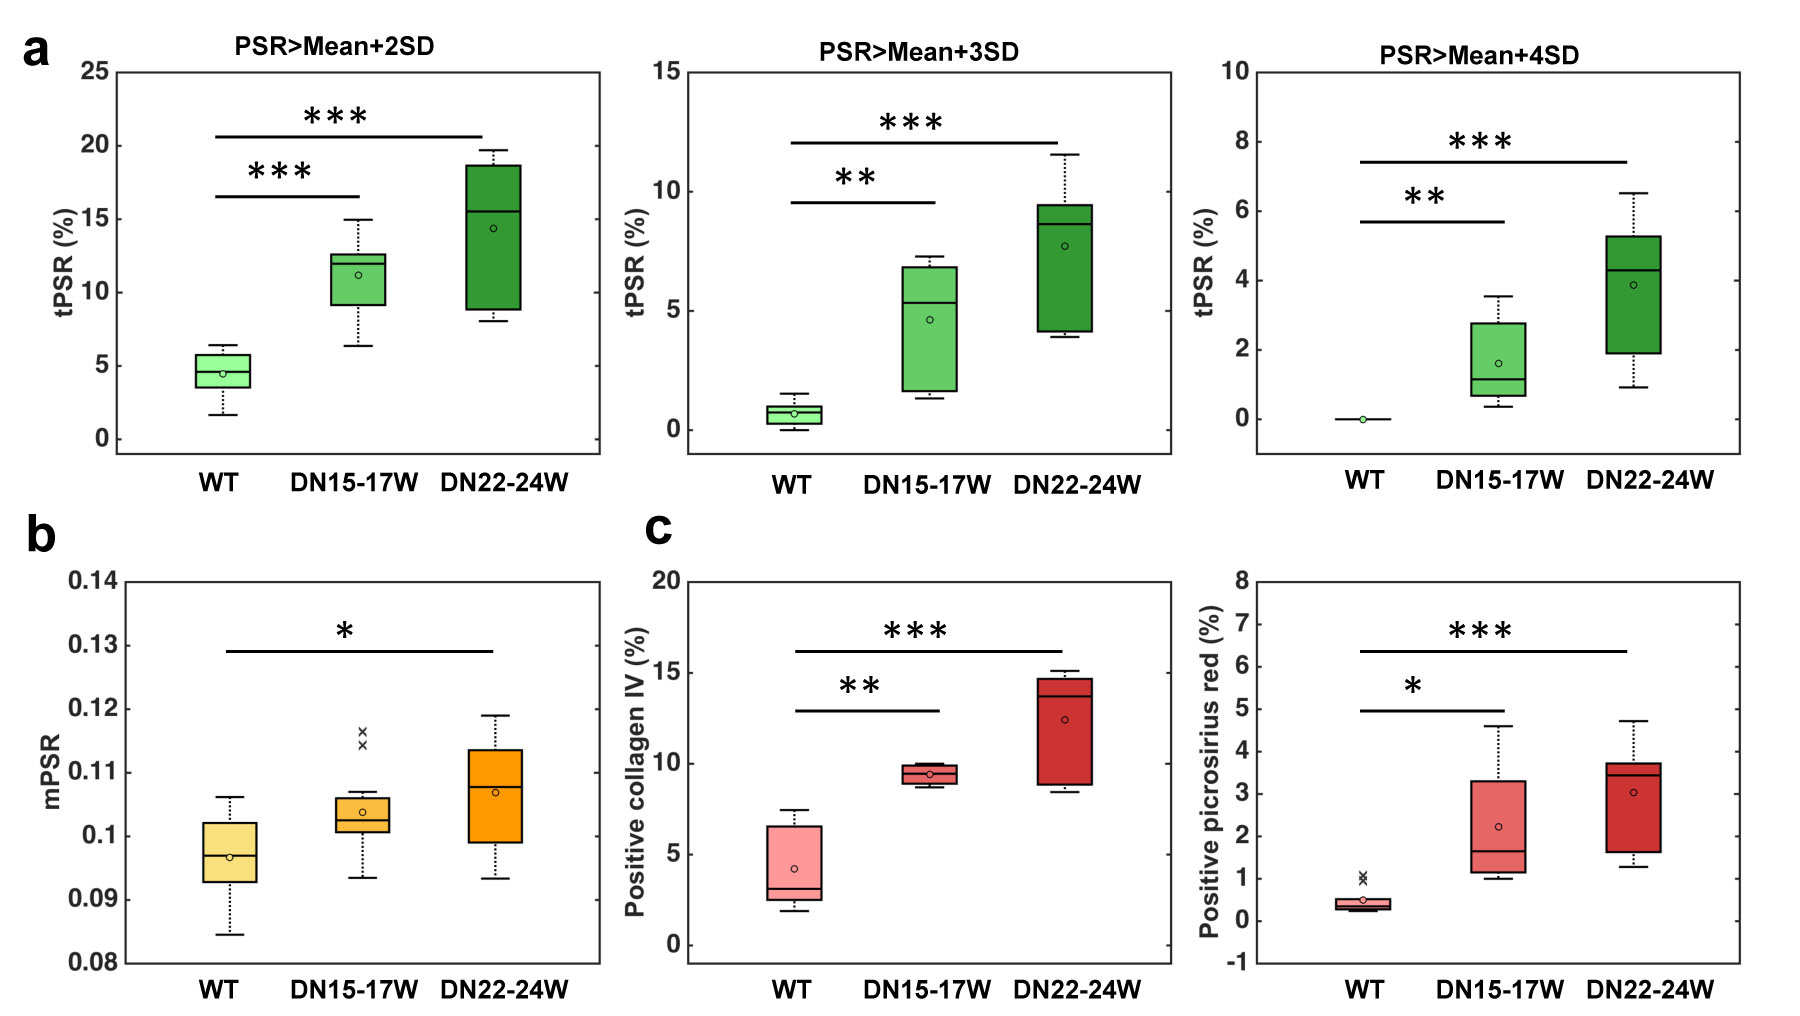
Histological fibrosis indices were obtained from collagen IV and picrosirius red stains following euthanasia. The regional fibrosis index was estimated by the area percentage of the positive pixels. The correlations between cortical tPSR and histological fibrosis indices were calculated across kidneys, using the Pearson correlation function. The significance of measurement differences was evaluated using Student’s t-tests.
Results
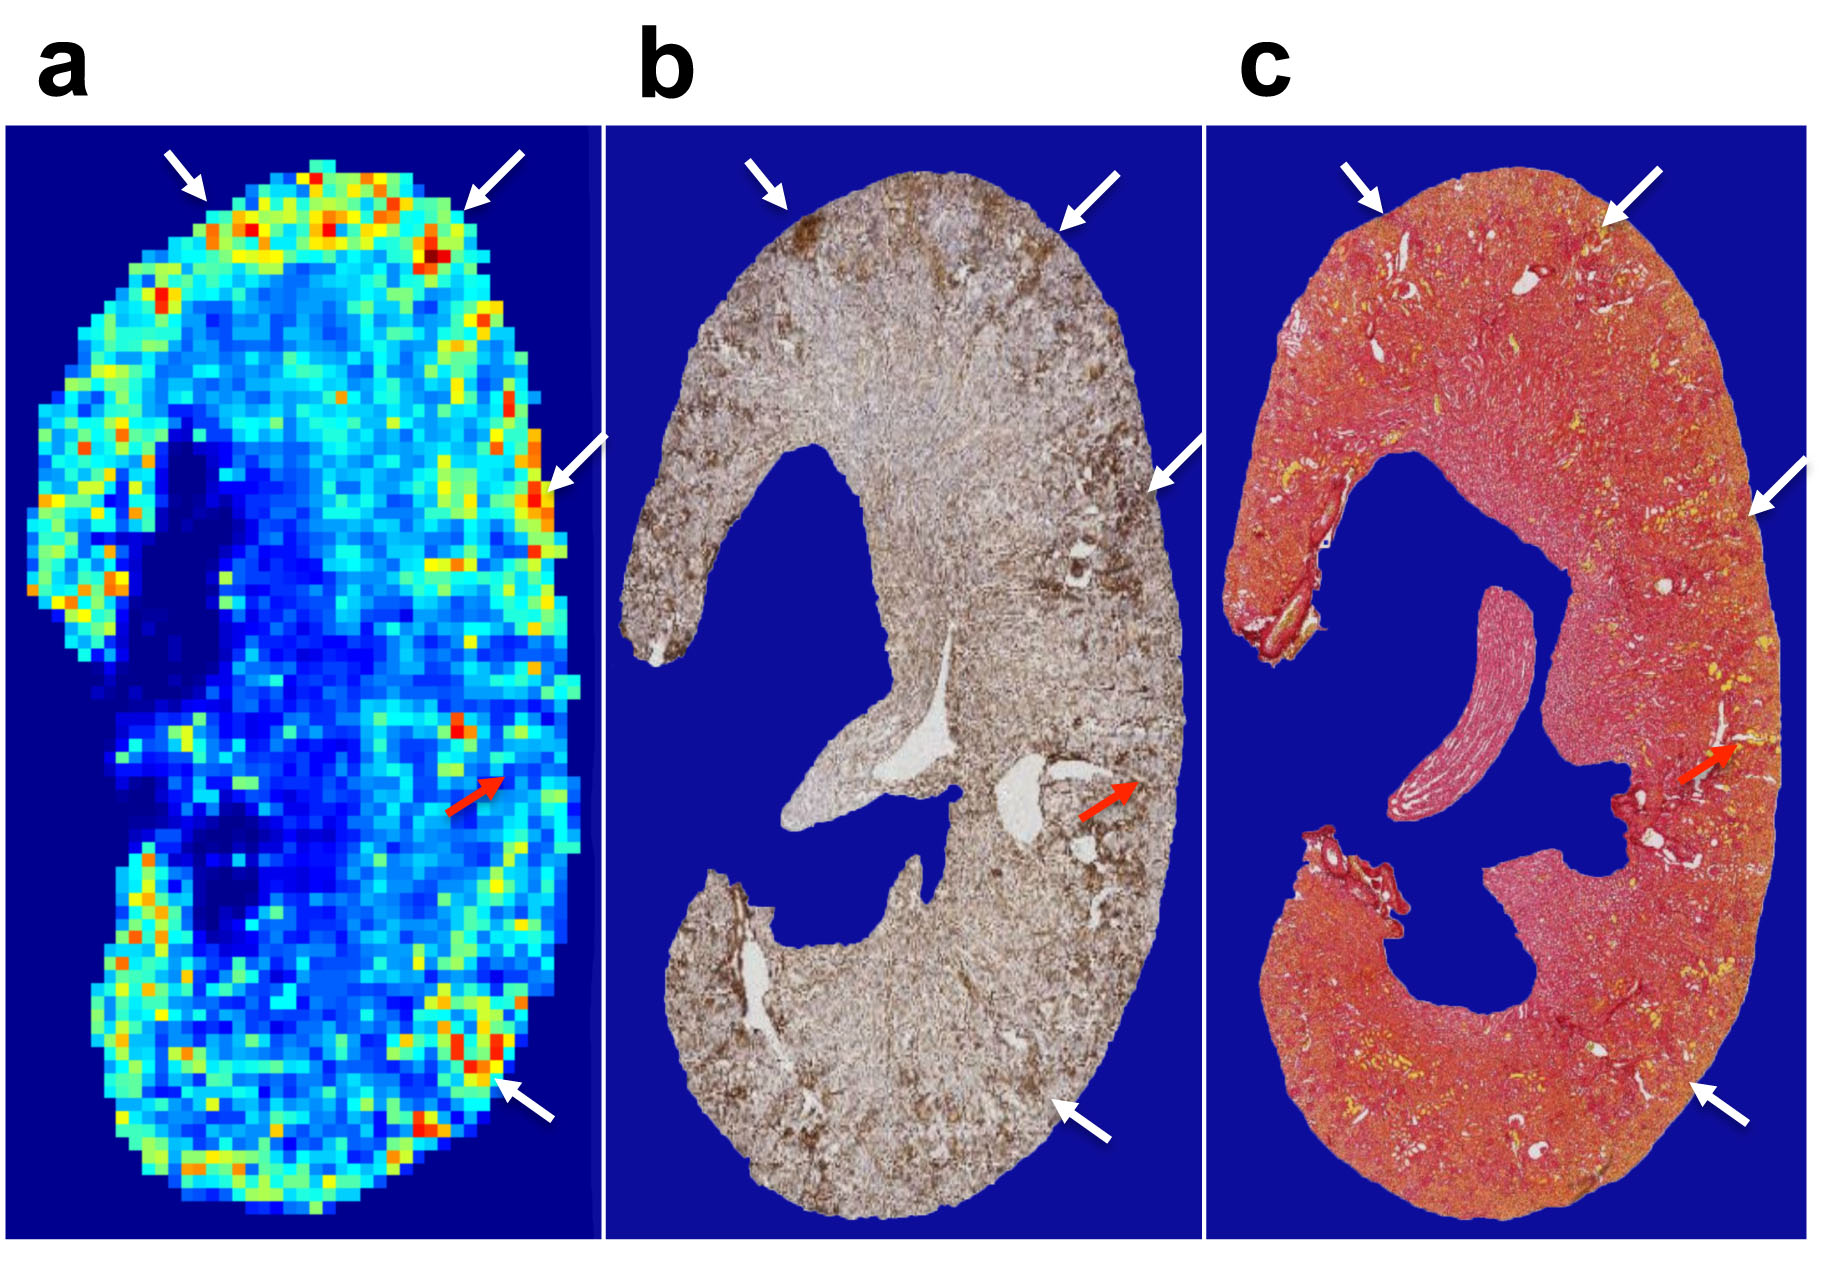
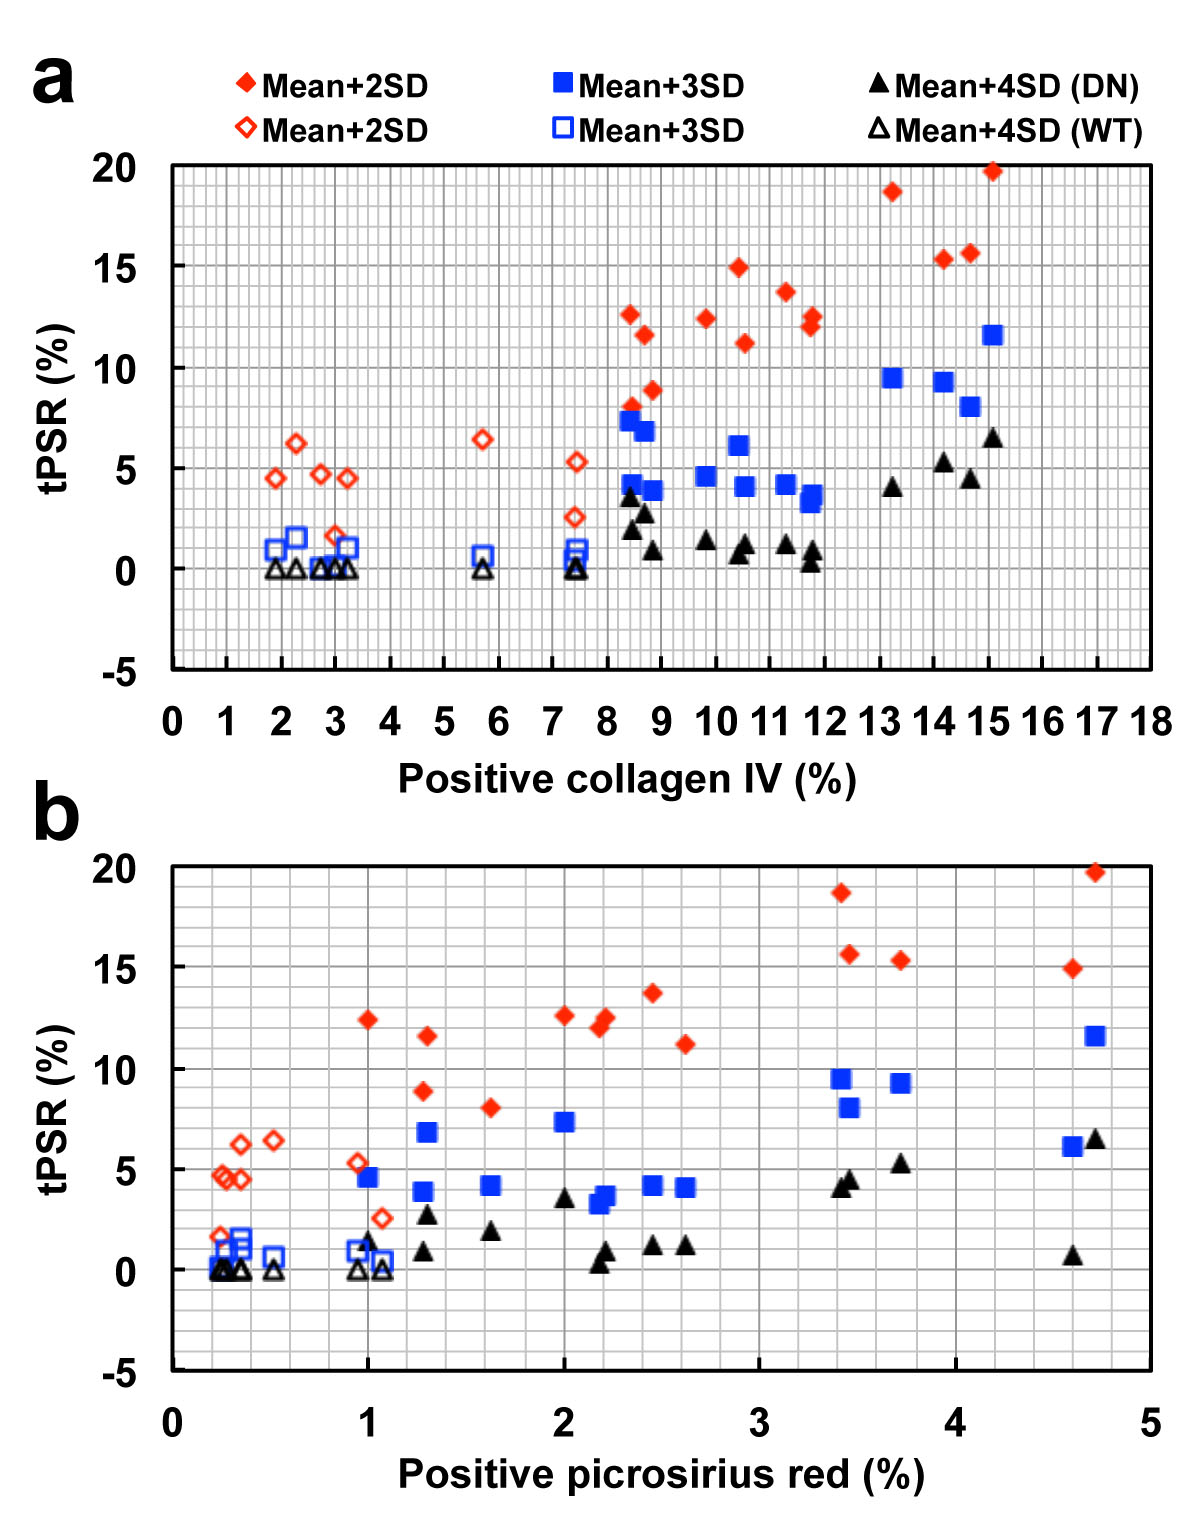
In eNOS-deficient DN mice, PSR maps reveal pathologic related changes (Fig. 1). The extra-renal spaces were hyperintense and were clearly detected in MTC images for DN mice. Very low PSR, low observed longitudinal relaxation rate R1obs, and low transverse rate of free water pool R2a were observed for extra-renal spaces. Compared to PSR maps of normal WT mice (Fig. 1), PSR maps of DN kidneys identified local cortical clusters of very low or high PSR values, with scattered spatial distributions (Fig. 1a). The spatial territories of the fibrosis observed in the collagen IV and picrosirius red stains were in agreement with the regions with high PSR (Fig. 2). Both positive collagen IV and positive picrosirius red results showed significant increase of fibrosis scores from normal WT to DN (Fig. 3). While the sensitivity of the cortical mean PSR (mPSR) is much lower than histologic indices (Fig. 3), the tPSR showed high sensitivity in detecting macromolecular accumulation. Significant changes in tPSR were observed from normal WT kidneys to DN kidneys at ages of both 15-17 weeks and 22-24 weeks. The cortical fibrosis levels estimated using tPSR showed significantly high correlations with the fibrosis indices from collagen IV and picrosirius red stains across kidneys (Fig. 4).Discussion
Our results show that tPSR had a high correlation with regional histologic fibrosis indices and is more sensitive to identifying changes than mPSR. In the cortex, increased tPSR could be due to renal fibrosis, while changes of mPSR across voxels could result from both fibrosis and urine retention. The presence of the high correlation between cortical tPSR and histologic fibrosis indices indicates that high tPSR is likely a consequence of the scattered renal fibrosis. Given the findings we obtained in this study, high-resolution tPSR could provide an index to reveal renal cortical fibrosis.Conclusion
The present study provides the first demonstration that high-resolution qMT MRI can provide a non-invasive measure for assessing scattered renal fibrosis during the progression of DN.Acknowledgements
We thank Mr. Fuxue Xin, Mr. Ken Wilkens, Dr. Daniel C. Colvin, Mr. Jarrod True, and Dr. Mark D. Does in the Center for Small Animal Imaging at Vanderbilt University Institute of Imaging Science for assistance. This work was supported by National Institutes of Health DK079341 center grant and DK020593 pilot program, and NIDDK Diabetic Complications Consortium DK076169 pilot program.References
1. Ramani, A., et al., Precise estimate of fundamental in-vivo MT parameters in human brain in clinically feasible times. Magn Reson Imaging, 2002. 20(10): 721-31.
2. Wang, F., et al., Longitudinal assessment of spinal cord injuries in nonhuman primates with quantitative magnetization transfer. Magn Reson Med, 2016. 75(4): 1685-96.
Figures