4868
Fatty acid composition with metabolic changes of livers from high fat diet-fed mice using in vivo and in vitro proton magnetic resonance spectroscopy1Department of Biomedical Engineering, and Research Institute of Biomedical Engineering, The Catholic University of Korea College of Medicine, Seoul, Korea, Republic of
Synopsis
Our animal studies suggest that unsaturated fatty acids may be upregulated or downregulated in a chronic model of non-alcoholic fatty liver disease (NAFLD). Further assessment of the strengths of our analytical parameters, which is essential for research and clinical evaluation of disease, should account for signal decay and bias in sequence selection. This will provide an effective means to quantify lipid content and to characterize NAFLD.
Purpose
Localized point-resolved spectroscopy (PRESS) and a shorter echo time (TE) result in enhanced signal-to-noise ratio (SNR) of metabolite peaks and T2 relaxation times, as compared to stimulated echo acquisition mode (STEAM) with a long TE1, 2. However, using PRESS and STEAM in liver fat tissue has resulted in contradictory quantification results. In addition, relaxation of the lipid molecule for quantification is quite complex and challenging to analyze. The relaxation behavior of lipid resonances may lead to errors in signal quantification. In studies calculating T2 relaxation time using PRESS and STEAM, the effects of J-coupling in lipid resonances have been described. T2 relaxation may create errors in quantitative analysis of lipid composition. The aim of this study was to quantify the difference in hepatic lipid content with metabolic changes, and determine the impact of diet on hepatic lipid content in high fat diet (HFD)-fed mice by single-voxel proton magnetic resonance (MR) spectroscopy at 9.4 T.Materials and Methods
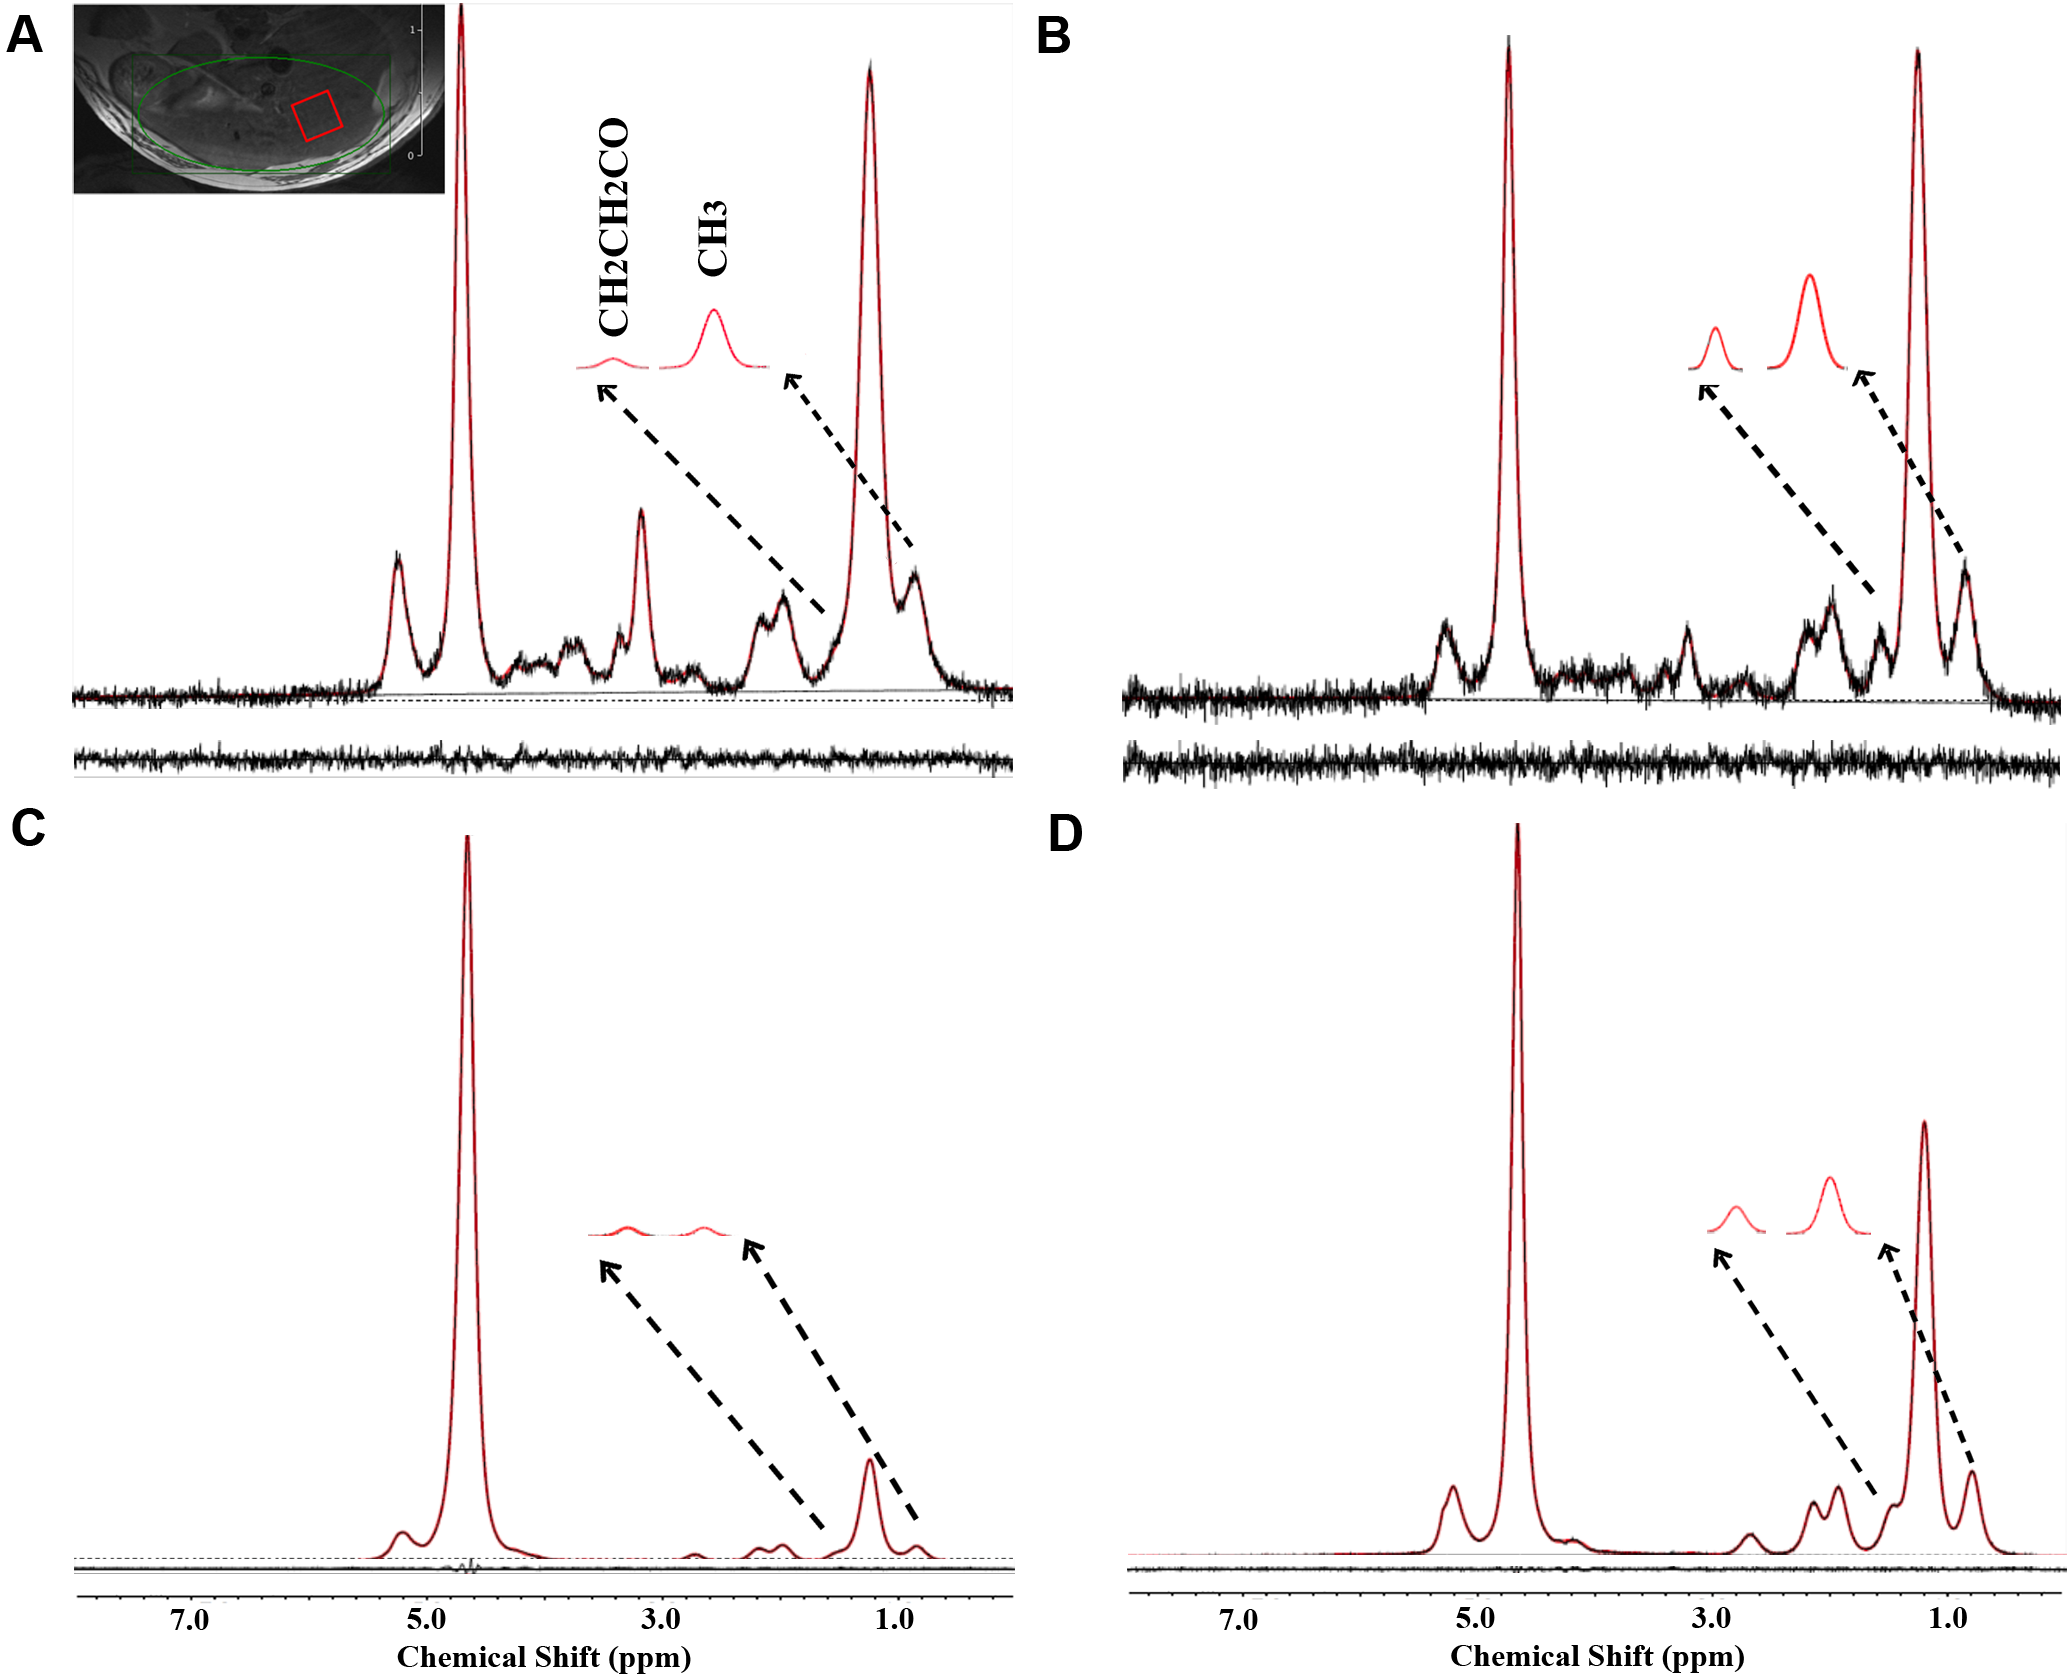
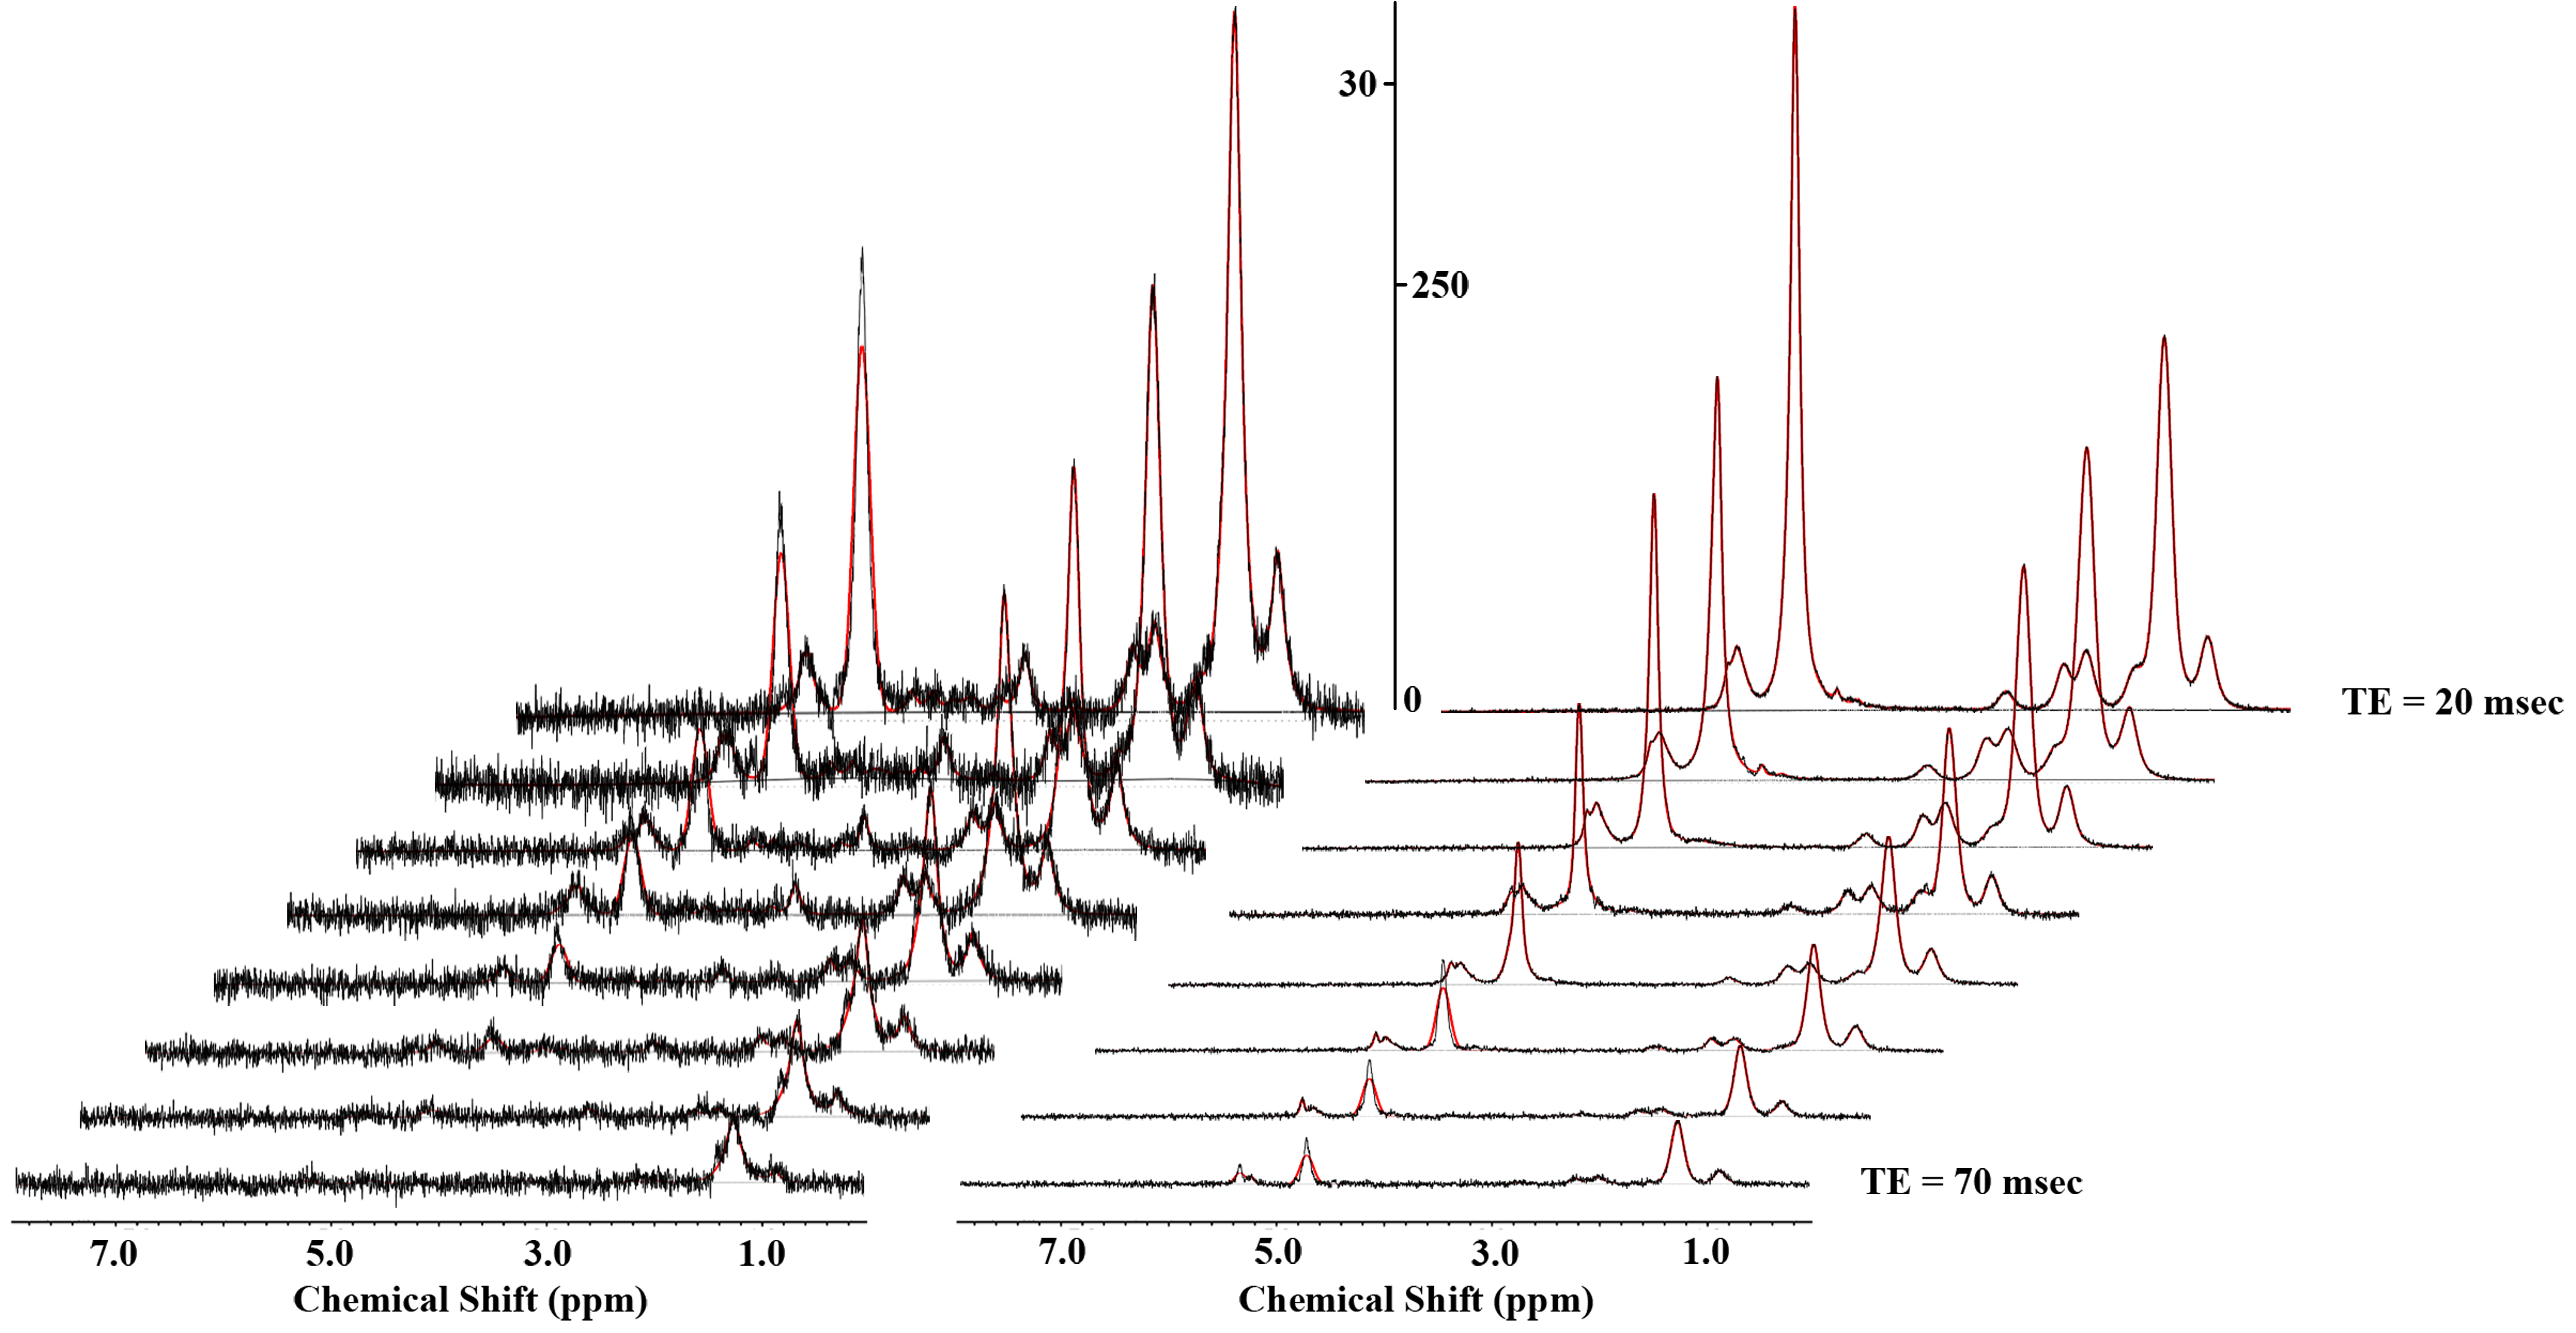
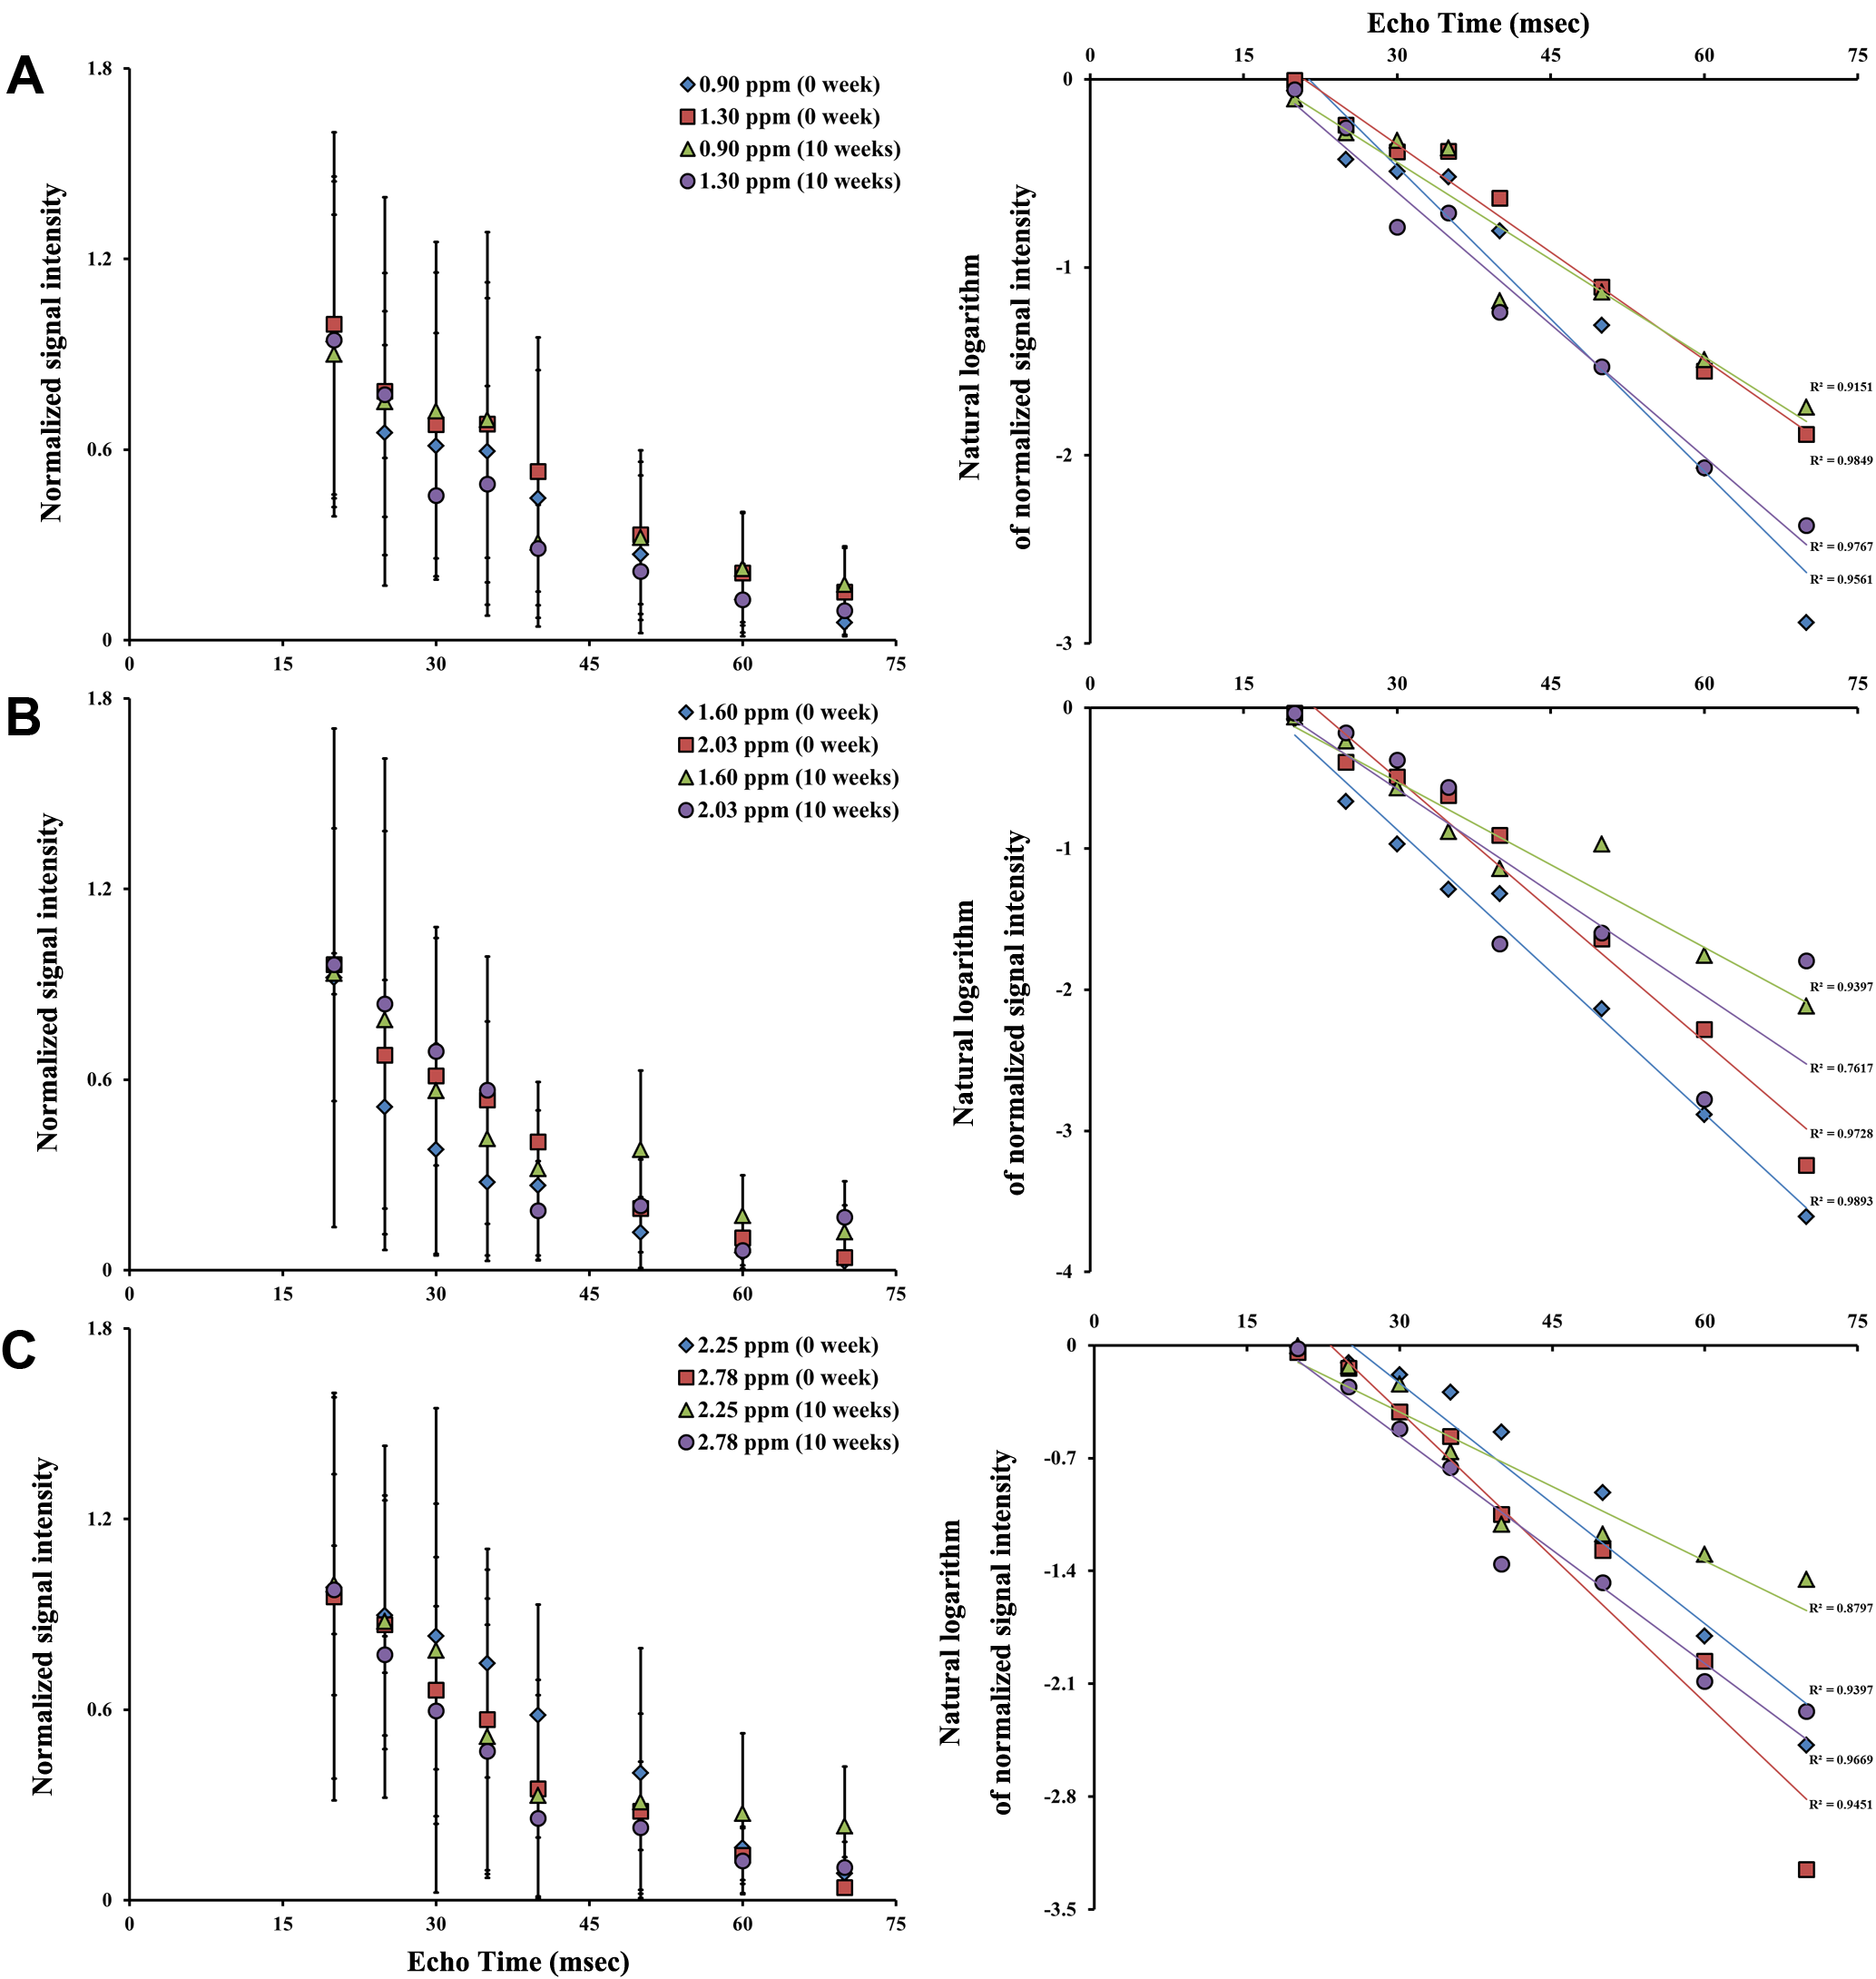
Vegetable oils were used as a phantom for human tissue and served as a quantification reference for lipid content analysis in fatty liver3. We used ten male C57BL/6 mice weighting 20-25 g that were housed in standard plastic cages with ad libitum access to water and we monitoring their weight. Fatty liver disease was induced in mice by a HFD based on pellets composed of 60% fat, 20% protein, and 20% carbohydrates. MR analyses were performed on a horizontal 9.4 Tesla MR animal scanner. The MR spectroscopy parameters with minimization of T1 and T2 relaxation effect were as follows: (1) standard PRESS sequence: repetition time [TR], 5000 ms; TE 20 ms; average, 128; acquisition data points, 2048; acquisition bandwidth, 4401.41 Hz; (2) standard STEAM sequence: TR, 5000 ms; mixing time [TM], 10 ms; TE, 20 ms; average, 128; acquisition data points, 2048; acquisition bandwidth, 4401.41 Hz; (3) multi-TEs STEAM sequence: TE, 20–70 ms. Before the MR spectroscopy scan, the water resonance signal in the volume of interest of HFD-fed mice liver was suppressed by variable pulse power and optimized relaxation delays4. All MR spectroscopic data were quantified using Linear Combination of Model spectra (LCModel, version 6.3.1-1K) software, which is useful for fitting data acquired by PRESS and STEAM sequences. The integrated areas under the peaks were evaluated from signal integrals of lipid methyl (CH3), methylene ((CH2)n), β-methylene resonance to carboxyl group (CH2CH2CO), allylic resonance (CH2CH=CHCH2CH2), α-methylene resonance to carboxyl group (CH2CH2CO), diallylic resonance (CH=CHCH2CH=CH), and olefinic resonance (CH=CH)5. Multi-TEs STEAM sequence data sets were evaluated with mono-exponential decay logarithm functions using the curve-fitting toolbox in the matrix laboratory (MATLAB) with the enhanced fitting equation (M(TE) = M0e(-TE/T2)[cos(πTEje)+b])1, 2. Data fitting quality was calculated as the coefficients of determination (R2) with standard least squares fitting and trust-region algorithm.Results
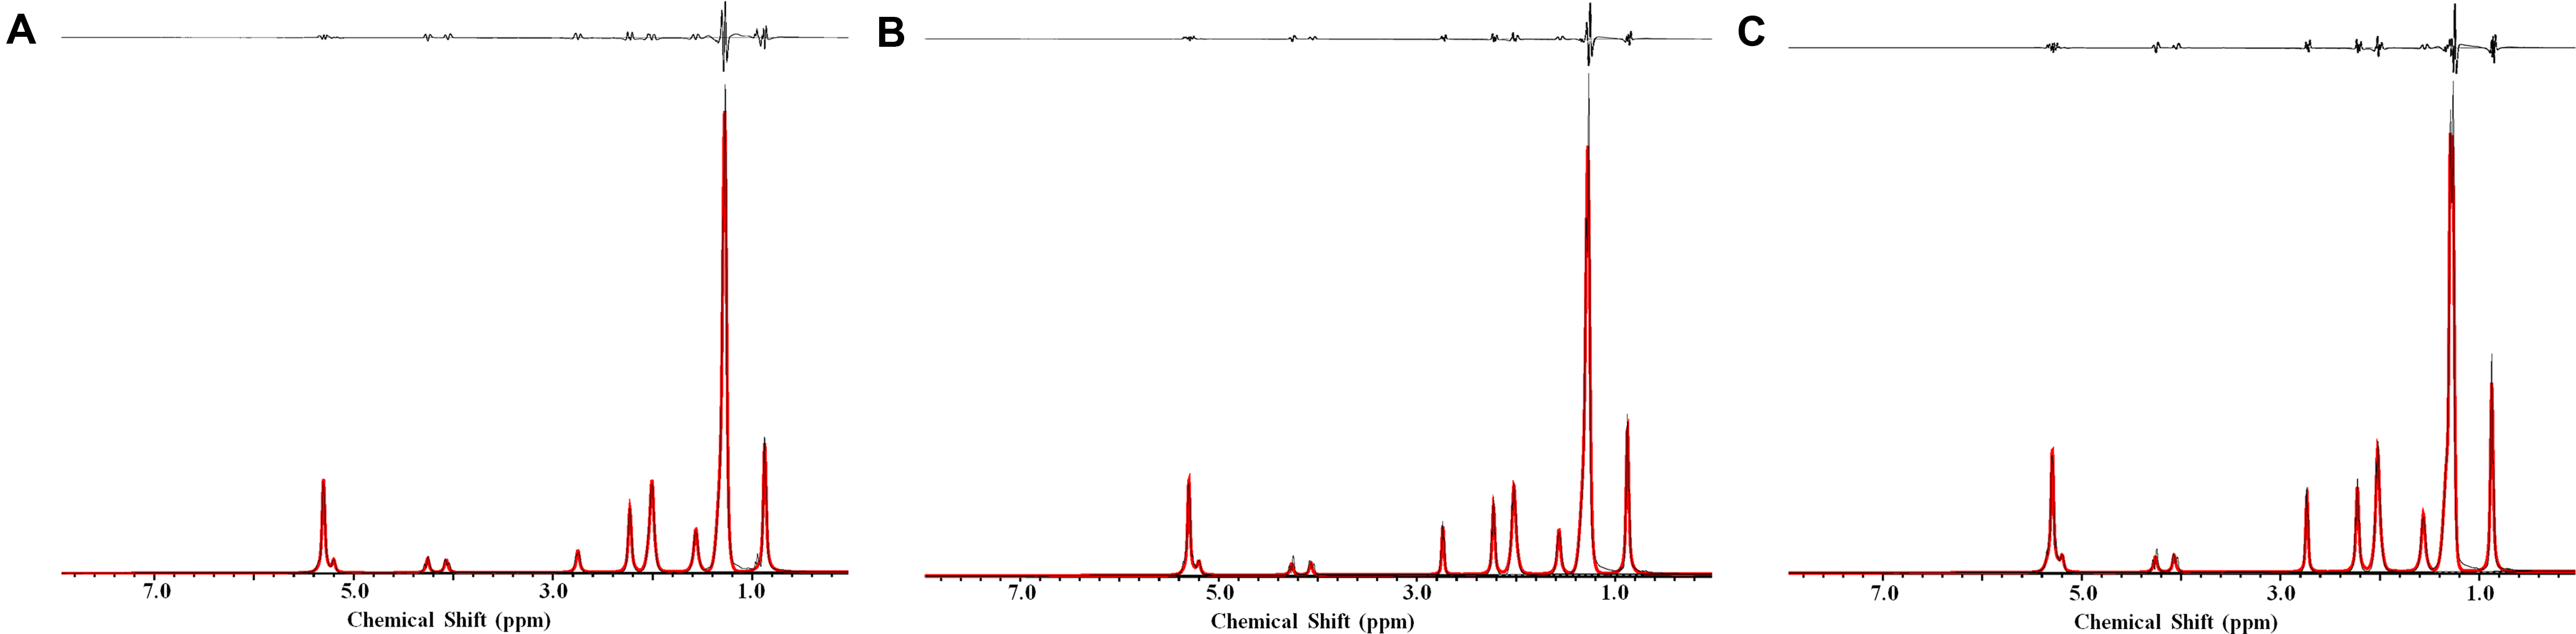
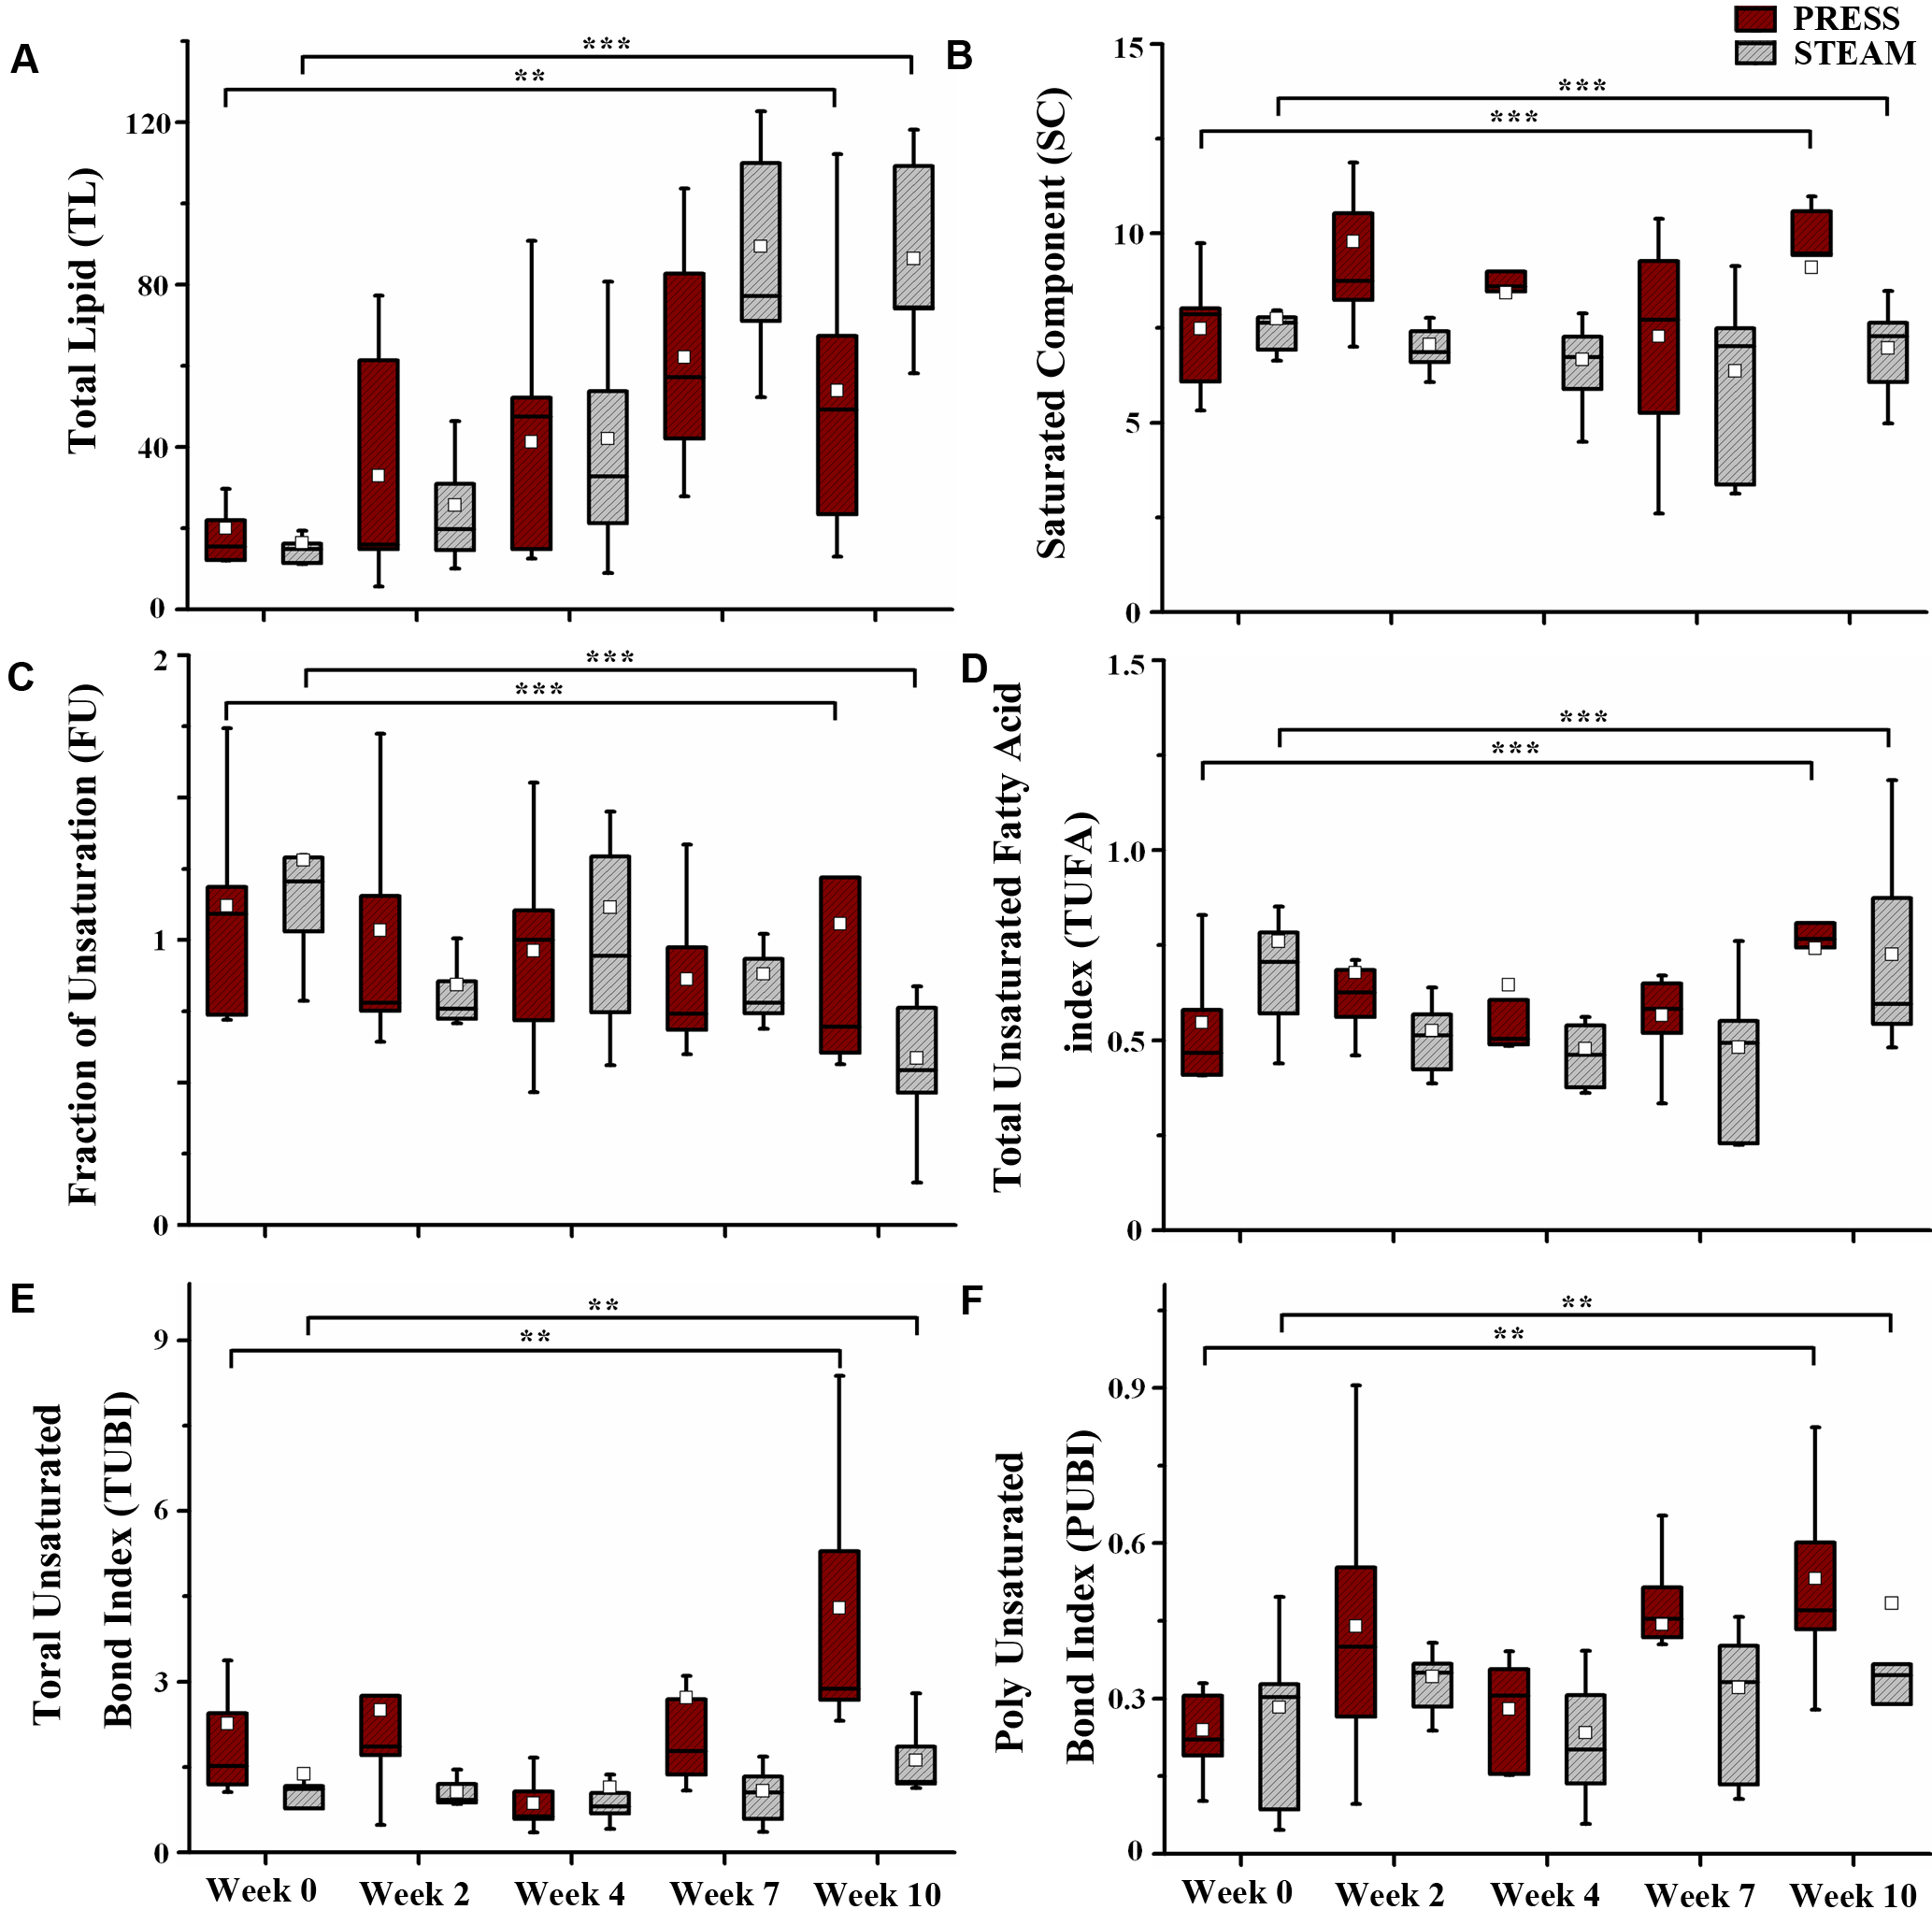
The experimental MR spectra of oil phantom are shown in Fig 1A-1C. The area in methyl and β-methylene resonance to carboxyl group was statistically significant at all time point (Fig 2A and B, p < 0.001; Fig 2C and D, p < 0.001). All spectra consistently depicted an increase or decrease in the concentration of various lipids-including total lipids, saturated fatty acids, and unsaturated fatty acids-in the comparison with PRESS and STEAM from 0 to 10 weeks (Fig 3). The acquired spectra reveal the amplitude variations of the lipid resonance in response to different multi-TEs (20–70 msec) in liver tissue (Fig 4 and 5). Compared to mice fed with a HFD after 10 weeks, mice at week 0 had significantly higher relaxation time of methyl protons (0.90 ppm, p < 0.001; 1.60 ppm, p < 0.01), and significantly lower extrapolated M0 values. Between week 0 (baseline) and week 10, results of M0 and T2 relaxation time were as follows: methylene protons, p < 0.001; allylic protons, p < 0.05; α-methylene resonance to carboxyl group, p < 0.01; diallylic protons, p < 0.05.Discussion and conclusion
We suggest that fast multi-TEs measurement of the relaxation rate is an appropriate method for lipid content quantification. Using PRESS and STEAM sequences with ultra-high field scanner, strong exponential decays may occur. Further assessment of the strengths of analytical parameters, which is essential for research and clinical evaluation of disease, should account for signal decay and bias in sequence selection. In addition, we analyzed the lipid content of liver in HFD-fed mice, and evaluated the lipid quantification according to a sufficient spectral resolution and a sufficiently high SNR. Selection of an appropriate sequence and parameter setting will provide an effective means to quantify the lipid content and to characterize non-alcoholic fatty liver disease.Acknowledgements
This study was supported by grants (2012-007883) from the Mid-career Researcher Program through the National Research Foundation (NRF) funded by the Ministry of Science, ICT & Future Planning (MSIP) of Korea. And, this research was supported by a grant of the Korea Health Technology R&D Project through the Korea Health Industry Development Institute (KHIDI), funded by the Ministry of Health & Welfare, Republic of Korea (grant number: HI14C1135).References
1. Yahya A, Fallone BG. T2 determination of the J-coupled methyl protons of lipids: In vivo ilustration with tibial bone marrow at 3 T. J. Magn. Reson. Imaging. 2010;31(6):1514-1521.
2. Yahya A, Tessier AG, Fallone BG. Effect of J-coupling on lipid composition determination with localized proton magnetic resonance spectroscopy at 9.4 T. J. Magn. Reson. Imaging. 2011;34(6):1388-1396.
3. Yuan Y, Wyatt C, Maccarini P, et al. A heterogeneous human tissue mimicking phantom for RF heating and MRI thermal monitoring verification. Phys. Med. Biol. 2012;57(7):2021.
4. Tkác I, Starcuk Z, Choi IY, et al. In vivo 1H NMR spectroscopy of rat brain at 1 ms echo time. Magn. Reson. Med. 1999;41:649-656.
5. Corbin IR, Furth EE, Pickup S, et al. In vivo assessment of hepatic triglycerides in murine non-alcoholic fatty liver disease using magnetic resonance spectroscopy. Biochim. Biophys. Acta Mol. Cell Biol. Lipids 2009;1791(8):757-763.
Figures