4867
Ferumoxytol-Enhanced Quantitative Susceptibility Mapping of the Rhesus Placenta1Biomedical Engineering, University of Wisconsin-Madison, Madison, WI, United States, 2Radiology, University of Wisconsin-Madison, Madison, WI, United States, 3Comparative Biosciences, University of Wisconsin-Madison, Madison, WI, United States, 4Medical Physics, University of Wisconsin-Madison, Madison, WI, United States, 5Obstetrics and Gynecology, University of Wisconsin-Madison, Madison, WI, United States, 6Wisconsin National Primate Research Center, University of Wisconsin-Madison, Madison, WI, United States, 7Medicine, University of Wisconsin-Madison, Madison, WI, United States, 8Emergency Medicine, University of Wisconsin-Madison, Madison, WI, United States
Synopsis
Ferumoxytol-enhanced MRI may enable the assessment of altered immune cell activation and distribution in placental inflammation. In this work, quantitative susceptibility mapping (QSM) is proposed to assess the temporal variation of ferumoxytol concentration in the placenta. Three healthy pregnant rhesus monkeys were imaged at six time points relative to ferumoxytol injection. Longitudinal quantification of placental magnetic susceptibility and R1/R2/R2* relaxometry were performed to provide a preliminary assessment of the ferumoxytol variation in healthy rhesus placenta. This study demonstrated the feasibility of ferumoxytol-enhanced QSM and relaxometry in the rhesus placenta and may provide a method for the evaluation of placental inflammation.
Introduction
Preeclampsia is an inflammatory condition of pregnancy that can lead to edema, hypertension, seizures and even death. In the pathologies of preeclampsia, altered immune cell (e.g. macrophage) activation and distribution within the placenta, the organ interfacing with the uterine wall and supporting the growth of the fetus, may play an important role1.
Ferumoxytol is an FDA-approved intravenous iron-based agent for treatment of anemia, and it is phagocytosed by macrophages. Importantly, it can be detected by using either relaxometry-based or susceptibility-based MRI techniques. Therefore, ferumoxytol-enhanced MRI may enable safe and sensitive detection of increased macrophage density in inflammation2.
The concentration of tissue ferumoxytol can be assessed using relaxometry-based mapping3 (e.g. R1/R2/R2* mapping), however, the relationship between the relaxation parameters and the ferumoxytol concentration is not well understood and may be affected by multiple confounding factors such as diffusion rate. Quantitative susceptibility mapping (QSM) may enable the assessment of ferumoxytol concentration based on tissue susceptibility. In this study, we evaluated the feasibility of QSM to assess the temporal variation of ferumoxytol in the healthy rhesus placenta. The longitudinal quantification of placental susceptibility and R1/R2/R2* relaxometry was reported and compared to provide a preliminary characterization of the ferumoxytol variation in the healthy rhesus placenta.
Methods
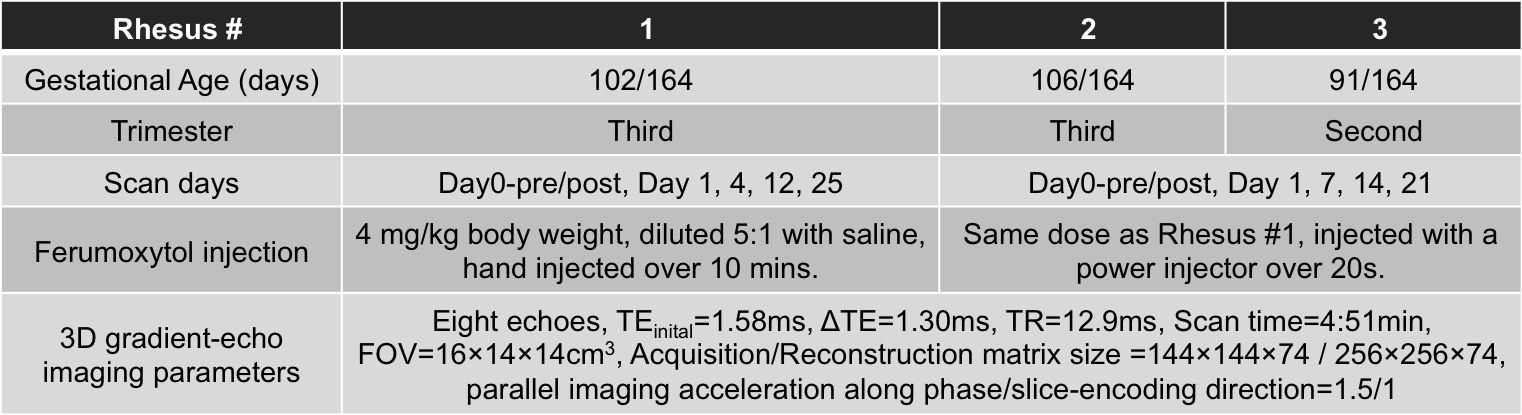
All procedures were approved by our institution’s animal care and use committee (IACUC). Three healthy pregnant rhesus monkeys were imaged on a clinical 3.0T MRI system (GE Healthcare Discovery MR 750, Waukesha, WI) using a 32-channel phased array torso coil (Neocoil, Pewaukee, WI). All mother rhesus monkeys were under general anesthesia during the scanning, which also anesthetized the fetus, thereby eliminating fetal motion. Data were collected before and after ferumoxytol injection and multiple days post injection to assess the temporal variation of ferumoxytol in the placenta. Details on the gestational age of the monkeys, the scan time points, and the ferumoxytol injection are shown in Table 1.
A multi-echo spoiled gradient-echo 3D acquisition including respiratory gating was performed for R2* mapping and QSM (see Table 1). R2* maps, as well as separated water and fat images and B0 field maps, were obtained by using a chemical shift-encoded reconstruction4. A QSM reconstruction algorithm proposed by Sharma et al5, was used to generate quantitative susceptibility maps. The placental tissue susceptibility was measured using the adjacent amniotic fluid as a susceptibility reference, assumed to be 0 ppm. Additionally, a single voxel multi-TE, multi-TR STEAM-MRS prescribed within the placenta was also included in MRI scan for R1 and R2 measurements (see parameters in Reference 6).
Results
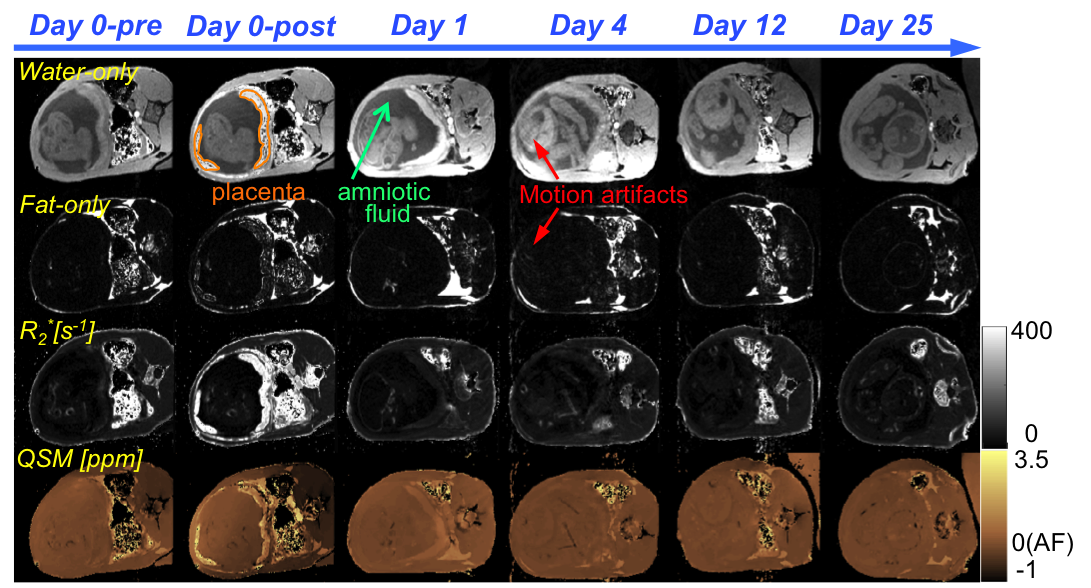
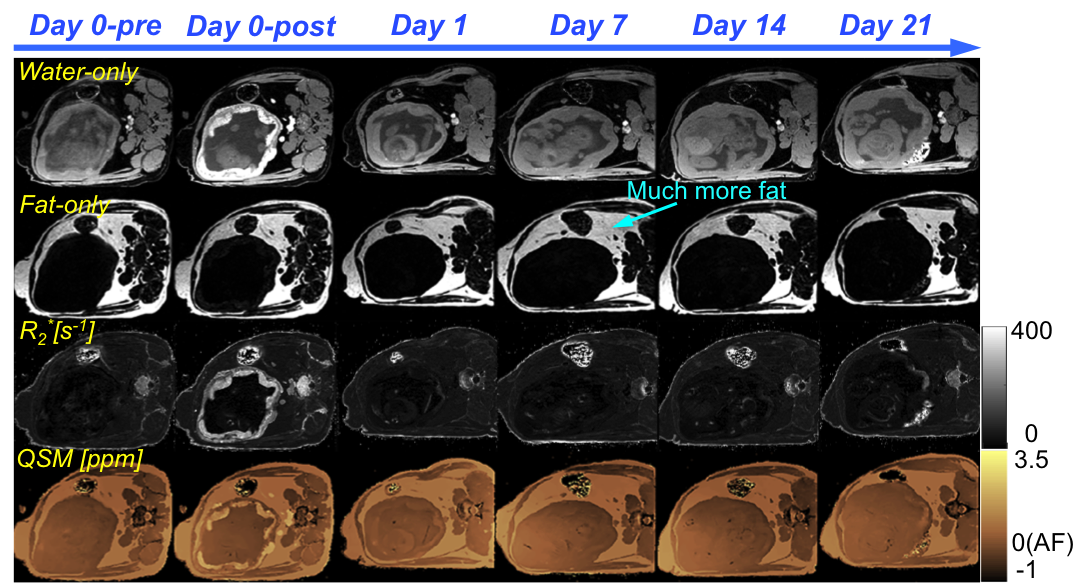
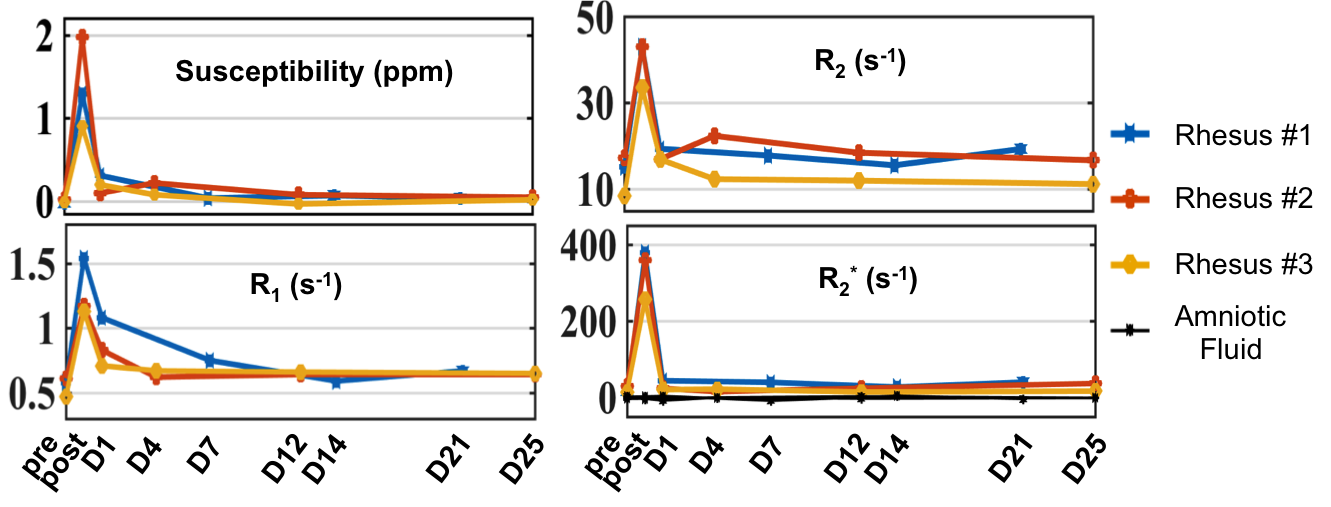
Water-only images, fat-only images, R2* maps, and susceptibility maps of Rhesus #1 and #3 at the six scan time points are shown in Figures 1 and 2, respectively. Motion artifacts, indicated with the red arrows at day 4 in Rhesus #1, were due to the respiratory gating failure. The time course of tissue susceptibility and R1/R2/R2* values of all three animals’ placentas are shown in Figure 3. The amniotic fluid was found to be a reliable reference tissue for the QSM measurement as no ferumoxytol uptake was observed there, indicated by the stable R2* measurements throughout the study (shown as black lines in Figure 3). At day 0-post, the increased susceptibility and R1/R2/R2* in the placenta, compared to the baseline values measured before injection, demonstrate the presence of ferumoxytol. At day 1, the susceptibility and R1 of the placenta both decreased but are still elevated relative to the baseline (i.e. day 0-pre) in Rhesus #1 and #3. However, R2 has already returned to the baseline in Rhesus #1 and #2, and R2* has returned to the baseline in all three animals.Discussions and Conclusions
We have demonstrated the feasibility of performing QSM to assess the temporal variation of ferumoxytol in the healthy rhesus placenta. The elevated magnetic susceptibility and R1/R2/R2* at day 0-post are thought to be due to the presence of ferumoxytol in the blood pool. Apparent discrepancies between the different measurements at day 1 are currently under investigation. The regularization used in the QSM reconstruction5 was effective but further optimization of the algorithm (e.g. regularization parameters) is needed for appropriate and robust QSM reconstruction in the placenta. Fetal movement was eliminated in the rhesus model due to the anesthesia. However, fetal motion may be a challenge for translation of this technique to humans (i.e. without anesthesia). Thus, additional technical developments and validation will be needed for future human studies. Upon further development and validation in both healthy and inflamed models, ferumoxytol-enhanced QSM may provide a promising approach for the evaluation of inflammation in the human placenta.Acknowledgements
The authors acknowledge the support of the NIH (grants U01-HD087216, R01-DK100651, K24-DK102595, and P51-OD011106). We also thank GE Healthcare for their support.References
1. Faas MM, et al. Monocytes and macrophages in pregnancy and pre-eclampsia. Front Immunol. 2014; 5:298.
2. Neuwelt A, et al. Iron-based superparamagnetic nanoparticle contrast agents for MRI of infection and inflammation. AJR. 2015; 204(3):W302.
3. Storey P, et al. MRI assessment of hepatic iron clearance rates after USPIO administration in healthy adults. Investigative radiology. 2012; 47(12):717-724.
4. Hernando D, et al. Quantification of liver iron with MRI: State of the art and remaining challenges. J Magn Reson Imaging. 2014; 40(5):1003-1021.
5. Sharma SD, et al. Quantitative susceptibility mapping in the abdomen as an imaging biomarker of hepatic iron overload. Magn Reson Med. 2015; 74(3):673-683.
6. Hamilton G, et al. In vivo breath-hold 1H MRS simultaneous estimation of liver proton density fat fraction, and T1 and T2 of water and fat, with a multi-TR, multi-TE sequence. J Magn Reson Imaging. 2016; 42(6):1538-43.
Figures