4866
Quantifying tidal volume and pulmonary fibrosis in a TGF-α transgenic mouse model with retrospective self-gating UTE MRI1Center for Pulmonary Imaging Research, Cincinnati Children's Hospital Medical Center, Cincinnati, OH, United States, 2Physics, Washington University in St. Louis, St. Louis, MO, United States, 3Division of Pulmonary Medicine, Cincinnati Children's Hospital Medical Center, Cincinnati, OH, United States
Synopsis
Pulmonary fibrosis has high morbidity and mortality, but remains poorly understood. Many experimental and clinical studies have implied or demonstrated the role for transforming growth factor (TGF)-α in the pathogenesis of pulmonary fibrosis. We demonstrate the utilization of retrospective self-gating UTE MRI with ellipsoidal k-space coverage to measure the burden of pulmonary fibrosis in a TGF-α transgenic mouse model, with the dynamic progression of fibrotic burden well quantified longitudinally by both high-density lung volume percentage and tidal volume.
Introduction
Pulmonary fibrosis remains a significant public health burden that contributes to morbidity and mortality in a number of lung diseases including cystic fibrosis, idiopathic pulmonary fibrosis, etc. The molecular pathways and cellular mechanisms leading to fibrosis still remain poorly understood and deserve thorough investigation in the absence of inflammation to identify new therapeutic targets. Several studies showed that conditional expression of transforming growth factor (TGF)-α in the respiratory epithelium of transgenic mice caused peribronchial, perivascular, and pleural fibrosis in the absence of inflammation.1-3 We utilized retrospective self-gating UTE MRI4 with ellipsoidal k-space coverage5 to longitudinally monitor in vivo the progression of pulmonary fibrosis in a transgenic mouse model which over-expresses TGF-α in the respiratory epithelium under control of doxycycline (Dox)-regulatable Clara cell secretory protein promoter.2Methods
Bitransgenic mice containing TGF-α transgene were generated as previously described2 and divided into two cohorts: one cohort (N = 6) fed by Dox food (Dox cohort) and the other cohort (N = 5) fed by normal food (Control cohort) for 8 weeks. Both cohorts were imaged at Baseline, 4 and 8 weeks of Dox treatment, and eventually sacrificed for histology. All imaging experiments were performed using retrospective self-gating UTE with ellipsoidal k-space coverage on a Bruker 7T scanner (Bruker, Billerica, MA) with a quadrature birdcage transmitter/receiver coil (inner diameter = 35 mm, length = 50 mm). Animals were anesthetized by 1.5-2% isoflurane and placed supine for free breathing with the lung in the center of RF coil. Imaging parameters included k-space expansion factors αx = αy = 2, αz = 1, number of points per projection = 64, number of projections = 154440, receiver bandwidth = 200 kHz, averages = 1, TR = 6 ms, TE = 0.108 ms, FA = 6.3°, and FOV = 30 mm × 30 mm × 60 mm. Approximately 30-40% and 4-8% of total data were registered for end-expiration and end-inspiration, respectively, for image reconstruction. Tidal volume (TV) was calculated by subtracting end-expiratory lung volume measured in MR images from end-inspiratory lung volume and analyzed by student t test. High-density lung volume percentage, the percent of lung volume with MR signal larger than 80% of the soft tissue signal, was analyzed by a linear mixed-effects model using R.6,7Results and Discussion
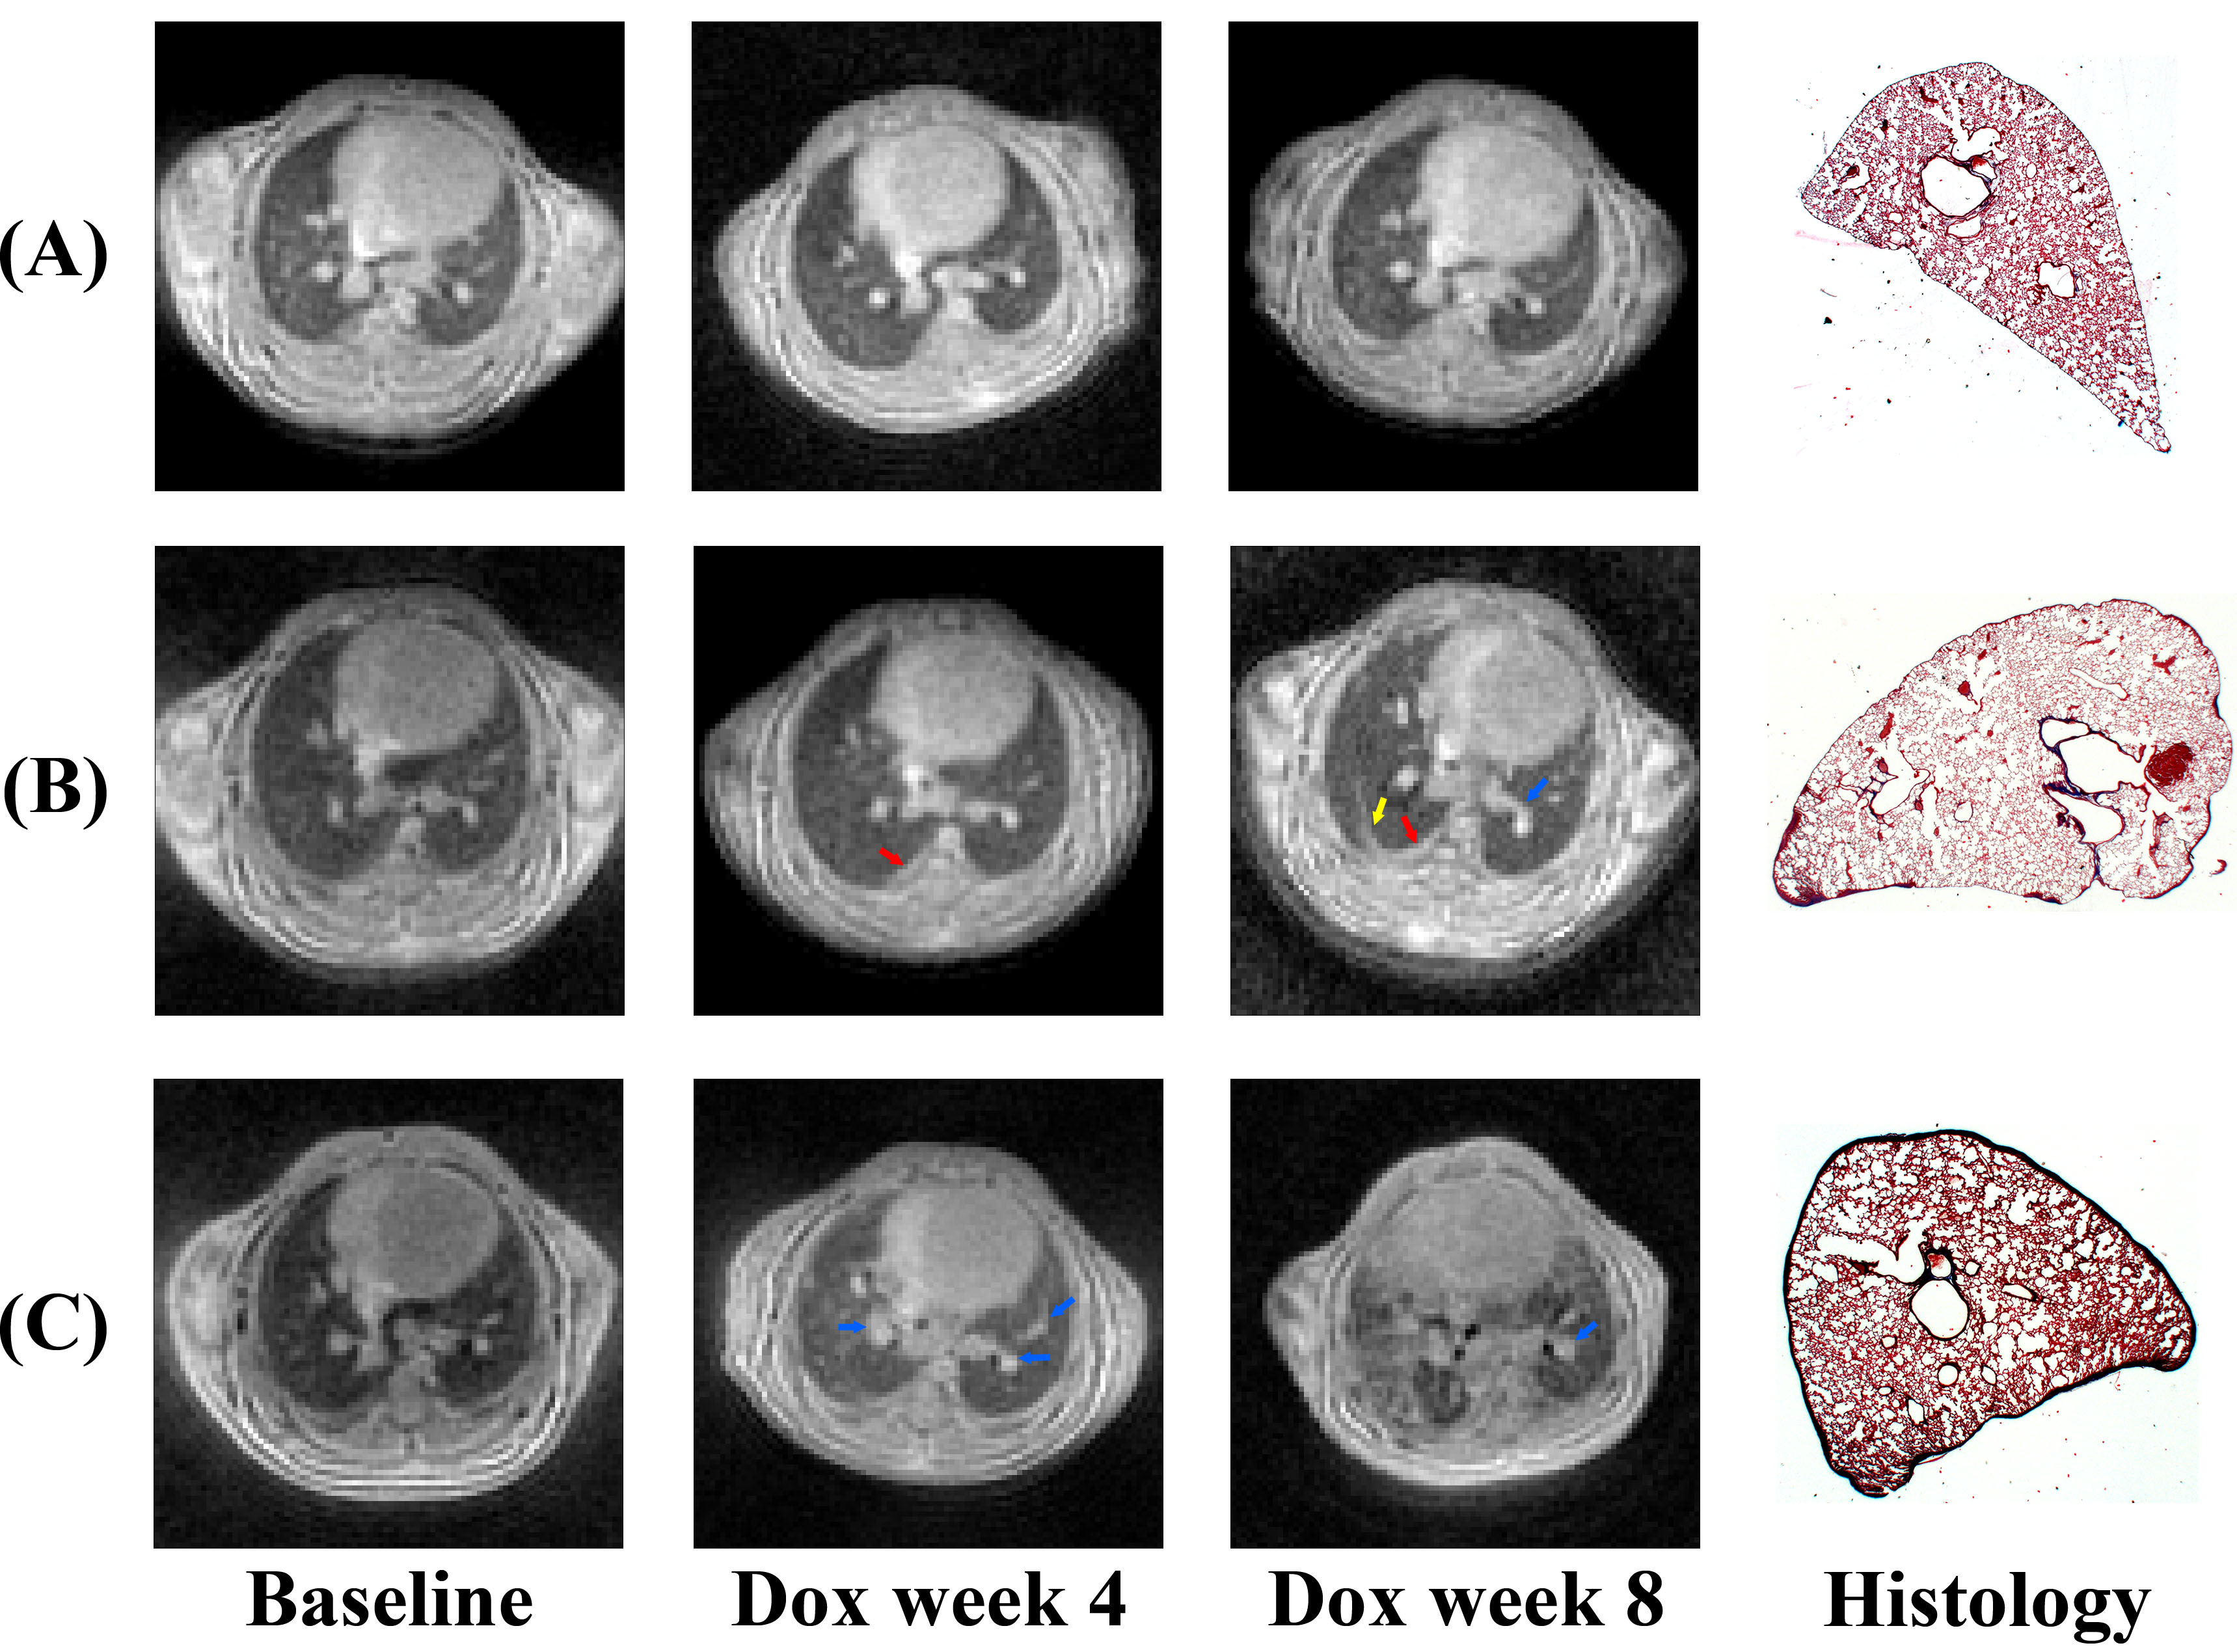
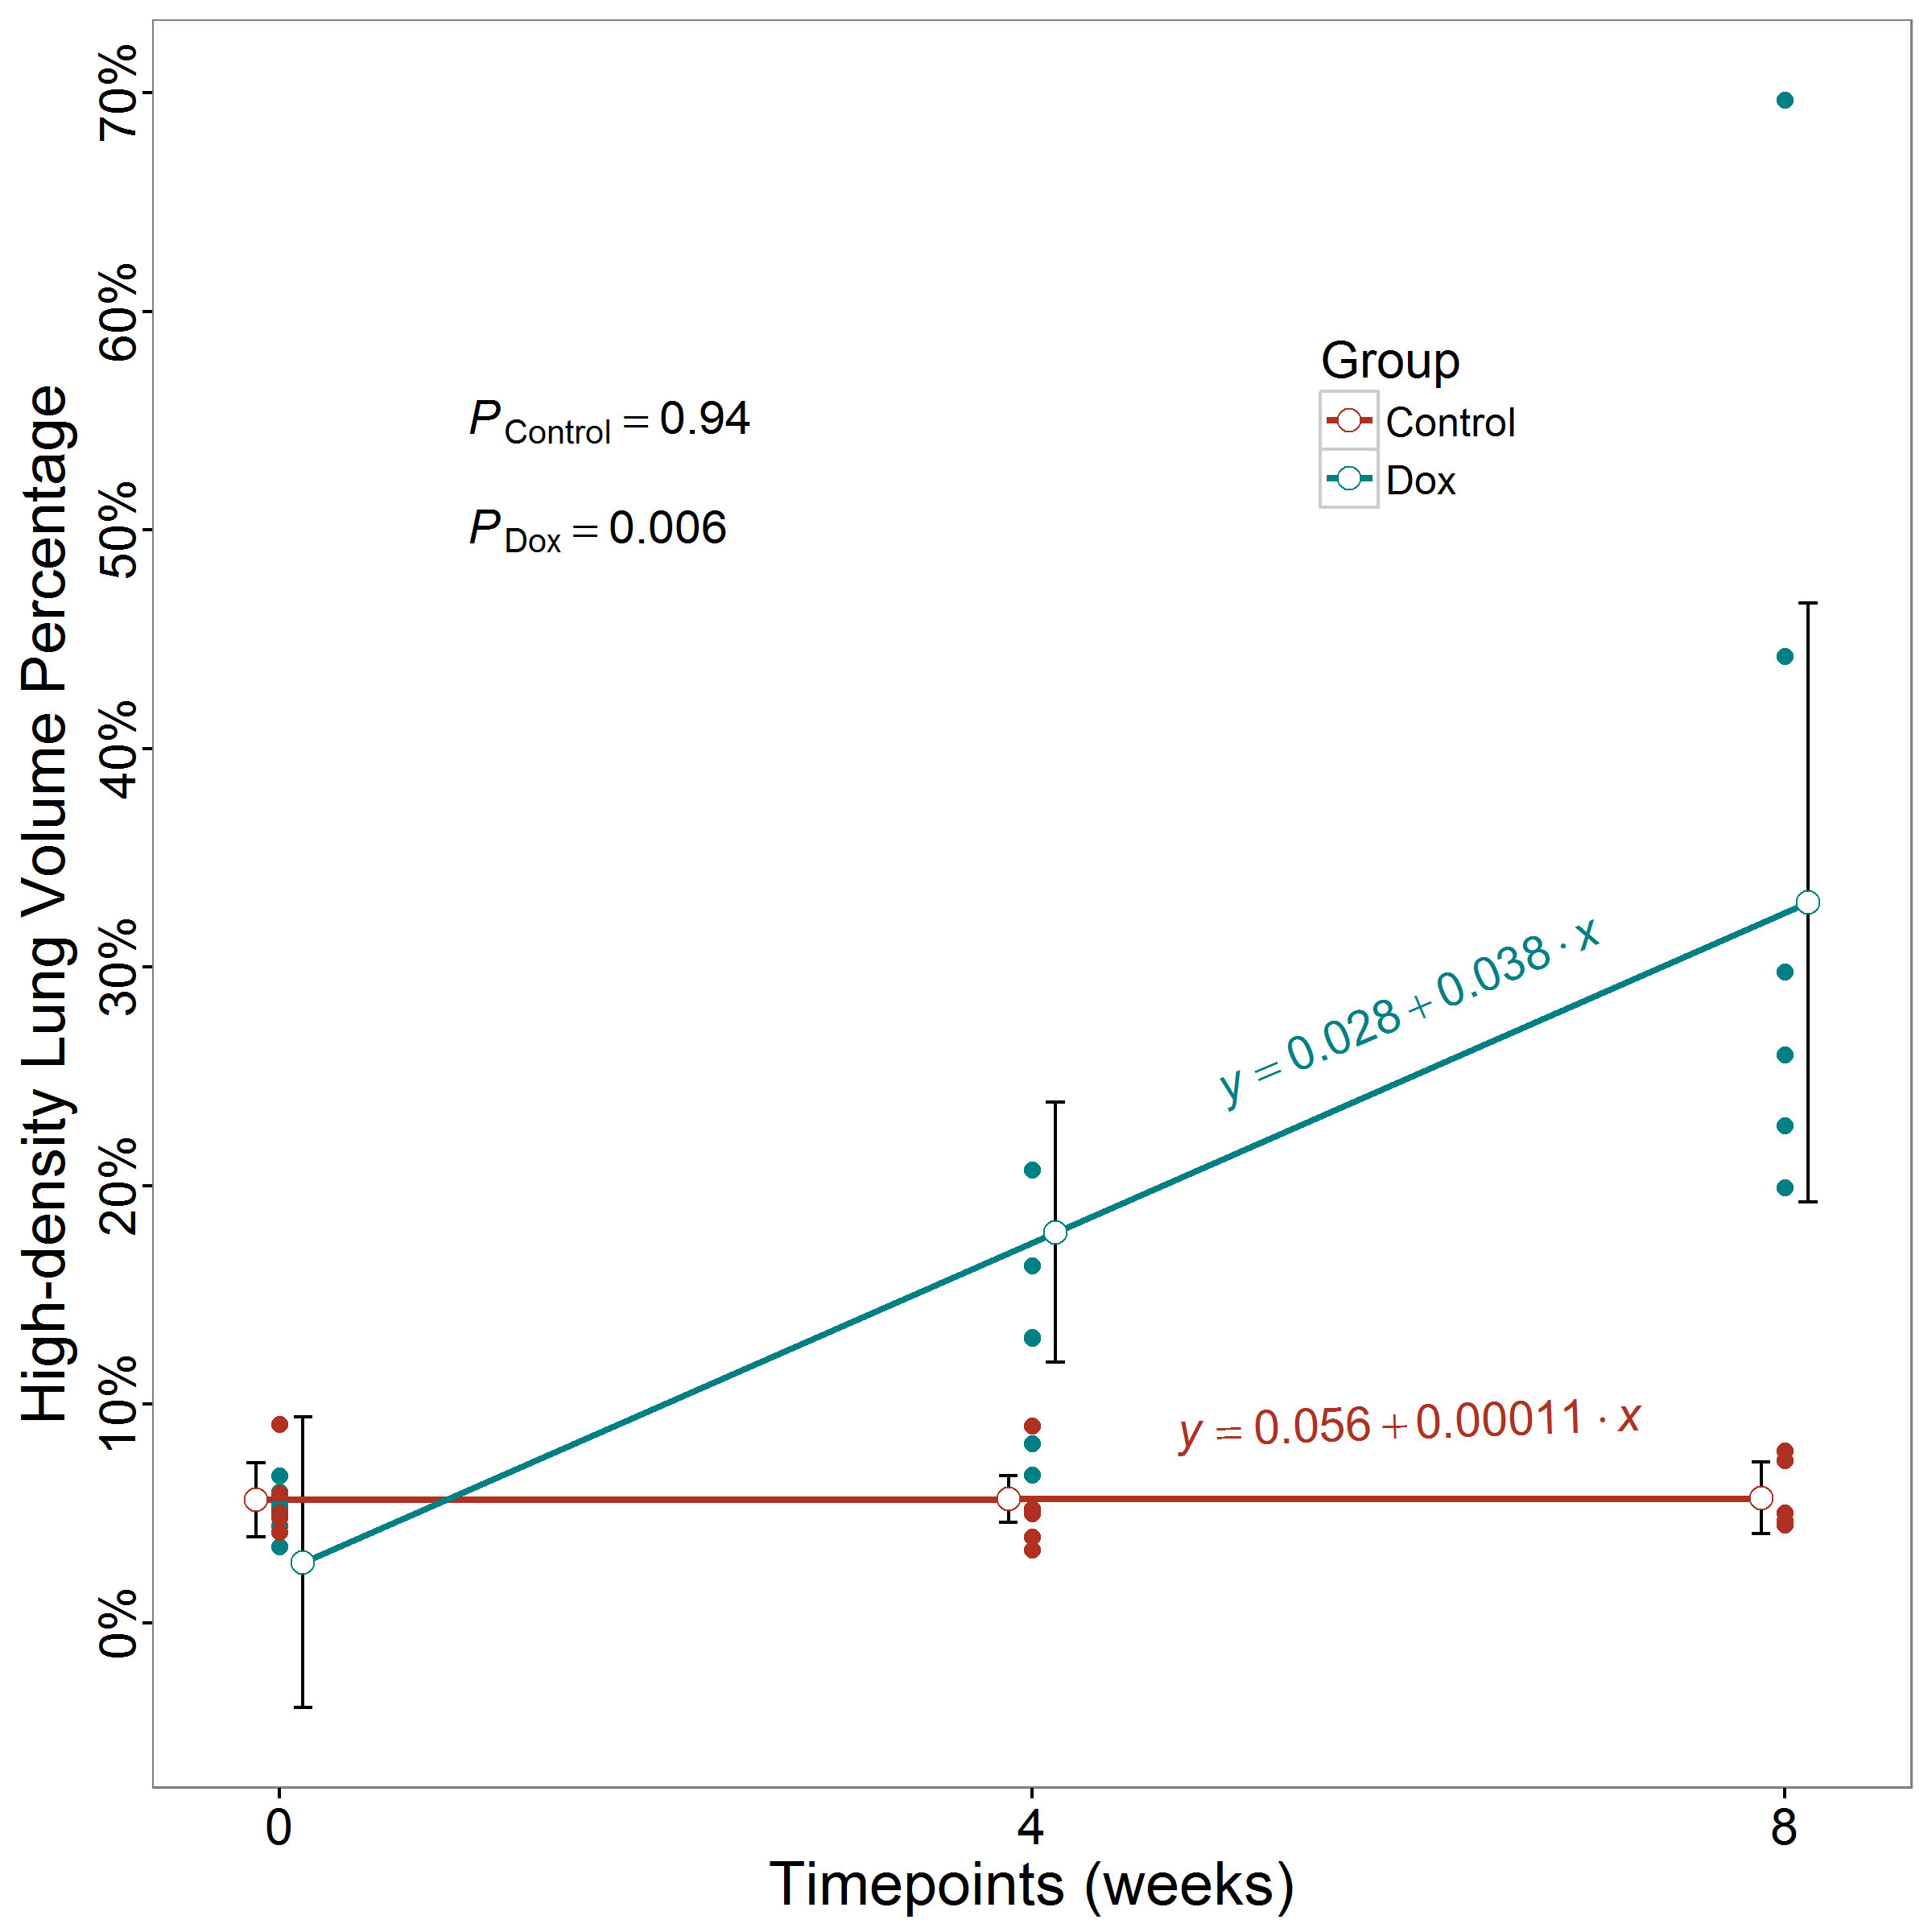
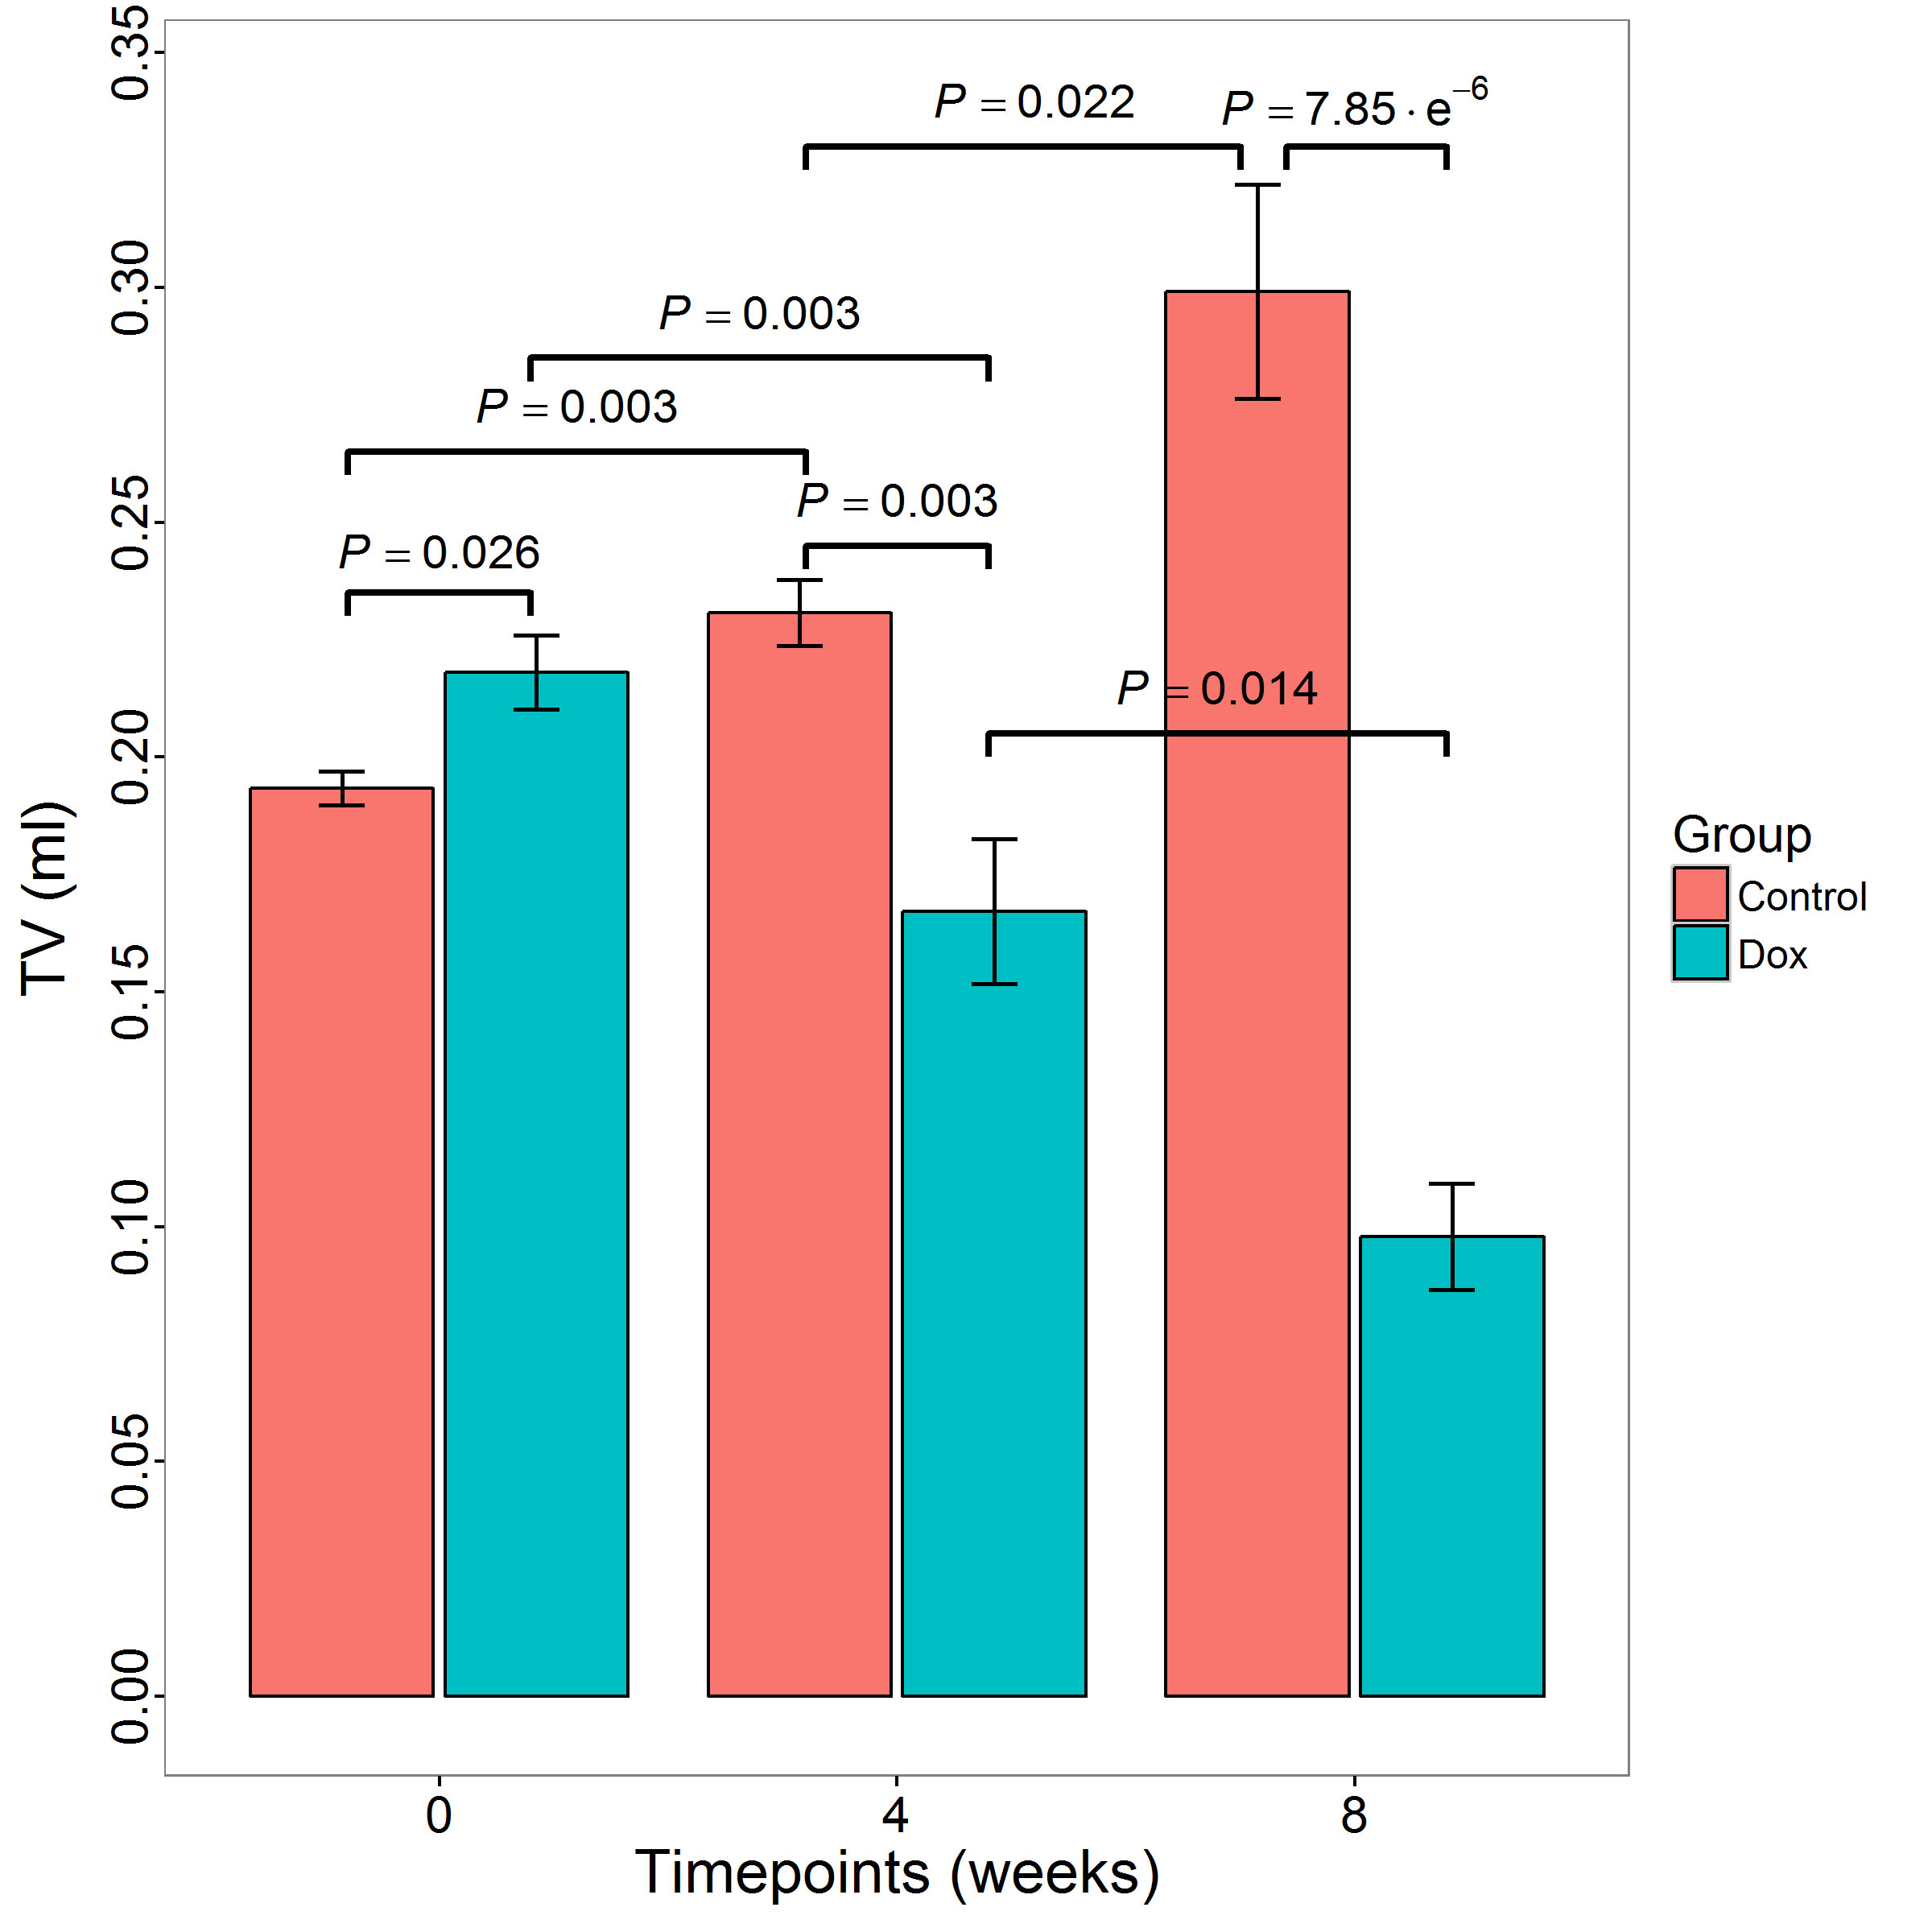
3D MR images covering the entire lungs were successfully acquired by self-gating UTE and were of high quality (parenchymal SNR ~ 18) with minimal motion artifacts. Figure 1 presents representative end-expiratory axial images for a control mouse and 2 Dox mice with different disease severities at 3 timepoints along with histological slides at week 8. Histology demonstrates pleural wall thickening, perivascular and peribronchial fibrosis in the Dox mouse lungs. No pulmonary fibrosis was visually seen at baseline in Dox cohort or at any of the 3 timepoints in Control cohort, as shown by low MRI signal throughout the lung parenchyma. Perivascular fibrosis (blue arrows) began to appear at week 4 and became severe at week 8. Pleural fibrosis appeared near the subpleural regions (red arrow) at week 4 and extended into the interstitium (yellow arrow) at week 8. Interstitial fibrosis in Dox cohort increased significantly at week 8 in Figure 1 (C). Fibrotic severity varied between Dox mice as seen by the volume of high-signal structures in images at week 8 in Figure 1 (B) vs (C), consistent with histological slides. Analysis by linear mixed-effects model showed that high-density lung volume percentage increased significantly at a rate of 3.8%/week for Dox cohort (χ2(1) = 7.60, P = 0.006), but didn't change significantly over time for Control cohort (Figure 2). Figure 3 showed that TV for Dox cohort decreased significantly by 0.051 ml from baseline to week 4 (P = 0.003 ), and by 0.069 ml from week 4 to week 8 (P = 0.014 ); whereas TV for Control cohort increased significantly by 0.037 ml from baseline to week 4 (P = 0.003 ), and by 0.068 ml from week 4 to week 8 (P = 0.022 ). TV of Dox cohort became significantly smaller than that of Control cohort at both week 4 and wee 8 due to fibrogenesis.Conclusion
We demonstrate the application of retrospective self-gating UTE MRI with ellipsoidal k-space coverage to monitor lung fibrosis in a TGF-α transgenic mouse model. MRI-derived high-density lung volume percentage and tidal volume were both able to differentiate cohorts under different treatments as well as track fibrosis progression in individual animals.Acknowledgements
No acknowledgement found.References
1. Hardie WD, Piljan-Gentle A, Dunlavy MR, Ikegami M, Korfhagen TR. Dose-dependent lung remodeling in transgenic mice expressing transforming growth factor-α. American Journal of Physiology-Lung Cellular and Molecular Physiology 2001 Nov 1;281(5):L1088-94.
2. Hardie WD, Le Cras TD, Jiang K, Tichelaar JW, Azhar M, Korfhagen TR. Conditional expression of transforming growth factor-α in adult mouse lung causes pulmonary fibrosis. American Journal of Physiology-Lung Cellular and Molecular Physiology 2004 Apr 1;286(4):L741-9.
3. Korfhagen TR, Swantz RJ, Wert SE, McCarty JM, Kerlakian CB, Glasser SW, Whitsett JA. Respiratory epithelial cell expression of human transforming growth factor-alpha induces lung fibrosis in transgenic mice. Journal of Clinical Investigation 1994 Apr;93(4):1691.
4. Guo J, Cao X, Cleveland ZI, and Woods JC. Retrospective self-gated 3D UTE MRI in mouse lung. International Society for Magnetic Resonance in Medicine 24th Annual Scientific Meeting, Singapore, May 07 - 13, 2016.
5. Guo J, Cao X, Cleveland ZI, and Woods JC. Anisotropic-resolution, quantitative pulmonary UTE MRI by ellipsoidal k-space coverage. 57th Experimental Nuclear Magnetic Resonance Conference, Wyndham Grand Hotel, Pittsburgh, Pennsylvania, April 10 - 15, 2016.
6. Team RC. R: A language and environment for statistical computing. R Foundation for Statistical Computing, Vienna, Austria. 2016. https://www.R-project.org/.
7. Bates D, Mächler M, Bolker B, Walker S. Fitting linear mixed-effects models using lme4. Journal of Statistical Software 2015;67(1):1-48. doi:10.18637/jss.v067.i01.
Figures