4865
Correlations between R2* value and liver fibrosis in radiation-treated rats at early stageRong Ma1, Dong Zhang1, Changzheng Shi1, Zhongping Zhang2, and Liangping Luo1
1Medical Imaging Center, The First Affiliated Hospital of Jinan University, Guangzhou, People's Republic of China, 2MR Research China, GE Healthcare, Beijing
Synopsis
At the early stage of liver fibrosis in radiation-treated rats, R2* value increased significantly. This suggests that R2* value could be a feasible biomarker to early evaluate liver fibrosis in vivo.
Introduction
We aimed to explore the feasibility of R2* mapping in evaluating the early stage of hepatic fibrosis in radiation-induced liver fibrosis rat models.Methods
Thirty Sprague-Dawley (SD) rats’ right hepatic lobes were irradiated by linear accelerator with the single dose of 20 Gy. All rats were divided into three groups randomly and were scanned with T1WI, T2WI and R2* mapping sequences on a 1.5T MRI scanner (Signa EXCITE HDxT, GE Medical System, Milwaukee, WI) before, 1 month, 2 month and 3 month after the irradiation, respectively. The mean values of T1WI, T2WI signal intensity and R2 * value were measured in both left and right lobes. Finally rats of each group were sacrificed at 1, 2 and 3 month after irradiation treatment respectively and the pathological samples were stained with hematoxylin eosin (HE) and masson trichrome (MT), and stages of liver fibrosis were then identified (F0, F1 and F2).Results
7 rats died during this research, and the number of remaining rats at 1, 2 and 3 month (group 1m, 2m and 3m) after irradiation were 8, 8 and 7. According to pathological results, the number of rats with right hepatic lobes identified as F0, F1 and F2 were 8, 10 and 5 respectively, and no abnormality was found at the left hepatic lobes of all samples. Only R2* value showed significant difference among various time points (P<0.05), as well as different fibrosis stages (P<0.05). Furthermore R2* value exhibited significant positive correlations with post-irradiation time (r=0.811,P=0.001) and fibrosis stages (r=0.819,P=0.001).Conclusion
R2* value has the ability to identify the early fibrosis stage in liver and it is feasible to assess the early hepatic fibrosis in vivo.Acknowledgements
No acknowledgement found.References
No reference found.Figures
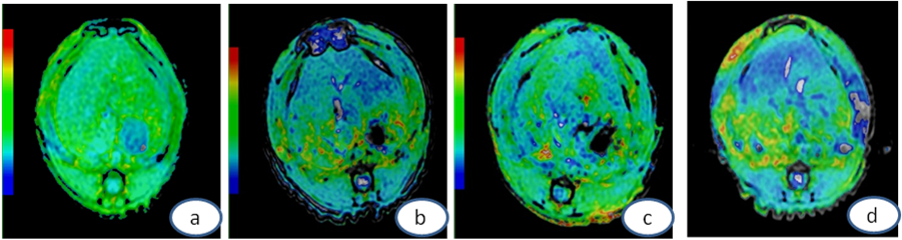
Axial
T1WI overlaid with a color map of R2*. (a-d)
represent
time
points at base, 1 month, 2 month and 3 month after irradiation, respectively. Obvious color difference between
left
and right lobes was observed at 1 , 2 and 3 month timepoints.
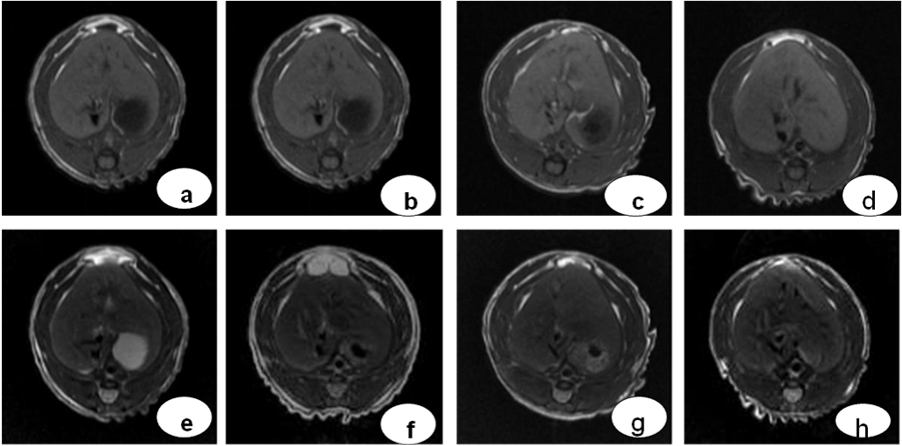
Axial
T1WI and T2WI at different time points. (a-d) represent
axial
T1WI at
base, 1 month, 2 month and 3 month, respectively. (e-h) represent T2WI at corresponding timepoints. Conventional MRI showed no
abnormal signal in both
left and right lobes.
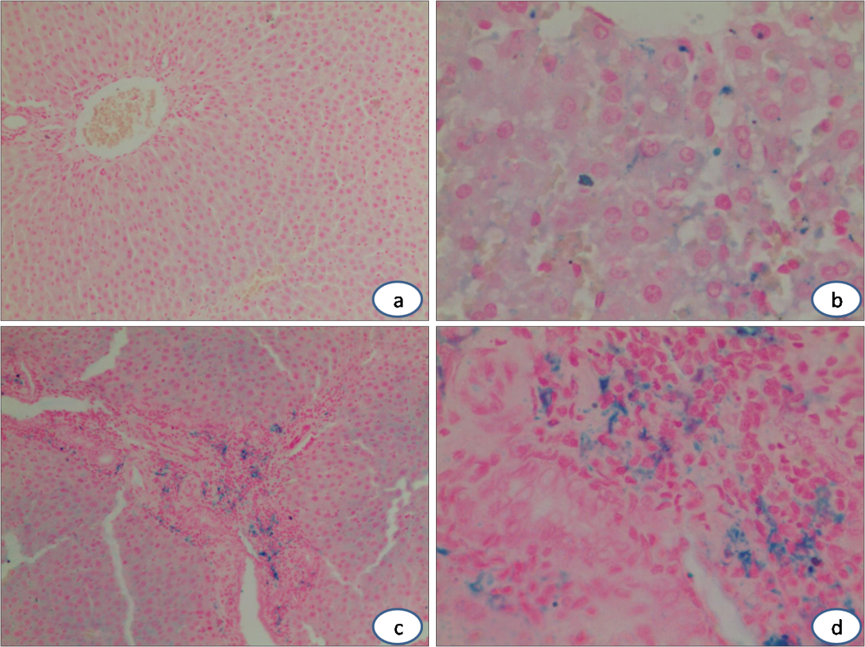
Images of masson
trichrome
staining (40X). The lobular
structure was normal in left lobe(a). Blue-stained fibrous tissues increased
gradually around the portal areas and central veins from 1 to 3 month
(b-d); fibrous septa spreaded
into lobular lobes and connected with adjacent structures(d).
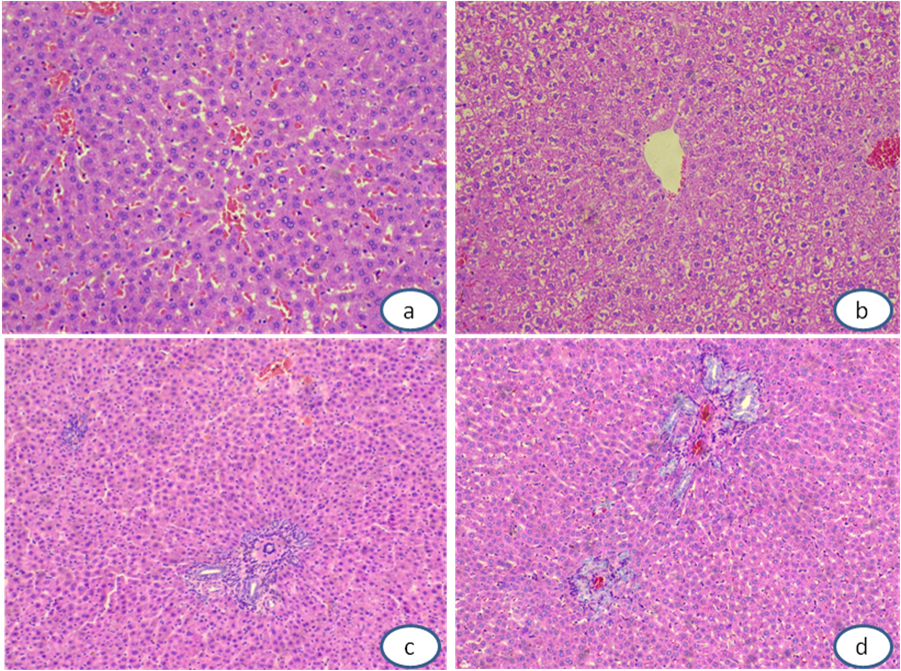
Images of HE staining(40X).
The
lobular
structure of left lobe has integrity and hepatic cord arranged in order(a).
Cytoplasm rarefaction and cell swelling that looked like ballooning
degeneration could be seen at 1 month(b). Inflammatory cell infiltrating as well
as spotty necrosis scattered in hepatic lobule and portal duct areas at
2 month(c).
Significant hyperplasia of Small bile ducts and deposition of collagen fibers were observed at
3 month.
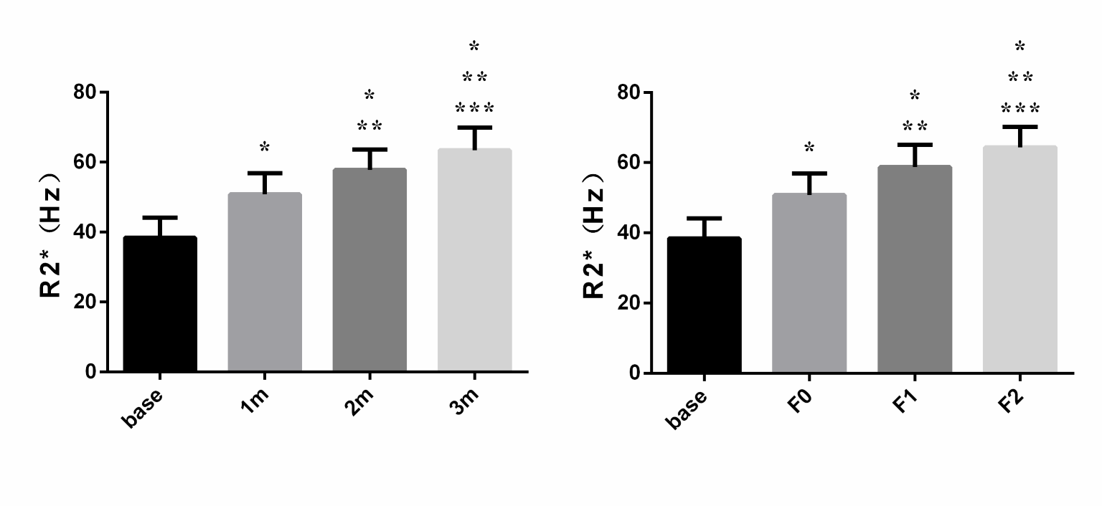
Comparisons of hepatic R2* value among base, 1 month, 2 monthand 3 month timepoints, and among base, F0, F1 and F2 fibrosis stage. “*” , “**” and “***”
represents significant difference as compared with base, 1m/F0 and
2m/F1 respectively.