4862
A multicenter in vivo study to evaluate gadoxetate DCE-MRI as a preclinical biomarker of liver function1Antaros Medical, Molndal, Sweden, 2MedTech West, Chalmers University of Technology, Gothenburg, Sweden, 3AstraZeneca, Molndal, Sweden, 4GlaxoSmithKline, King of Prussia, PA, United States, 5Amgen Inc., Thousand Oaks, CA, United States, 6Linköping University, Linköping, Sweden, 7Wolfram MathCore, Linköping, Sweden, 8National Center for Toxicological Research, U.S. Food and Drug Administration, Jefferson, AR, United States, 9AbbVie, North Chicago, IL, United States, 10AstraZeneca, Cambridge, United Kingdom, 11University of North Carolina, Chapel Hill, NC, United States
Synopsis
Gadoxetate dynamic contrast-enhanced MRI (DCE-MRI) seems promising for non-invasive quantification of liver function. Here we tested the reproducibility of gadoxetate DCE-MRI at four MRI sites using an acute clinical dose of the antibiotic rifampicin. We found significant differences between sites in maximum relative enhancement (RE) in vehicle treated rats. However, highly significant differences in maximum RE between vehicle and rifampicin treated rats was detected at all sites. To our knowledge this is the first multicenter preclinical reproducibility study of an imaging biomarker.
Introduction
DCE-MRI using the hepatocyte specific contrast agent gadoxetate (Primovist, Eovist, Bayer HealthCare Pharmaceuticals) has been proposed as a promising method for characterization of liver function in both liver disease1,2 and drug-induced liver injury in preclinical trials3. In the present study we evaluated the reproducibility of the gadoxetate DCE-MRI assay by examining the effect of a clinical dose of rifampicin on relative enhancement (RE) and area under the curve (AUC) at four different preclinical imaging centers (Amgen, AstraZeneca, GlaxoSmithKline and US Food and Drug Administration).
Experiments were conducted as part of the International Life Sciences Institute (ILSI) Health and Environmental Sciences Institute (HESI) Translational Imaging Committee program. This consortium of industry, government and academic scientists develops biomarkers of toxicity that bridge from preclinical to clinical drug development. Participants in the liver sub-group are Amgen, AstraZeneca, US Food and Drug Administration, GlaxoSmithKline, and The University of North Carolina at Chapel Hill.
Methods
All experiments were conducted in accordance with guidelines and laws for the care and use of laboratory animals. Each center included six vehicle and six rifampicin (10 mg/kg) treated rats (total 48 rats). Each rat received rifampicin or vehicle iv 60 min prior to DCE-MRI. DCE-MRI started 5 min prior to administration of 25 μmol/kg gadoxetate.
MR images were acquired on one 4.7 T, one 7.0 T and two 9.4 T systems (Bruker BioSpin, Germany). Scouts were acquired with IntraGateFLASH and a coronal slice intersecting both the liver and the spleen were selected. DCE-MRI images were acquired with a single-slice T1-weighted gradient-echo [IntraGateFLASH, TR 7.1 ms, TE 1.8 ms, FA 30°, matrix 256x256 (128x128 at one site), FoV 60x60 mm2, slice thickness 2 mm].
Region of interests (RoI) covering the liver were manually selected using ImageJ (v1.47, National Institute of Health, USA) or ParaVision (Bruker) or Analyze 11.0 (AnalyzeDirect, Overland Park, KS), depending on the center.
Results
Figure 1 shows typical coronal cross-sections of the abdomen of vehicle and rifampicin treated rats. The liver signal increased rapidly immediately after gadoxetate injection and started to decrease within 3 minutes. Liver RE was reduced in rifampicin treated rats in all centers (Figure 2). Table 1 shows that rifampicin induced significant reduction of maximum RE at all sites as well as significant AUC decreases at three of the four sites.
Discussion
In this study, we tested whether gadoxetate DCE-MRI could detect the effect of a clinical dose of the antibiotic rifampicin at four different preclinical MRI sites. Previous gadoxetate DCE-MRI studies have tested drugs at toxicological doses3; however, we demonstrated that effects can be detected in rats at clinically relevant doses. All sites detected a highly significant difference in maximum RE between vehicle and rifampicin treated rats, and three of the four sites detected differences in AUC. The percent decrease in RE and AUC between groups were similar between different laboratories.
There were significant differences in RE and AUC in vehicle treated rats between sites, which may reflect differences in hepatic transporter expression, the gadoxetate injection procedure, the MRI scanners, or differences in the way the RoIs were drawn.
Since hepatobiliary transport of gadoxetate is responsive to inhibition of Oatp1-mediated uptake and Mrp2-mediated efflux, and has been used clinically, it may be a sensitive biomarker of transporter function that is applicable both in laboratory animals and in patients. Future work will use a model based approach4 to characterize the effect of rifampicin on Oatp1 and Mrp2 function. To our knowledge, this is the first multicenter preclinical reproducibility study of an imaging biomarker.
Acknowledgements
This HESI scientific initiative is primarily supported by in-kind contributions from participants and supplemented by direct funding by HESI’s corporate sponsors (http://hesiglobal.org/partner/our-partners).References
1. Lenhard SC, Lev M, Webster LO, et al. Hepatic Phospholipidosis Is Associated with Altered Hepatobiliary Function as Assessed by Gadoxetate Dynamic Contrast–enhanced Magnetic Resonance Imaging. Toxicol. Pathol. 2015;44:51-60.2. Zhang W, Kong X, Wang ZJ, et al. Dynamic Contrast-Enhanced Magnetic Resonance Imaging with Gd-EOB-DTPA for the Evaluation of Liver Fibrosis Induced by Carbon Tetrachloride in Rats. PLoS One 2015;10(6):e0129621.
3. Ulloa JL, Stahl S, Yates J, et al. Assessment of gadoxetate DCE-MRI as a biomarker of hepatobiliary transporter inhibition. NMR Biomed 2013;26:1258-70.
4. Forsgren MF, Leinhard OD, Dahlstrom N, et al. Physiologically Realistic and Validated Mathematical Liver Model Revels Hepatobiliary Transfer Rates for Gd-EOB-DTPA Using Human DCE-MRI Data. PLoS One 2014;9(7):e104570.
Figures
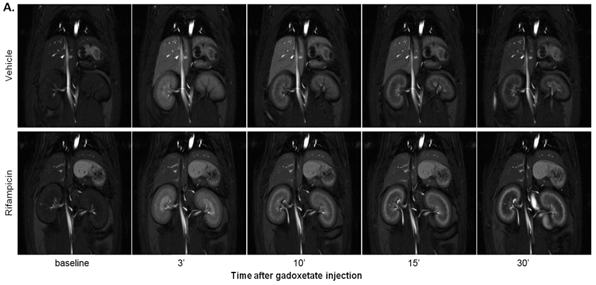
Figure 1. In vivo gadoxetate DCE-MRI of vehicle and rifampicin (10 mg/kg) treated rats.
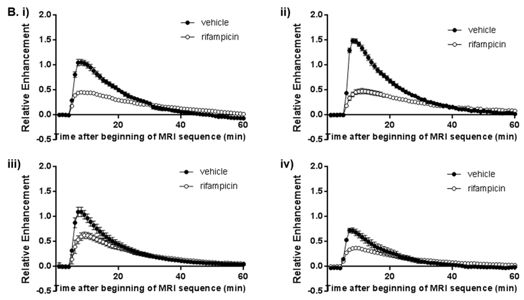
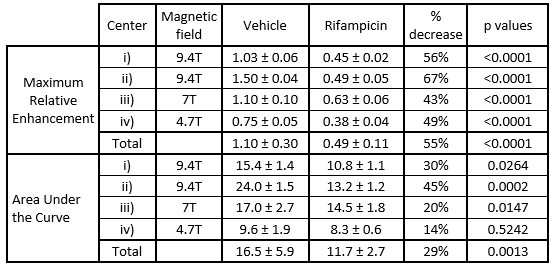
Table 1. Values of maximum relative enhancement, and Area Under the Curve, obtained in four MRI sites i), ii), iii), and iv). Values are presented as mean ± SEM. Statistical significance was evaluated with Student’s t-test using Graph Pad 6 Prism software.