4859
Whole body, high throughput mouse embryo 3D phenotyping using multi gradient echo and ultra short echo time with computed tomography validation.1Structural Biology, Skirball Institute of Biomolecular Medicine, New York, NY, United States, 2Radiology, NYU School of Medicine, 3NYU School of Medicine
Synopsis
In this study a combination of 3D multi gradient echo (MGE) and ultrashort echo time (UTE) 100 micron isotropic resolution where acquired from 6 fixed mouse embryos at embryonic day 16. The embryos where littermates from an engrailed knockout mouse whose mutant embryos die at birth. The data from the UTE was validated with a high resolution CT scan. Results verify the utility of this approach to image both soft tissue and the skeletal system in a high throughput manner. The expected phenotype was easily identifiable and the 3D reconstruction of the skeletal system was equivalent to CT.
Introduction
According to the International Mouse Phenotyping Consortium 30% of the twenty thousand gene knockout mice will be embryonic lethal [1]. Moreover, in these genetically modified mice more than one organ system is usually affected and at different time points in development. For example, deletion of both copies of the Engrailed-1 (En1) gene leads to a loss of brain tissue along with subtle developmental patterning defects in the forelimb and the developing skeletal system [2]. These developing organ systems can be generally divided into types, soft tissue and skeletal. Therefore a high throughput imaging protocol is needed to efficiently screen both these tissue types. Although computed tomography (CT) is the gold standard for bone imaging, soft tissue discrimination is possible with the use of toxic contrast agents [3]. We propose to use a combination of high field MRI and pulse sequences to image in a high throughput fashion En1 embryos for soft tissue and skeletal imaging and validating with CT.Materials and Methods
Animal model: Male and female mice with one copy of the En1 gene knocked out where mated overnight. After a successful overnight mating, the appearance of a vaginal plug stages the embryos at 0.5 day post conception (E0.5). The mouse embryos where left to develop and harvested at E16.5 and fixed in 4% PFA. Littermates where encased in a 3D printed holder with a capacity of holding 6 embryos [Figure 1].
CT imaging: X-ray computed tomography (CT) imaging was done on an Inveon 2 Siemens scanner with exposure settings of 70 kVolts and 400 mA, 34 mm transaxial and 41 mm axial field of view (FOV). Data was acquired at 29 mm isotropic resolution in 29 minutes.
MRI imaging: The holder was then put in an 80 mL syringe, filled with fomblin and degassed. The embryos where imaged with a 7T Bruker Avance 3 MRI system in a Bruker T20071V3 quadrature birdcage coil, 59/35 mm outer/inner diameter. 3D anatomical and bone datasets were acquired using multi gradient echo (MGE) and ultrashort echo time (UTE) pulse sequences. Volumetric data for both sequences was acquired with a 40x40x40 mm FOV at 100 mm isotropic resolution. MGE parameters: TE=2.8ms, TR=40ms, 2 averages, 30o FA, 150 kHz BW, 3 hr 35 min scan time. UTE parameters: TE=11μs, TR=10ms, 2 averages, 10.5 ms echo spacing, 30o FA, 200 kHz BW, 2hr 49min scan time.
Image processing: The CT and MRI data where imported in Amira visualization software (Version 5.5) for image processing, segmentation and visualization. Embryos where semi-automatically segmented from each MGE, UTE, and CT data set and all embryos were registered to a common space and normalized to a common gray scale.
Results and Discussion
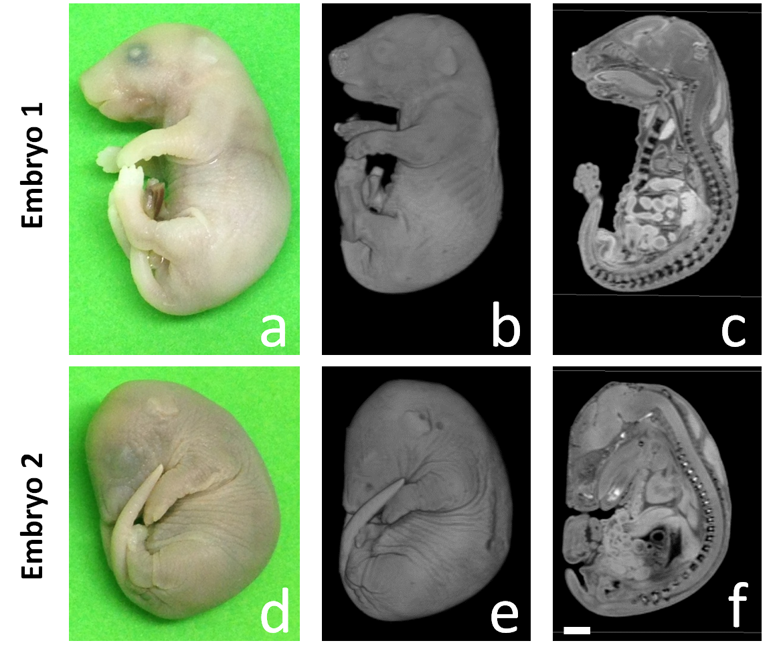
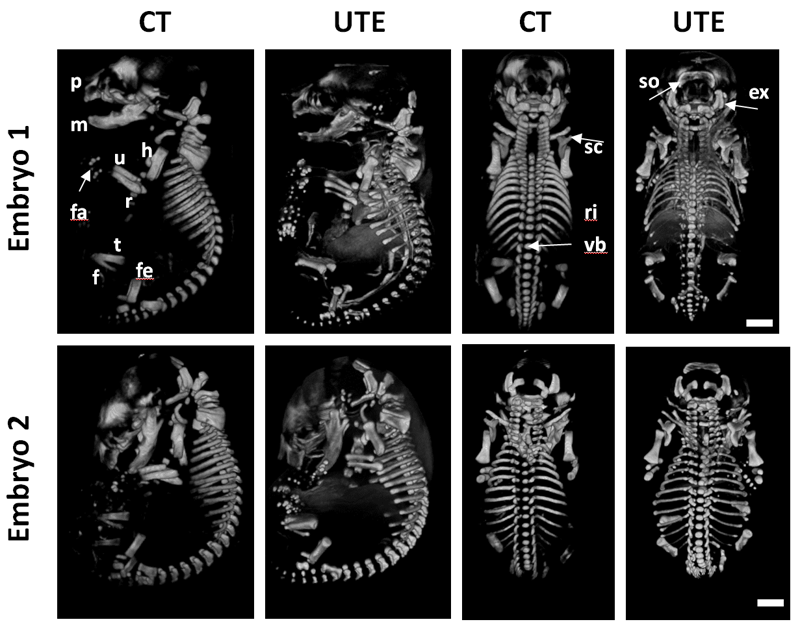
A mid sagital section through a normal and En1 mutant (Figure 2a,c) clearly demonstrates the power of MRI to distinguish soft tissue organs. Apart from the obvious difference in embryo size, a zoom in into the brain region (Figure 2b,d) shows the expected loss of midbrain tissue as previously reported [2]. Even at 100 mm resolution, the volumetric MRI rendering of the embryo exterior maps one to one with a photographic rendering with fine surface features like wrinkles defined with high fidelity (Figure 3). External and internal differences between embryo 1 and embryo 2 are apparent and will be amenable to quantification. Traditionally the skeletal system has been visualized through embryo clearing followed by whole body alizarin and alcian blue staining. These stain for ossification centers and cartilaginous skeleton respectively [4]. Inspection of the UTE skeletal volume renderings in Figure 4 with those in the Kaufman Atlas [4] reveals a high correlation of the anatomical features of the ossification centers. The high quality of the volume rendering allows the precise annotation of the different ossification centers throughout the embryo. Moreover the accuracy of the 3D UTE data is validated with a side by side comparison with the CT data. In some cases the UTE data more accurately visualizes certain ossification centers such as the falanges (Figure 4, fa) and the supraoccipital bone (Figure 4, so) compsed of two halves which is not present in the CT image.Conclusion
We have validated an imaging pipeline where both soft tissue and skeletal organ systems can be acquired in a high throughput fashion. With better RF coil characteristics a higher number of late stage embryos can be imaged in one session. With the amount of volume data sets increasing geometrically, better automatic segmentation algorithms must be integrated to increase throughput efficiency [5,6]. These algorithms should be able to automatically segment whole organ systems for further analysis.Acknowledgements
This work was performed at the Preclinical Imaging Core; a shared resource partially supported by the NYUCI Center Support Grant, “NIH/NCI 5P30CA016087”, the NIBIB Biomedical Technology Resource Center (NIH P41 EB017183) and by NIH grant UL1 TR00038 from the National Center for Advancing Translational Sciences (NCATS).
NIH grant R01 NS038461
References
[1] Adams D et. al., Bloomsbury report on mouse embryo phenotyping: recommendations from the IMPC workshop on embryonic lethal screening, Dis. Model. Mech., 6, 2013
[2] Wurst W et. al., Multiple developmental defects in Engrailed-1 mutant mice: an early midhindbrain deletion and patterning defects in forelimbs and sternum, Development, 120, 1994
[3] Descamps E et. al., Soft tissue discrimination with contrast agents using micro-CT scanning, Belg. J. Zool, 144, 2014
[4] Kaufman MH, The Atlas of Mouse Development, pp 495-507, 1992
[5] Kuo JW, Nested Graph Cut for Automatic Segmentation of High-Frequency Ultrasound Images of the Mouse Embryo., IEEE Trans. Med. Imaging, 35, 2016
[6] Wong MD, Automated pipeline for anatomical phenotyping of mouse embryos using micro-CT, Development, 12, 2014
Figures
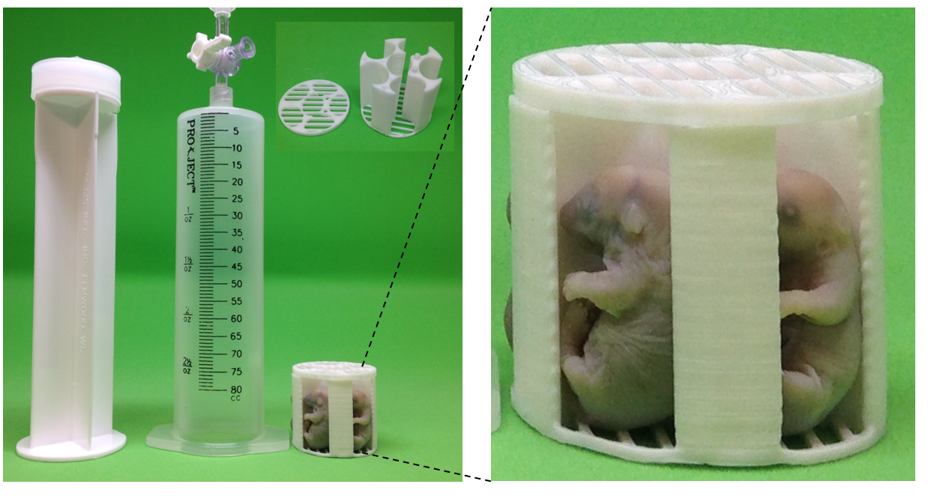
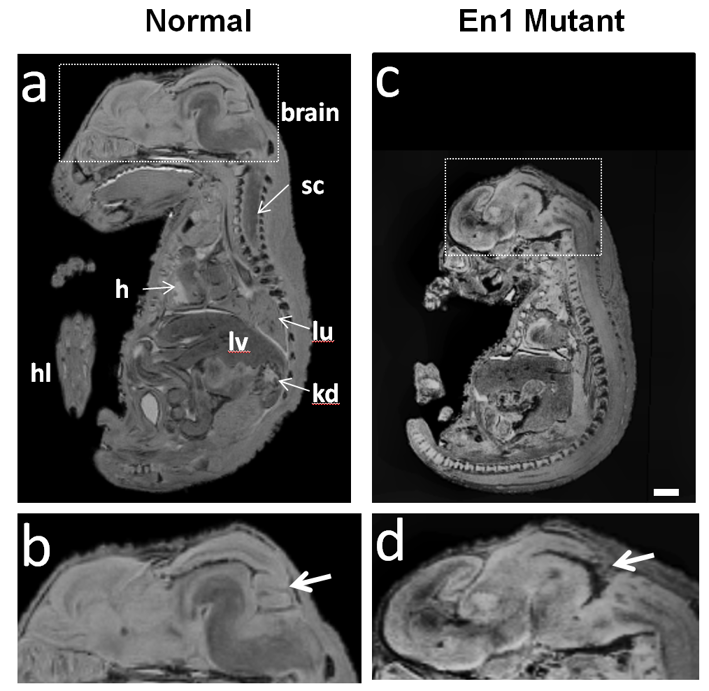
Figure 2. Sagital section from a gradient echo image of an E16.5 wild type (a) and mutant (b) littermate . The arrows (b,d) indicate loss of the midbrain tissue as expected from previous reports. Embryonic features: hl=hind limb, kd=kidney,h=heart, lv=liver, lu=lung, sc=spinal chord Scale bar= 2mm.