4858
Assessment of unilateral renal infarction with VTE-ASL in comparison with DCE-MRI1Academy for Advanced Interdisciplinary Studies, Peking University, Beijing, People's Republic of China, 2College of Engineering, Peking University, Beijing, People's Republic of China, 3Interventional radiology and vascular surgery, Peking University First Hospital, Beijing, People's Republic of China, 4Department of Radiology, Peking University First Hospital, Beijing, People's Republic of China
Synopsis
DCE-MRI and ASL are promising method in evaluating renal disease. However, their application on renal infarction is lagging behind. In this study, we aim to investigate the value of VTE-ASL and DCE-MRI in renal infarction assessment and further compare the results with histological findings.
Introduction
DCE-MRI helps to detect and characterize renal infarction and thus is highly valuable in clinical. However, this method is invasive and injection of contrast agent may cause problems, in particular for patients with reduced kidney function. Arterial spin labeling with variable echo time (VTE-ASL) is a noninvasive perfusion imaging technique capable of estimating GFR relying on magnetically labeled water protons as an endogenous tracer [1]. In order to investigate the value of VTE-ASL and DCE-MRI in renal infarction assessment, 10 rabbits with unilateral renal infarction were examined with these two different techniques. Glomerular filtration, renal blood R2*, renal blood flow calculated from VTE-ASL and kinetic parameters obtained by DCE-MRI were further compared with histological findings.Methods
Twenty New Zealand white rabbits (male, 2.5–3.0 kg) with unilateral renal infarction were included in this study. The study was accepted by the local ethics committee. Rabbits were implemented a unilateral renal infarction surgery procedure after anesthetization. The left kidney was normal and regarded as the control group. MR imaging was performed on rabbits using a 3T MR scanner (Signa ExciteTM; General Electric Medical Systems, Milwaukee, WI, USA) with 8-channel TORSOPA coil, and the coil could cover the abdomen of the rabbits. VTE-ASL was performed with variable TEs: 20,40,60,80,100,120,140,160ms. Other parameters are: TR=3000ms, flip angle=90°, slice thickness=5mm, inversion time=1500ms. A 3D SPGR sequence with flip angle= 3° 9° and 20° was performed for T1 estimation [2] to further compute RBF map. R2* and extraction fraction E map were constructed by fitting the signal time course to a dual-exponential curve. The GFR map was also obtained pixel-by-pixel based on the E and RBF maps. Subsequently, a lava sequence was performed with the following imaging parameters: TR = 5.7 msec, TE = 1.2 msec, flip angle = 15°, matrix = 128 × 128, NEX = 1, 180 × 180-mm field of view, 4.0 mm thickness and 24 slices. During each acquisition, five pre-contrast frames were obtained, then, an administration of 0.1 mmol/kg of contrast agent (Omniscan; GE Healthcare Ireland, IDA Business Park, Carrigtohill, Co.Cork) was performed with a venous cannula, and 5 ml of saline was immediately flushed in. Totally 70 frames were obtained for each animal. The temporal resolution is 6.0 s and total scan time is about 7 minutes. Quantitative DCE-MRI parameters including GFR and Vb were derived from Tofts model [3]. Kidneys in infarction experiment were fixed in 10% neutral buffered formalin and embedded in paraffin for light microscopic study. Kidneys were sectioned into 3-mm slides and stained for histology with hematoxylin-eosin. One experienced pathologist, who was blind to which experimental group the samples belonged, reviewed histological findings.Results
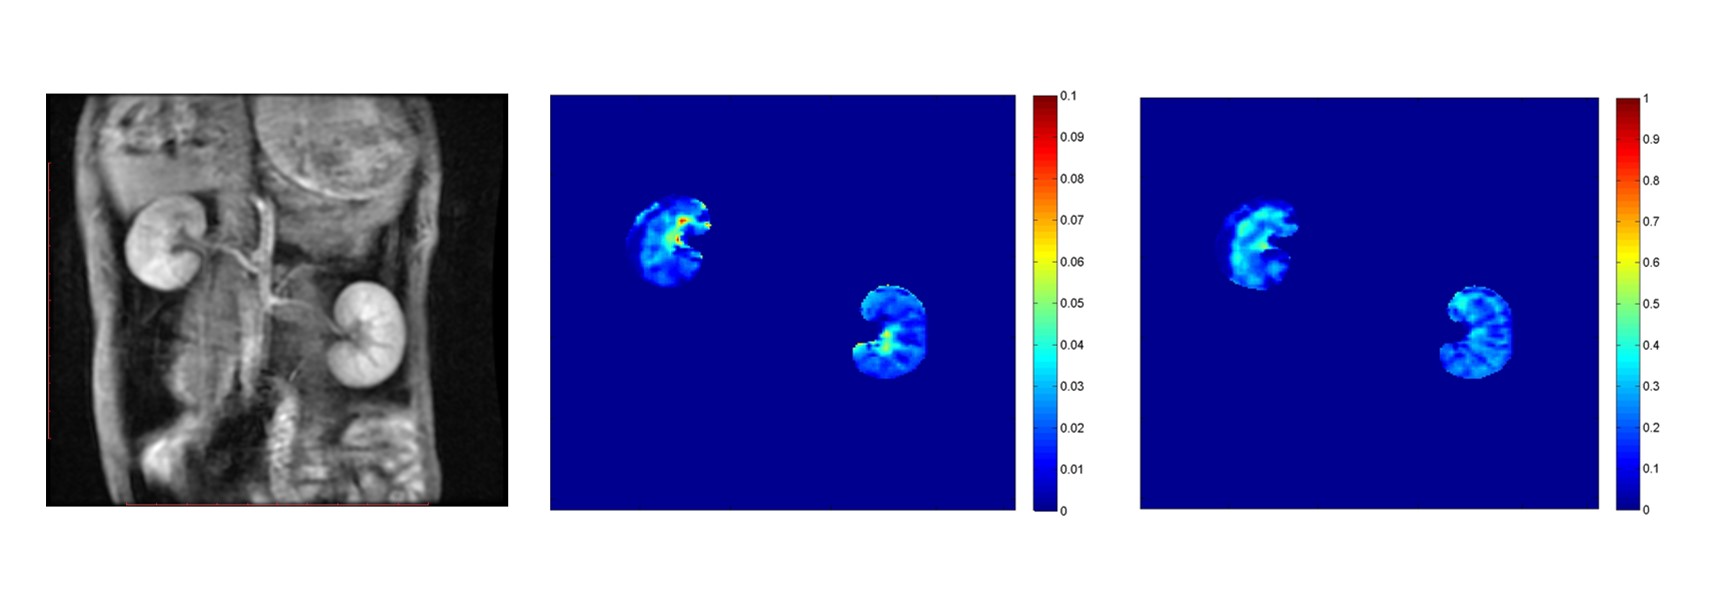
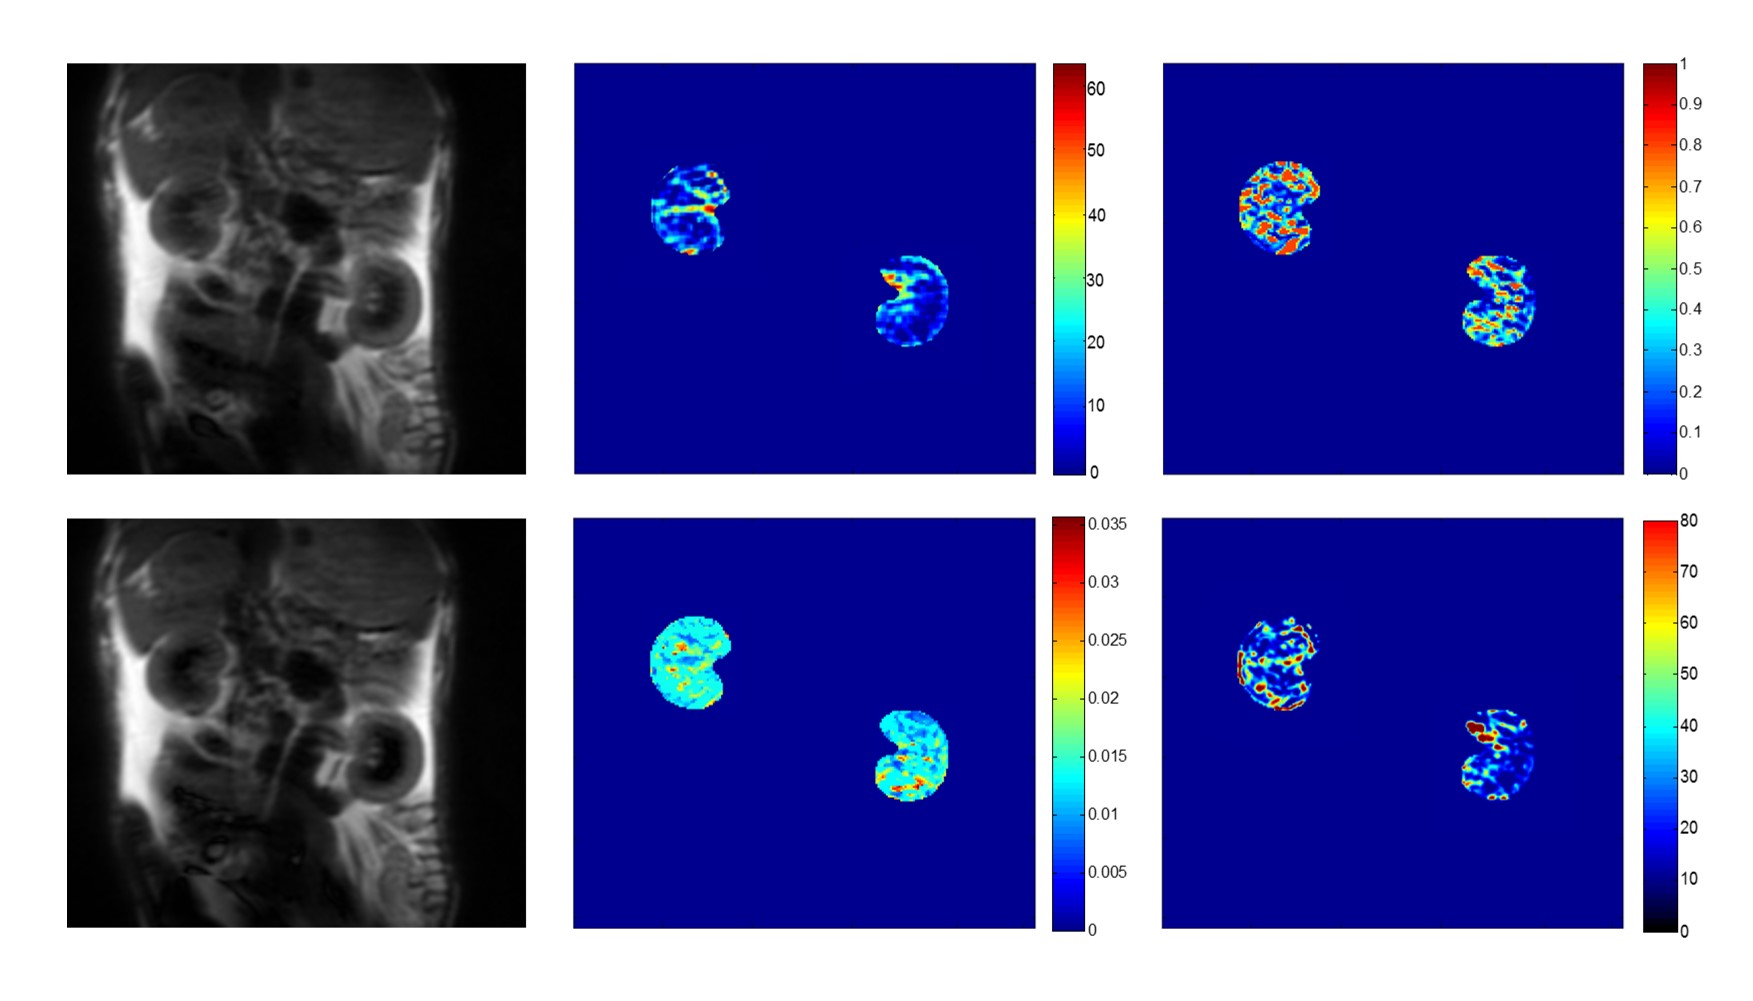
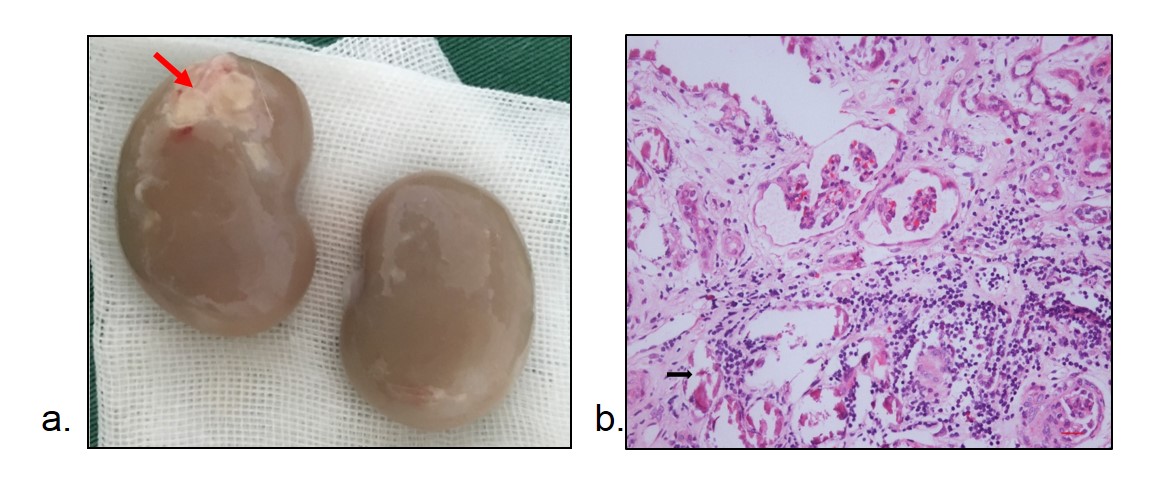
The GFRDCE and Vb of infarction and normal kidney were 2.83±0.60 ml/min, 3.28±1.07 ml/min, 0.24±0.12, 0.27±0.22, respectively. Significant decrease of GFRDCE and Vb were found in infarction region of the right kidneys (red arrow, GFRDCE = 1.06±0.42 ml/min, Vb = 0.09±0.04), shown in Fig. 1, while GFR and Vb of the contralateral region of left kidneys remain normal (GFRDCE = 2.91±1.0 ml/min, Vb = 0.25±0.11, P=0.05). The GFRASL and RBF of infarction and normal kidney were estimated as 2.75±0.52 ml/min,3.03±0.99 ml/min, 3.15±0.27 ml/min, 2.86±0.48 ml/min, respectively. GFRASL and GFRDCE were highly in agreement with each other in both infarction kidney and normal kidney. Significant decrease of GFRDCE and Vb were found in infarction region of the right kidney (red arrow, GFRDCE = 0.98±0.58 ml/min, Vb = 0.11±0.03, P = 0.05). However, intensity of E map and R2* did not show significant difference across all rabbits. This position had proved infarction by tissue specimen. Histological results showed that lamellar inflammatory cells infiltrated in renal interstitium. The glomeruli show ischemic and wrinkled features with dilated change of Bowman‘s capsule. Abscission of the epithelial cells, tubular ectasia and ellular debris (arrowheads) are observed.Discussion and Conclusion
According to previous study, GFR could be estimated noninvasively based on ASL method with variable TEs. Compared with DCE-MRI, the GFR values of the ten rabbits obtained by VTE-ASL suggest that there is much comparability between noninvasive and established invasive methods. In our study, VTE-ASL and DCE-MRI are both capable of evaluating renal infarction. Histopathologic analysis of infarction areas corresponding to low GFR regions on ASL and DCE confirmed lower Vb and RBF compared to normal kidney tissue. Our findings indicate that both VTE-ASL and DCE-MRI are viable in evaluation of renal infarction.Acknowledgements
No acknowledgement found.References
[1] Jing Wang, Yudong Zhang, Yue Zhang, Xiaoying Wang, Jue Zhang, and Jing Fang. The feasibility study of exploring arterial spin labeling for renal glomerular filtration rate ( GFR) mapping. ISMRM, 2012.
[2] Chen B, Kai Z, Bo L, et al. High temporal resolution dynamic contrast-enhanced MRI using compressed sensing-combined sequence in quantitative renal perfusion measurement[J]. Magnetic Resonance Imaging, 2015, 33(8):962-969.
[3] Tofts P S, Cutajar M, Mendichovszky I A, et al. Precise measurement of renal filtration and vascular parameters using a two-compartment model for dynamic contrast-enhanced MRI of the kidney gives realistic normal values[J]. European Radiology, 2012, 22(6):1320-1330.
Figures