4857
Intravoxel Incoherent Motion MR Study of Rabbit Liver Fibrosis Model1Department of Radiology, Affiliated hospital of Chengdu University, Chengdu, People's Republic of China, 2GE Research China, GE Healthcare, Beijing, People's Republic of China
Synopsis
Staging of liver fibrosis is of great clinical value, because early stage fibrosis is reversible under proper treatment. Liver biopsy, which is currently the golden standard for fibrosis staging, has many limitations. In this study, we evaluated non-invasive IVIM diffusion imaging technique on rabbit liver fibrosis models. As a result, IVIM parameters show significant difference between normal, early and advanced fibrosis liver models. Our study suggests that IVIM parameters have potential to become the biomarker for liver fibrosis staging.
Introduction
Liver fibrosis is considered to be a common complication of chronic liver diseases, and may subsequently progress to cirrhosis and hepatocellular carcinoma (HCC). By assessing the amount of fibrosis and level of architectural disorganization, liver fibrosis can be staged histologically into four stages. It is commonly believed that stage 2 (F2) can be reversible, therefore early diagnosis and staging could facilitate a better management to fibrosis patients.1 To date, liver biopsy is considered the golden standard for diagnosis and grading of fibrosis. However, it is an invasive procedure with inherent risks, and the results may be affected by sampling error. Intravoxel Incoherent Motion (IVIM) based on diffusion imaging is a multi-B value technique that can evaluate molecular movement or diffusivity in a non-invasive manner.2 The hemodynamic as well as molecular changes induced by different fibrosis stages may lead to significant difference in IVIM parameters.
The purpose of this study is to investigate the possibility of using bi-exponential IVIM model in the grading of liver fibrosis in rabbit liver models.
Method and Materials
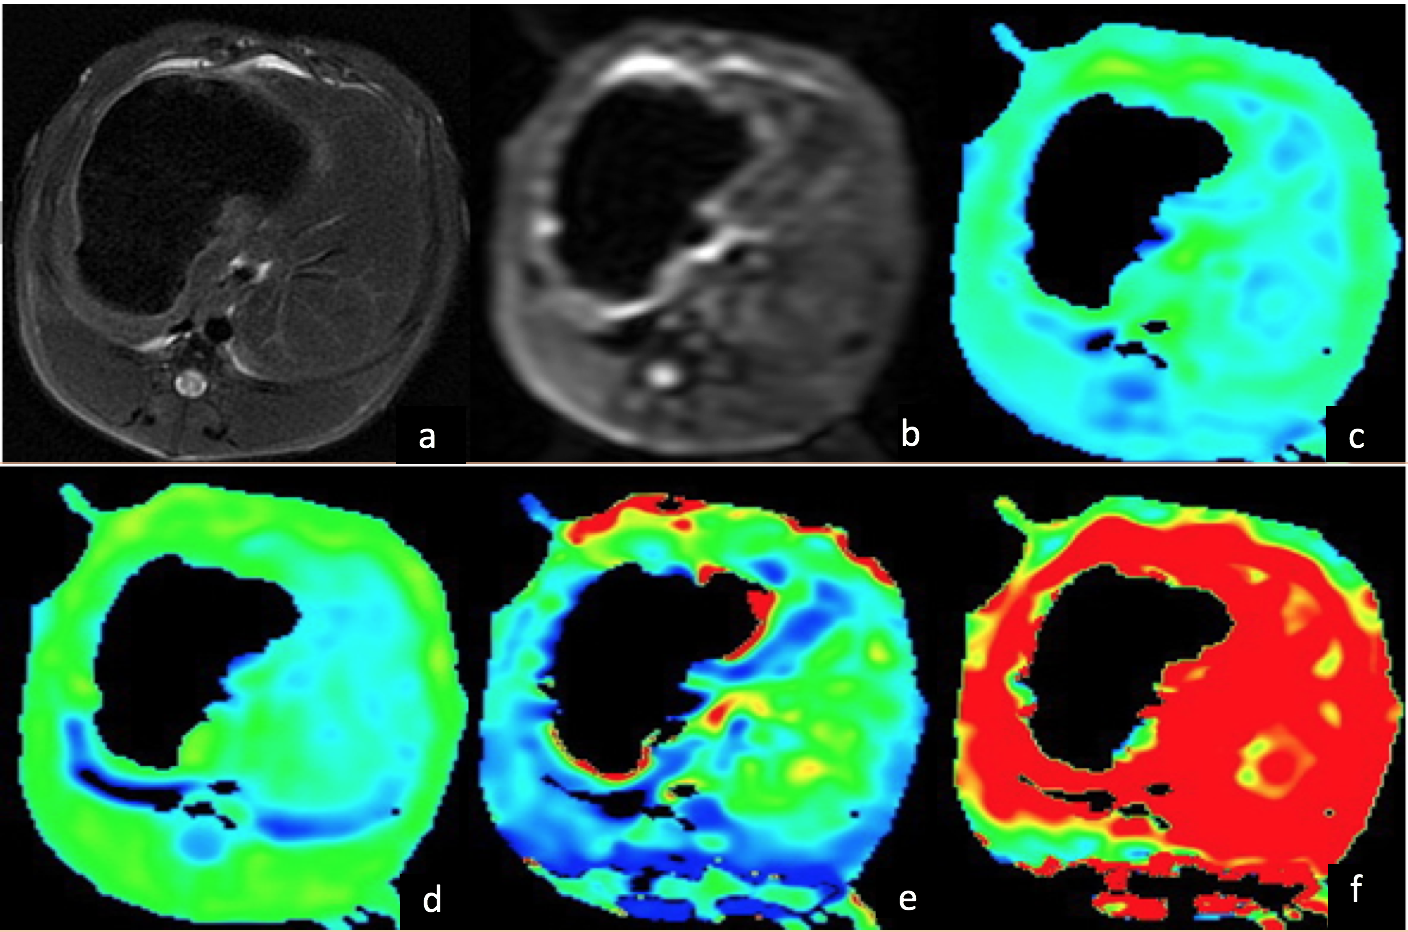
This study, which was approved by the Ethics Committee, included totally 60 rabbit models. Different stages fibrosis models were prepared by repetitive administration of carbon tetrachloride (CCl4). 8 rabbits in control group were injected saline solution. DWI scan was conducted on a 3.0T MR system (MR750, GE Healthcare, Milwaukee, USA). Single b value (800 mm²/s) DWI and multi-b value DWI were acquired on the axial plane with 10 b values (0, 20, 50, 100, 150, 200, 400, 600, 800, 1000 mm²/s). A build-in post processing algorithm based on bi-exponential model is used to generate IVIM parameter maps: D (true diffusion coefficient), D* (pseudo-diffusion coefficient) and f (the fractional perfusion related to microcirculation). Five regions of interest (ROIs) of different slices were manually drawn by two experienced radiologists on each animal liver to calculate ADC, D, D* and f values. The average value of all ROIs of ADC, D, D* and f values were performed by t-test to determine if there was any statistically significant difference between normal and F1 stage, F2 and F3 using a P-value level of 0.05.Results
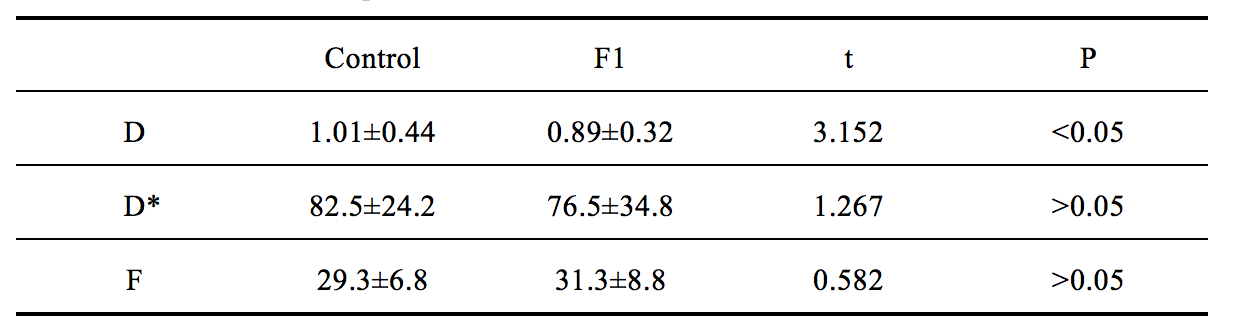
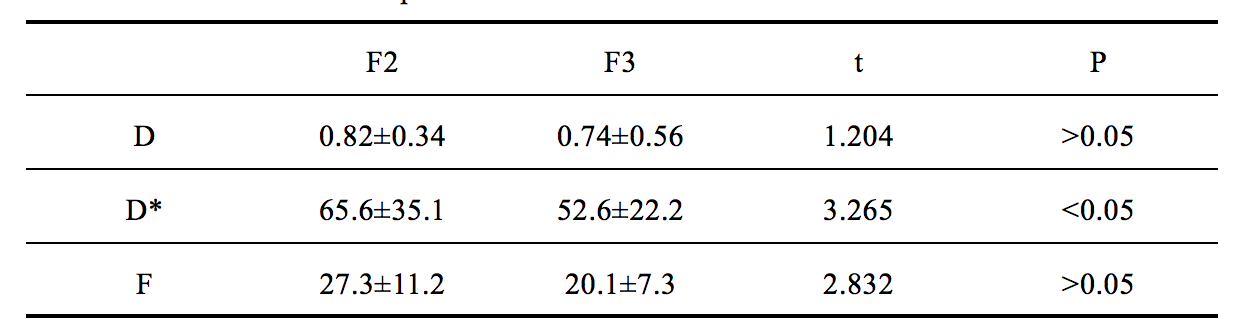
Fifty-three liver fibrosis models were successfully established (7 rabbits died during the experiment), which classified into 14 F1, 17 F2, 12 F3 and 9 F4 according to pathological results. In mono-exponential model, the overall ADC value of liver fibrosis groups were less than the control group (1.12±0.34, 0.90±0.37, respectively; P<0.05). However, neither significant differences were showed between normal and F1 fibrosis, nor between F2 and F3 stage. In bi-exponential IVIM model, D value showed significant decrease in fibrosis F1 group compare with control group (1.01±0.44, 0.89±0.32, respectively; P<0.05), but there were no differences of D* (85.5±24.2, 76.5±34.8, respectively; P=0.23) and f (29.3±6.8, 31.3±8.8, respectively; P=0.6) (Table 1). Meanwhile, D and f values showed no significant differences between F2 and F3 fibrosis groups D (65.6±34.8, 52.6±22.2, respectively; P<0.05) and f value (27.3±11.2, 24.1±7.3, respectively; P=0.32). However, D* showed significant difference in these two fibrosis groups (65.6±34.8, 52.6±22.2, respectively; P<0.05) (Table 2).Discussions
Our study agrees with previous results that ADC can be used in differentiating between normal liver and liver fibrosis. However, there are no statistical differences of ADC value between normal/F1 phase and F2/F3 phase. In IVIM, there were significant differences in D values between the control group and the F1 phase of liver fibrosis, which indicated that D values could be helpful for early detection of liver fibrosis. This is different with previous study.3 We infer that during the early stage of fibrosis, the hyperplasia of connective tissue led to water molecular diffusion limitation and decrease of the D value. Meanwhile, the changes of liver structure were not enough to result a significant decrease in portal vein perfusion pressure, so the D* values and f value showed no obvious decline. The D* value and f value of F3 phase was significantly decreased compared to F2, which indicate hemodynamic change between F2 and F3.Conclusions
In bi-exponential IVIM model, D value can be used to detect fibrosis stage F1 and D* value can differentiate F2 and F3. IVIM parameters can be used for liver fibrosis staging and monitor its progression in a noninvasive mannerAcknowledgements
No acknowledgement found.References
1. Bataller R, Brenner DA. Liver fibrosis. J Clin Invest 2005, 115: 209-218.
2. Le Bihan D, Breton E, Lallemand D, et al. Separation of diffusion and perfusion in intravoxel incoherent motion MR imaging [J]. Radiology 1988, 168:497–505.
3. Chow MA, Gao DS, Fan SJ, et al. Liver fibrosis: an intravoxel incoherent motion study [J]. J Magn Reson Imaging 2012, 36:159–167.
Figures