4851
Imaging Seminiferous Tubules in a Mouse Model at 9.4 T – Feasibility for In Vivo Fertility Research1Academic Unit of Radiology, University of Sheffield, Sheffield, United Kingdom, 2Department of Oncology and Metabolism, University of Sheffield, Sheffield, United Kingdom, 3Biological Services Unit, University of Sheffield, Sheffield, United Kingdom
Synopsis
Damage to gonads, including the seminiferous tubules or epididymis, can diminish male fertility. Fertility research often employs mouse models, yet biopsy procedures may sometimes be incompatible with longitudinal studies. A viable non-invasive alternative may be MR. We scanned 8 mice at 9.4T, showing that internal testicular structure can be clearly observed, accurate measurements of seminiferous tubules (volume, diameter) obtained, extra-testicular tissues (e.g. epididymis) identified and spectroscopy peaks spatially localized across different tissues. This indicates that MRI/MRS could be useful in mouse models of fertility and possibly extended to human fertility studies in the future.
Introduction
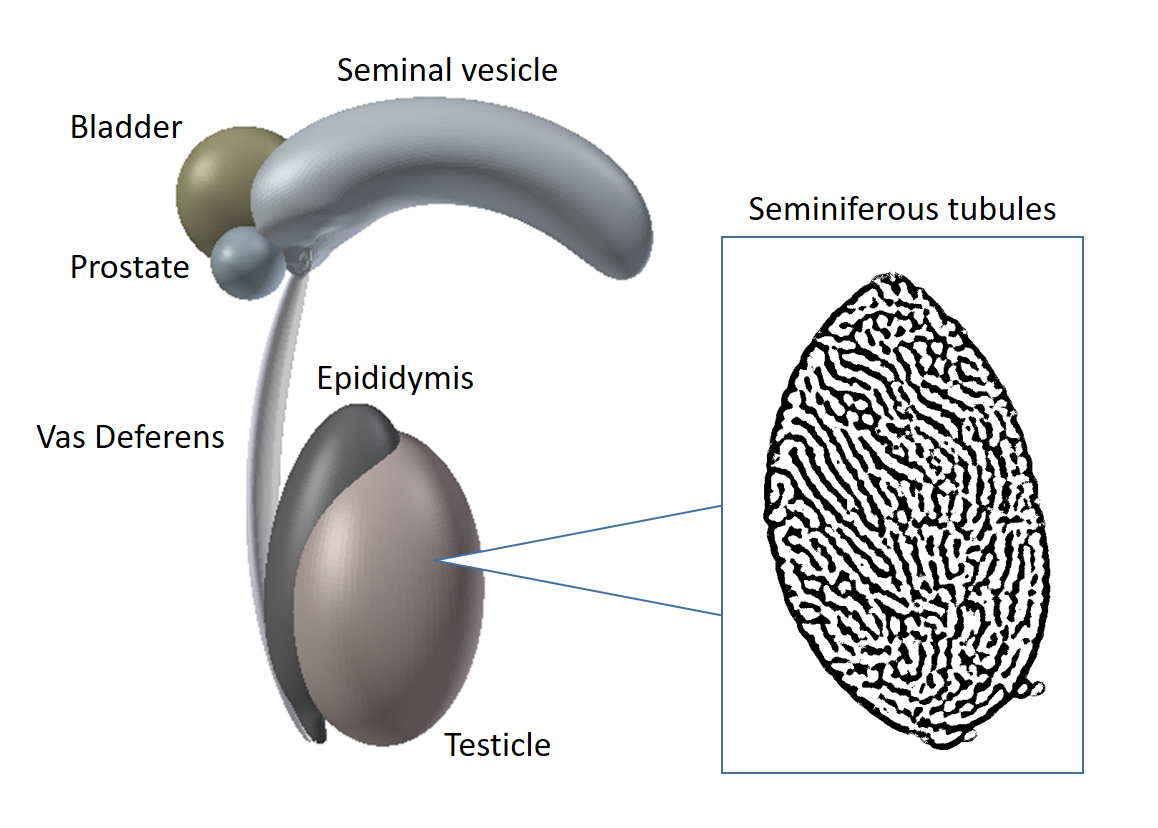
Fertility problems affects a large number of couples, and the male factor is responsible in 50% of cases1. Spermatozoa are produced continually (but not uniformly) in seminiferous tubules, which are convoluted tubes constituting the majority of the testicular tissues (Fig 1). Damage to the seminiferous tubules or epididymis can significantly diminish fertility, and may be caused by a range of etiologies including viral infection (zika virus)2. Fertility research commonly use mouse models due to their availability and similar spermatogenesis to humans3. While testis biopsies may be used to assess testicular function, these are invasive procedures and thus not always compatible with longitudinal studies. High-field MR may thus offer a non-invasive method to investigate testicular function in mouse infertility models. In this study, the gonads of male mice at different post-pubertal developmental stages were scanned at 9.4T, with the aim to quantify the structure of seminiferous tubules in situ versus ex vivo at different ages.Methods
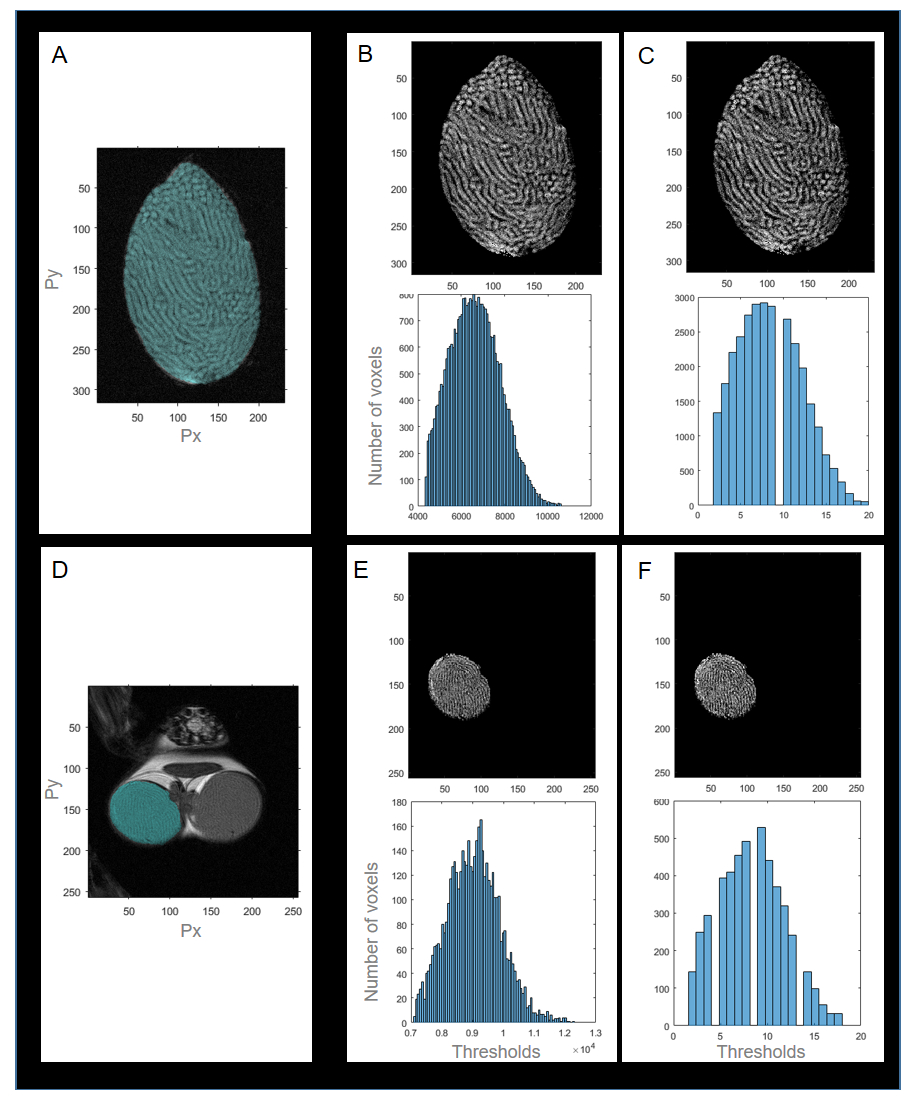
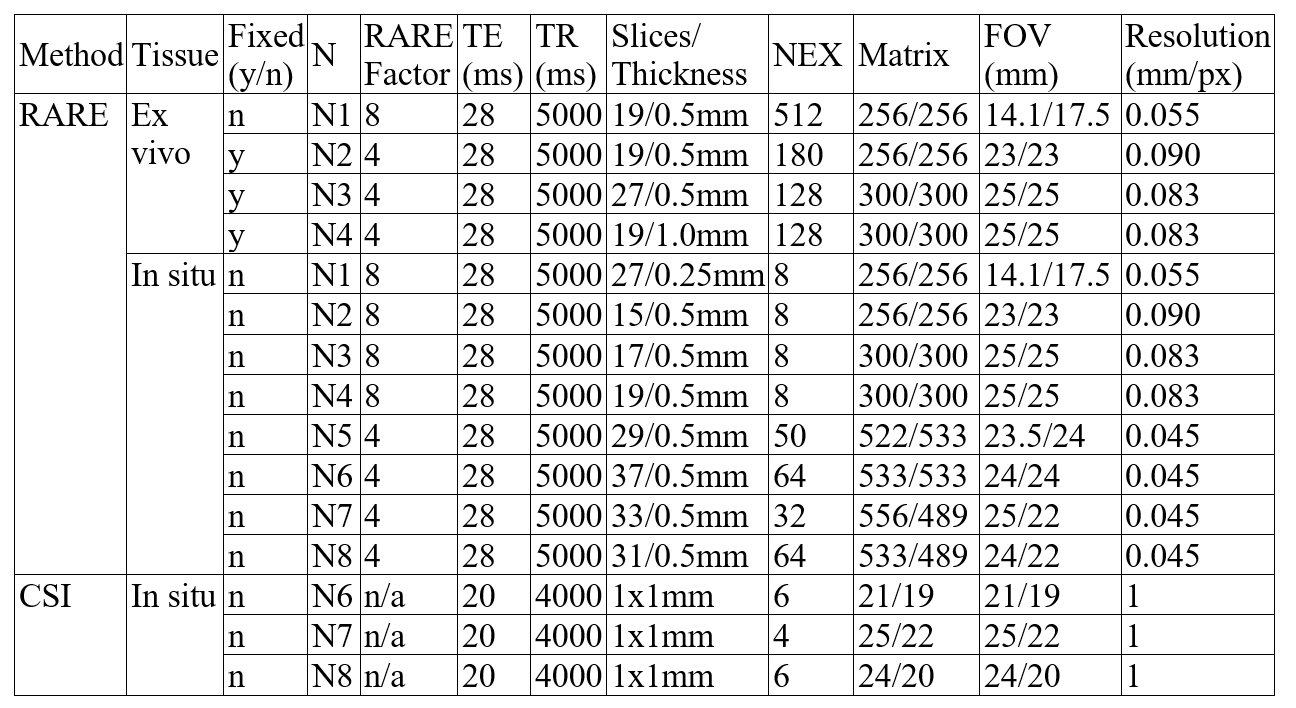
Seven mice (aged 35-55 days) and one mature mouse (>9 months, for reference) from strains with no associated testicular dysfunction were sacrificed and scanned in situ in a 9.4T Bruker MR scanner with a Rapid Acquisition with Relaxation Enhancement (RARE) sequence. A subset of gonads was excised (n=4, 1 fresh and 3 fixed in 4% formalin) and scanned again using the RARE sequence. Additionally, a Chemical Shift Imaging (CSI) scan was acquired on three mice to spatially localize spectroscopy peaks in testicular tissues. Scan details are listed in Table 1. Animals and fresh ex vivo tissues were scanned within 24 hours and fixed tissues within one week of sacrifice. Seminiferous tubule diameter was measured manually using Paravision v5.1 (Bruker Biospin). Custom MatLab image analysis scripts were created for the segmentation of seminiferous tubules and calculation of tissue volumes, and used in the mature reference animal (N1) and three younger animals (N2-4).Results
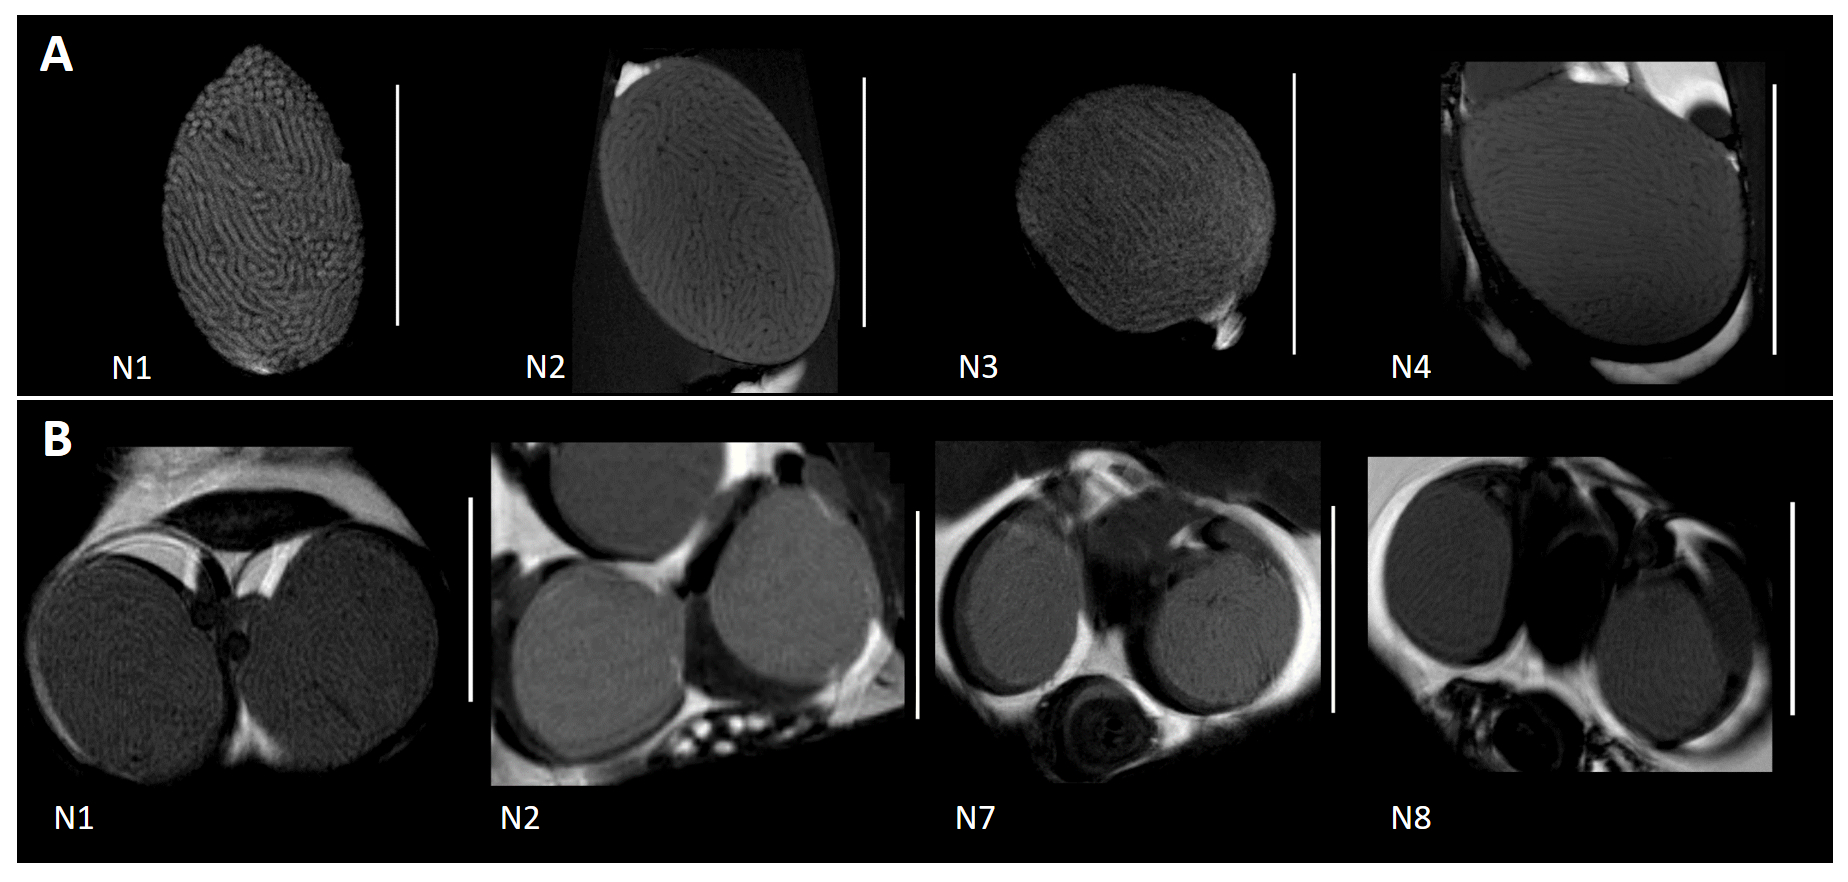
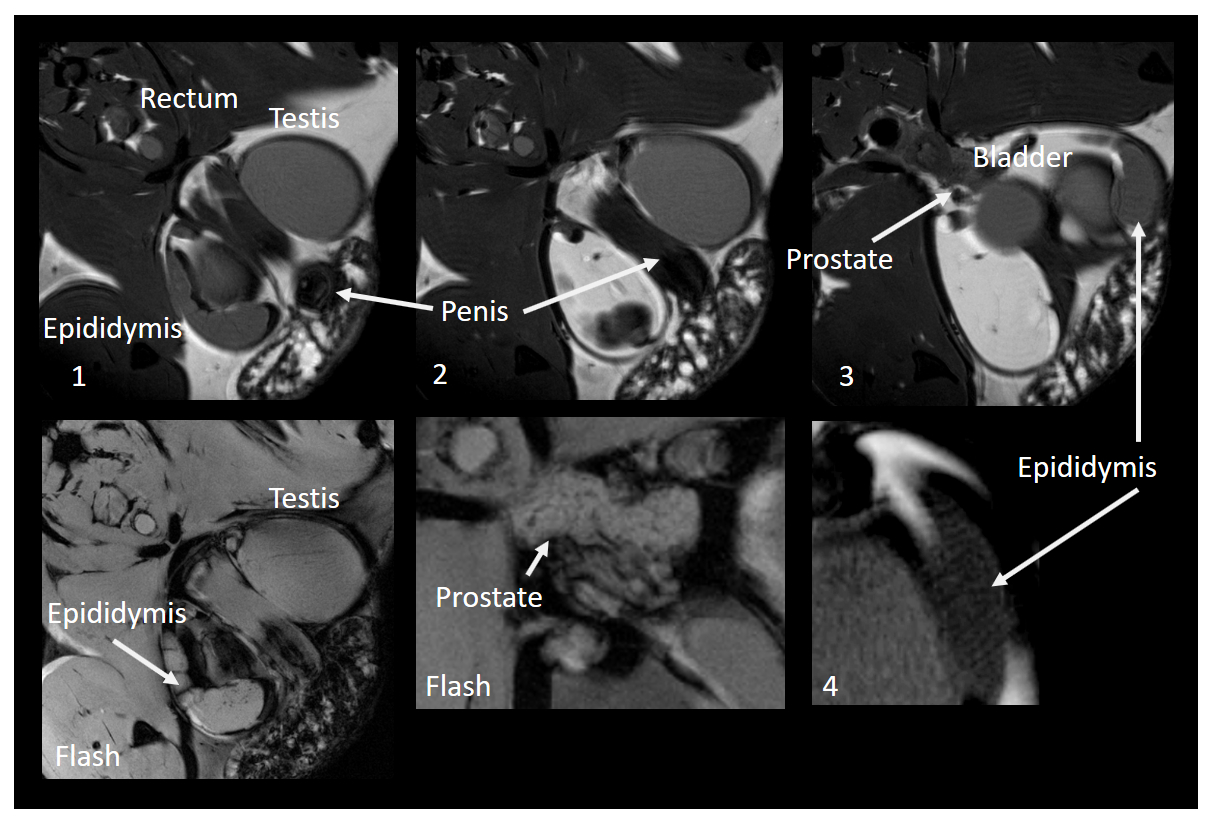
All animals yielded usable ex vivo and in situ images of gonads and exhibited clear outlines of seminiferous tubules (Fig 2). Mean±SD ratio (seminiferous tubules volume to total volume) was 0.91±0.01 for ex vivo and 0.91±0.01 for in situ measurements, and were similar in mature and younger mice. Mean±SD volumes were: total testis 62.0±15.9µl ex vivo, n=4, 68.6±5.2µl in situ, n=4 (24% and 15% larger in the mature reference (N1), respectively); seminiferous tubules 56.2±14.0µl ex vivo, 62.1±4.7µl in situ (21% and 15% larger in N1, respectively). One animal (N3) showed lower volumes (but no change in volume ratio) ex vivo due to compressed tissues in the sample tube. Median width of seminiferous tubules increased with age (153.4+/-5.2µm (35-40 day olds), 180.0±18.4µm (41-55 day olds), 180.2µm (>9 months old). CSI scans showed differentiation in signal between testes and epididymis, but yielded no further metabolite information. Extra-testicular tissues were observed in situ and included the epididymis and prostate gland (Fig 4).Discussion
In this study we show that high-field MRI can be used in a mouse model to assess testicular structure in situ. This was feasible in early stages of sexual maturation as well as in the mature animal. Volumetric measurements compared favorably with histological data from the literature (e.g.4,5) and organ size increased predictably with age. No difference was observed in volume to tube ratio, and all animals (excepting N3) showed highly comparable ex vivo and in situ volumes. This suggest that our analysis approach is robust, however further work in a wider range of age groups is required to optimize tissue segmentation and validate our method for use in e.g. developmental studies. In addition to seminiferous tubules, we also obtained clear structural images of the epididymis, in which sperm maturation and development of motility potential occurs. Despite the lack of useful metabolic information from the sacrificed animals, the epididymis exhibited a different CSI signal profile to testes in situ. The potential to assess tissues associated with sperm maturation as well as spermatogenesis in situ further emphasizes how MRI/MRS could be a useful technique in mouse models of fertility. In particular, MR may be valuable in longitudinal studies of reproductive tract development or damage over time2, offering structural (and possibly also metabolic) information without the need for invasive procedures. This type of measurement could also be extended to human fertility studies in the future.Acknowledgements
We would like to thank the Biological Services Unit at the University of Sheffield for their care and handling of animals in this study.References
1. Pacey AA. Sperm, human fertility and society. In Birkhead T, Hosken D & Pitnick S (eds.) Sperm biology: an evolutionary perspective. Elsevier. 2009;565–597.
2. Govero J, Esakky P, Scheaffer SM, et al. Zika virus infection damages the testes in mice. Nature. 2016;doi:10.1038/nature20556
3. Cooke HJ and Saunders PTK, Human genetics and disease: Mouse models of male infertility. Nat Rev Genet. 2002;3:790-801
4. Mehraein F and Negahdar F. Morphometric evaluation of seminiferous tubules in aged mice testes after melatonin administration. Cell J (Yakhteh). 2011;13(1):1-4.
5. O’Shaughnessy PJ, Monteiro A and Abel M. Testicular development in mice lacking receptors for follicle stimulating hormone and androgen. PLoS ONE. 2012;7(4):e35136.
Figures