4845
A novel portable perfusion phantom for quantitative DCE-MRI of the abdomen1University of Alabama at Birmingham, Birmingham, AL, United States
Synopsis
We developed a perfusion phantom that reduced variability in quantifying perfusion parameters of human abdominal tissues across different MR units. The phantom is compact enough to be imaged with the human subject and large enough to not suffer from partial volume effect, thus MR system calibration can be implemented simultaneously with patient imaging. Since it is composed of inexpensive materials, the phantom can be constructed as a disposable device. It is simple to use, so clinical MRI technologists should be able to operate it routinely. This phantom has the potential to facilitate multi-institutional clinical trials employing quantitative DCE-MRI to evaluate various abdominal malignancies.
Purpose: Dynamic contrast-enhanced magnetic resonance imaging (DCE-MRI) is a noninvasive method for tissue perfusion assessment, but variability in quantifying perfusion parameters across different MR units and between image acquisitions on the same unit remains a serious concern. Static phantoms comprised of multiple objects with different contrast concentrations may correct for the variability, but it has been questionable whether static phantoms can be reliable standards for dynamically changing contrast concentration in tissues. Thus we developed a portable perfusion phantom to be imaged simultaneously with each patient undergoing DCE-MRI. The study purpose was to validate the utility of this perfusion phantom in quantitative DCE-MRI of abdomen in comparison to static phantoms.
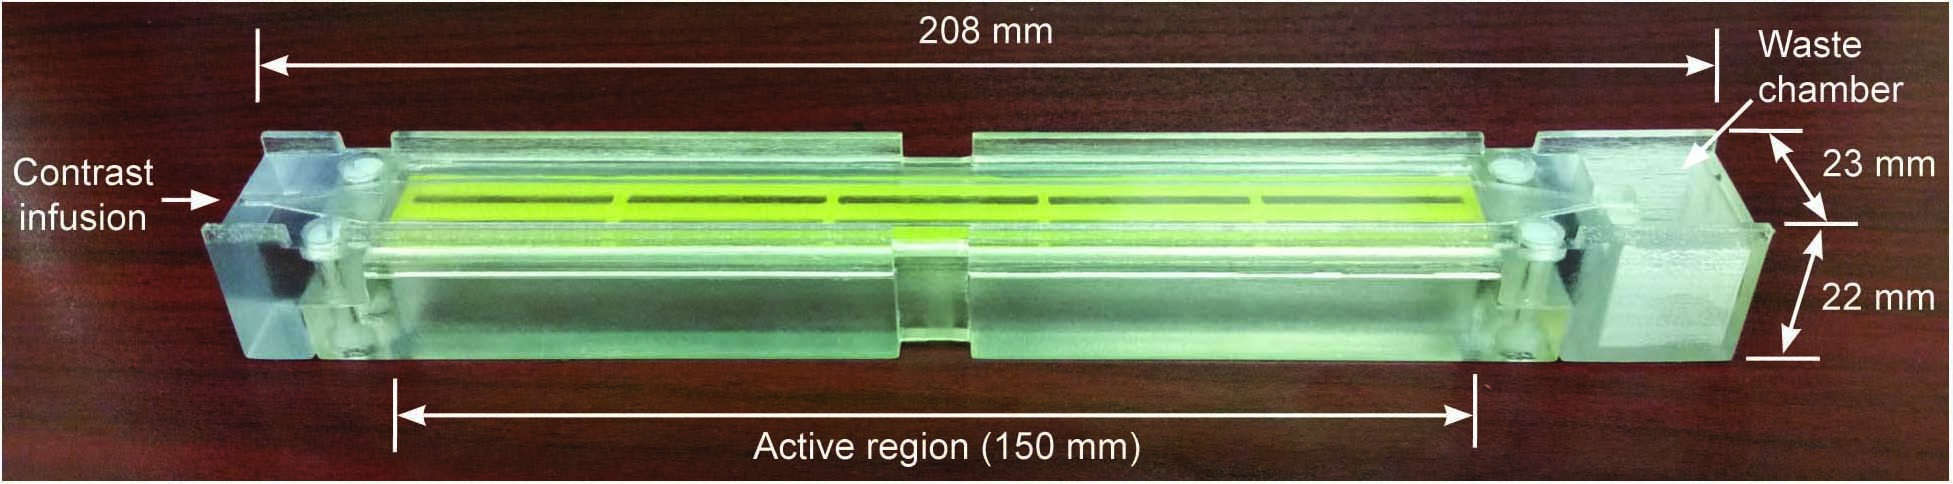
Methods: The perfusion phantom is composed of top (height×width×length = 1×10×150 mm) and bottom chambers (height×width×length = 15×10×150 mm), and a semi-permeable membrane is located between them. Both chambers are filled with deionized water before use. After starting DCE-MRI, gadoteridol (100 mM) is infused to the top chamber at a constant rate (0.06 ml/s; 3 ml), pushing the water in the top chamber out to the waste chamber. Gadoteridol is diffused to the bottom chamber through the semi-permeable membrane over time, and the change of contrast concentration averaged in the bottom chamber region is measured. We made a phantom package including three perfusion phantoms and six static phantoms with different contrast concentrations (0~5 mM). Three healthy volunteers were recruited, and each volunteer was imaged with the phantom package simultaneously in two different 3T MR scanners (GE Signa = Scanner-A; SIEMENS Prisma = Scanner-B) within a one-week period. Prior to imaging, RF shimming and B1 mapping were conducted using vendor’s software. T1 maps were obtained using a multi flip angle approach (2°, 5° and 10°) (1). DCE-MRI utilized a 3D fast spoiled gradient echo sequence (FSPGR) with the following parameters: TR/TE = 5/2 ms, FOV = 400×360 mm, NEX = 1, thickness/gap = 5/0 mm, frequency/phase encoding = 192/173, SENSE factor = 2, slice number = 10, flip angles = 10°, and temporal resolution = 2.4 sec. A look-up table correlating the measured contrast concentration with the known contrast concentration was created at each human imaging event using both static and perfusion phantoms. Expiration-phase B-spline method (ExBSpline) was used for image co-registration (2). An image slice showing four organs (liver, spleen, pancreas, and paravertebral muscle) was selected, and Ktrans maps were generated before and after data correction using the look-up tables. Ktrans values averaged in the four organ regions of three volunteers (n=12) obtained from Scanner-A were compared with those from Scanner-B, and the intra-class correlation coefficient (ICC) was calculated.
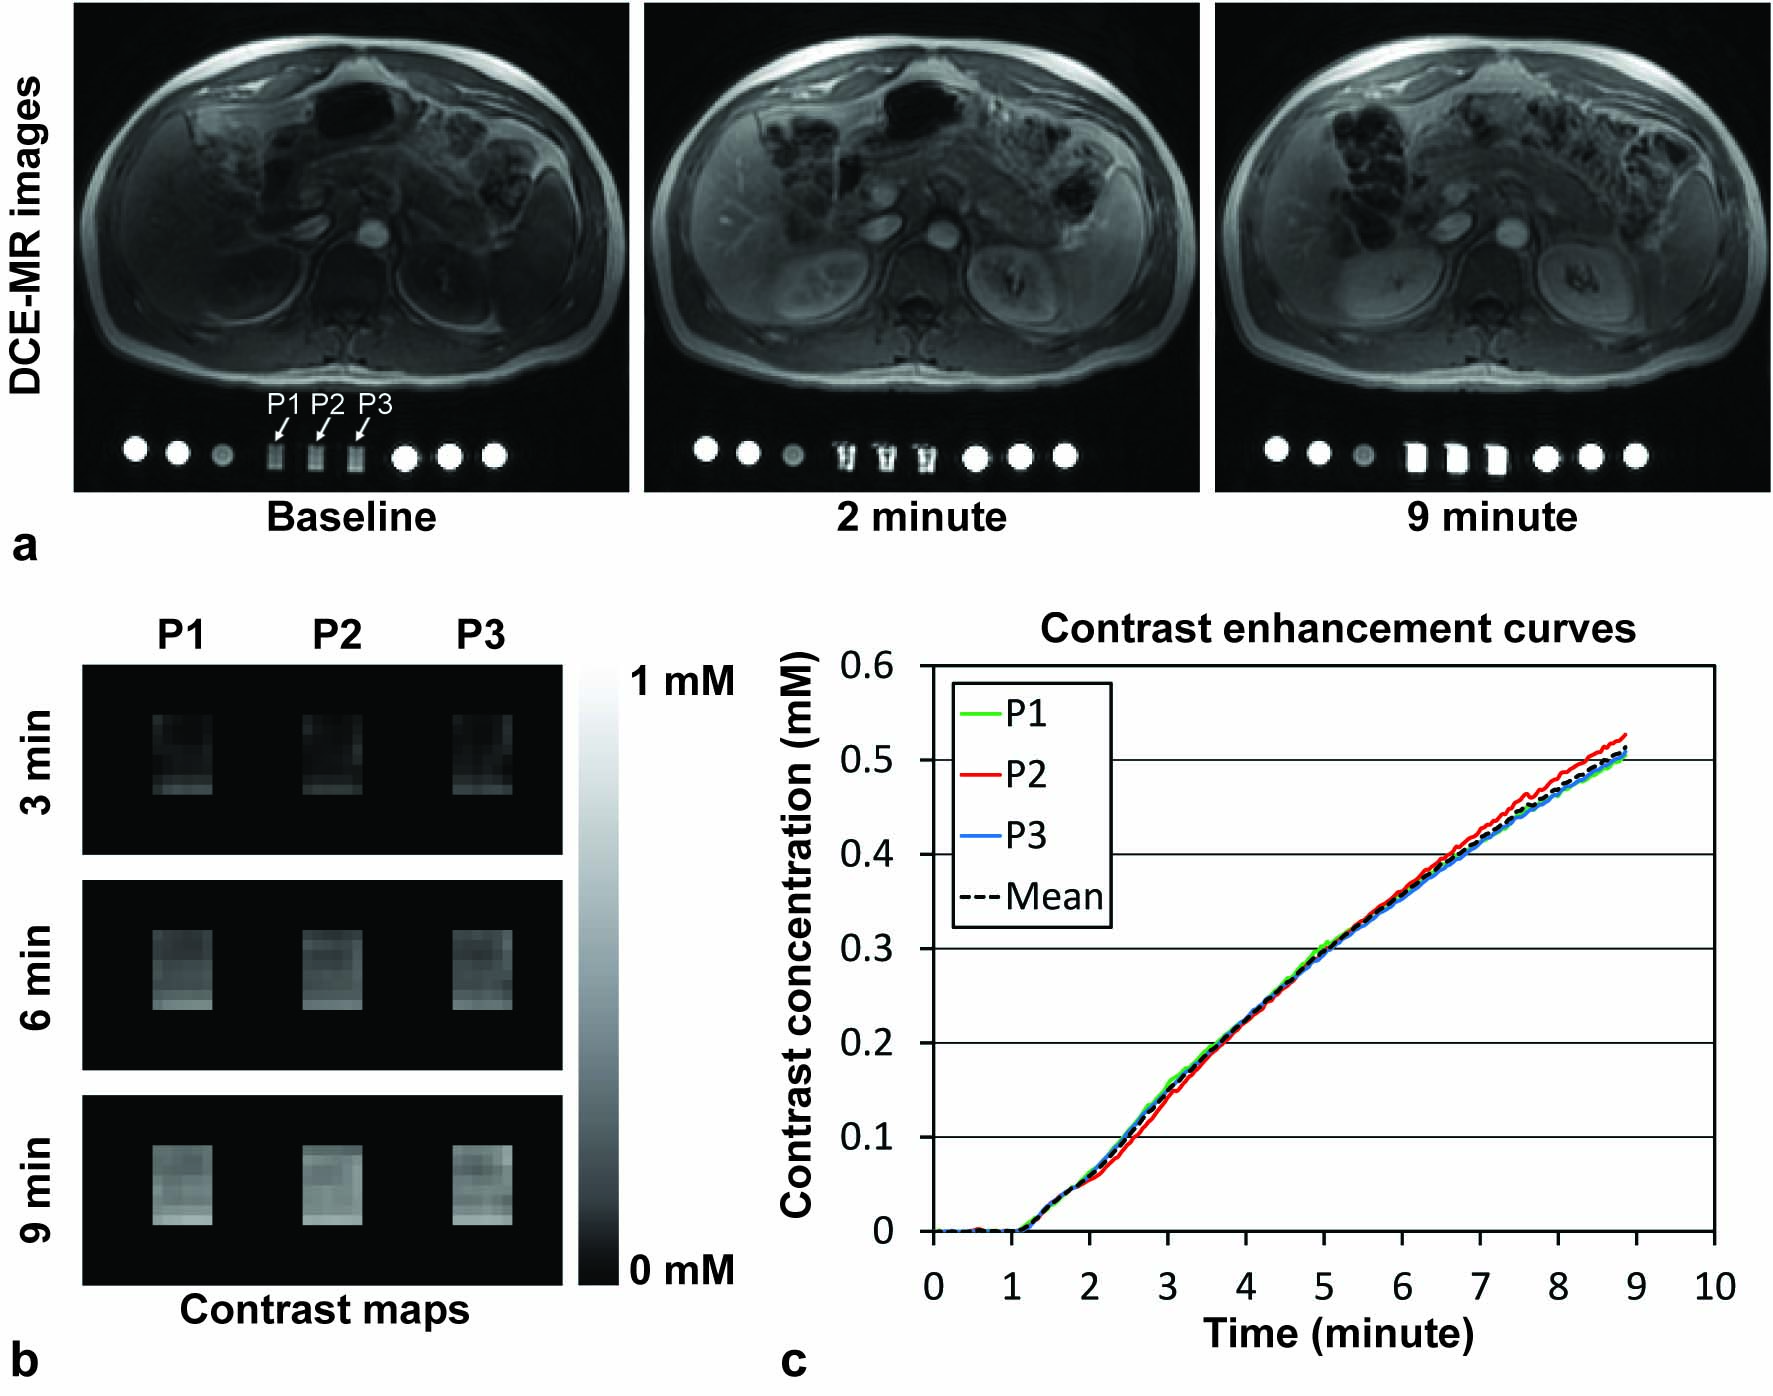
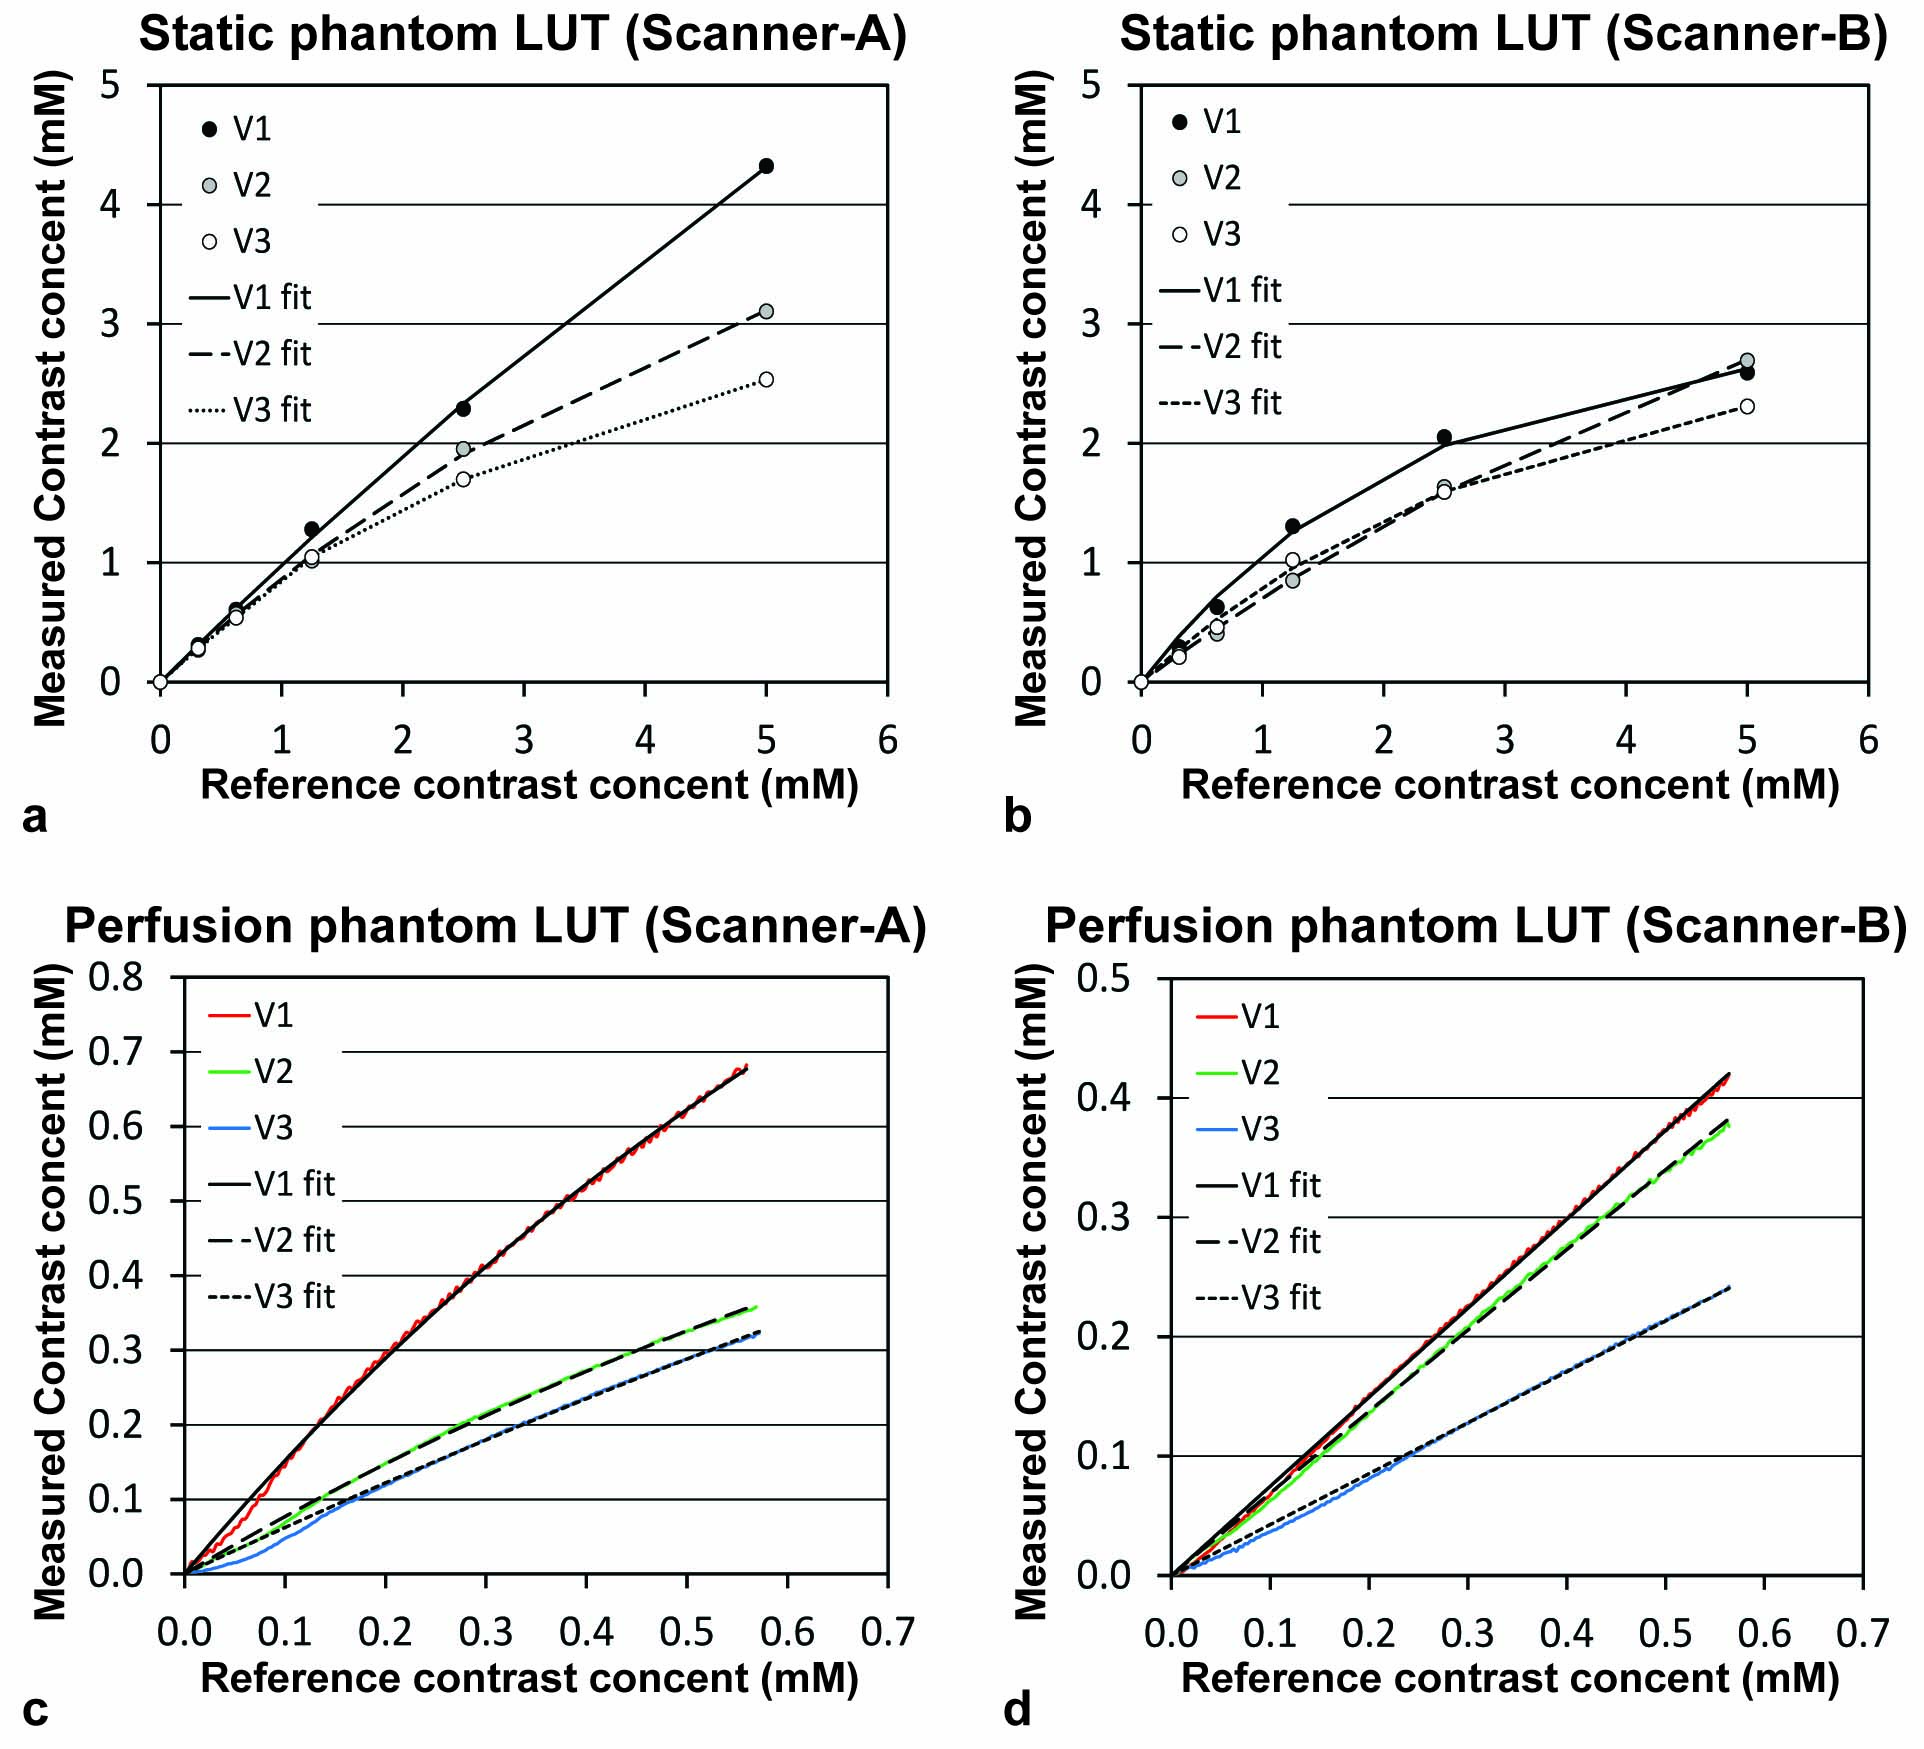
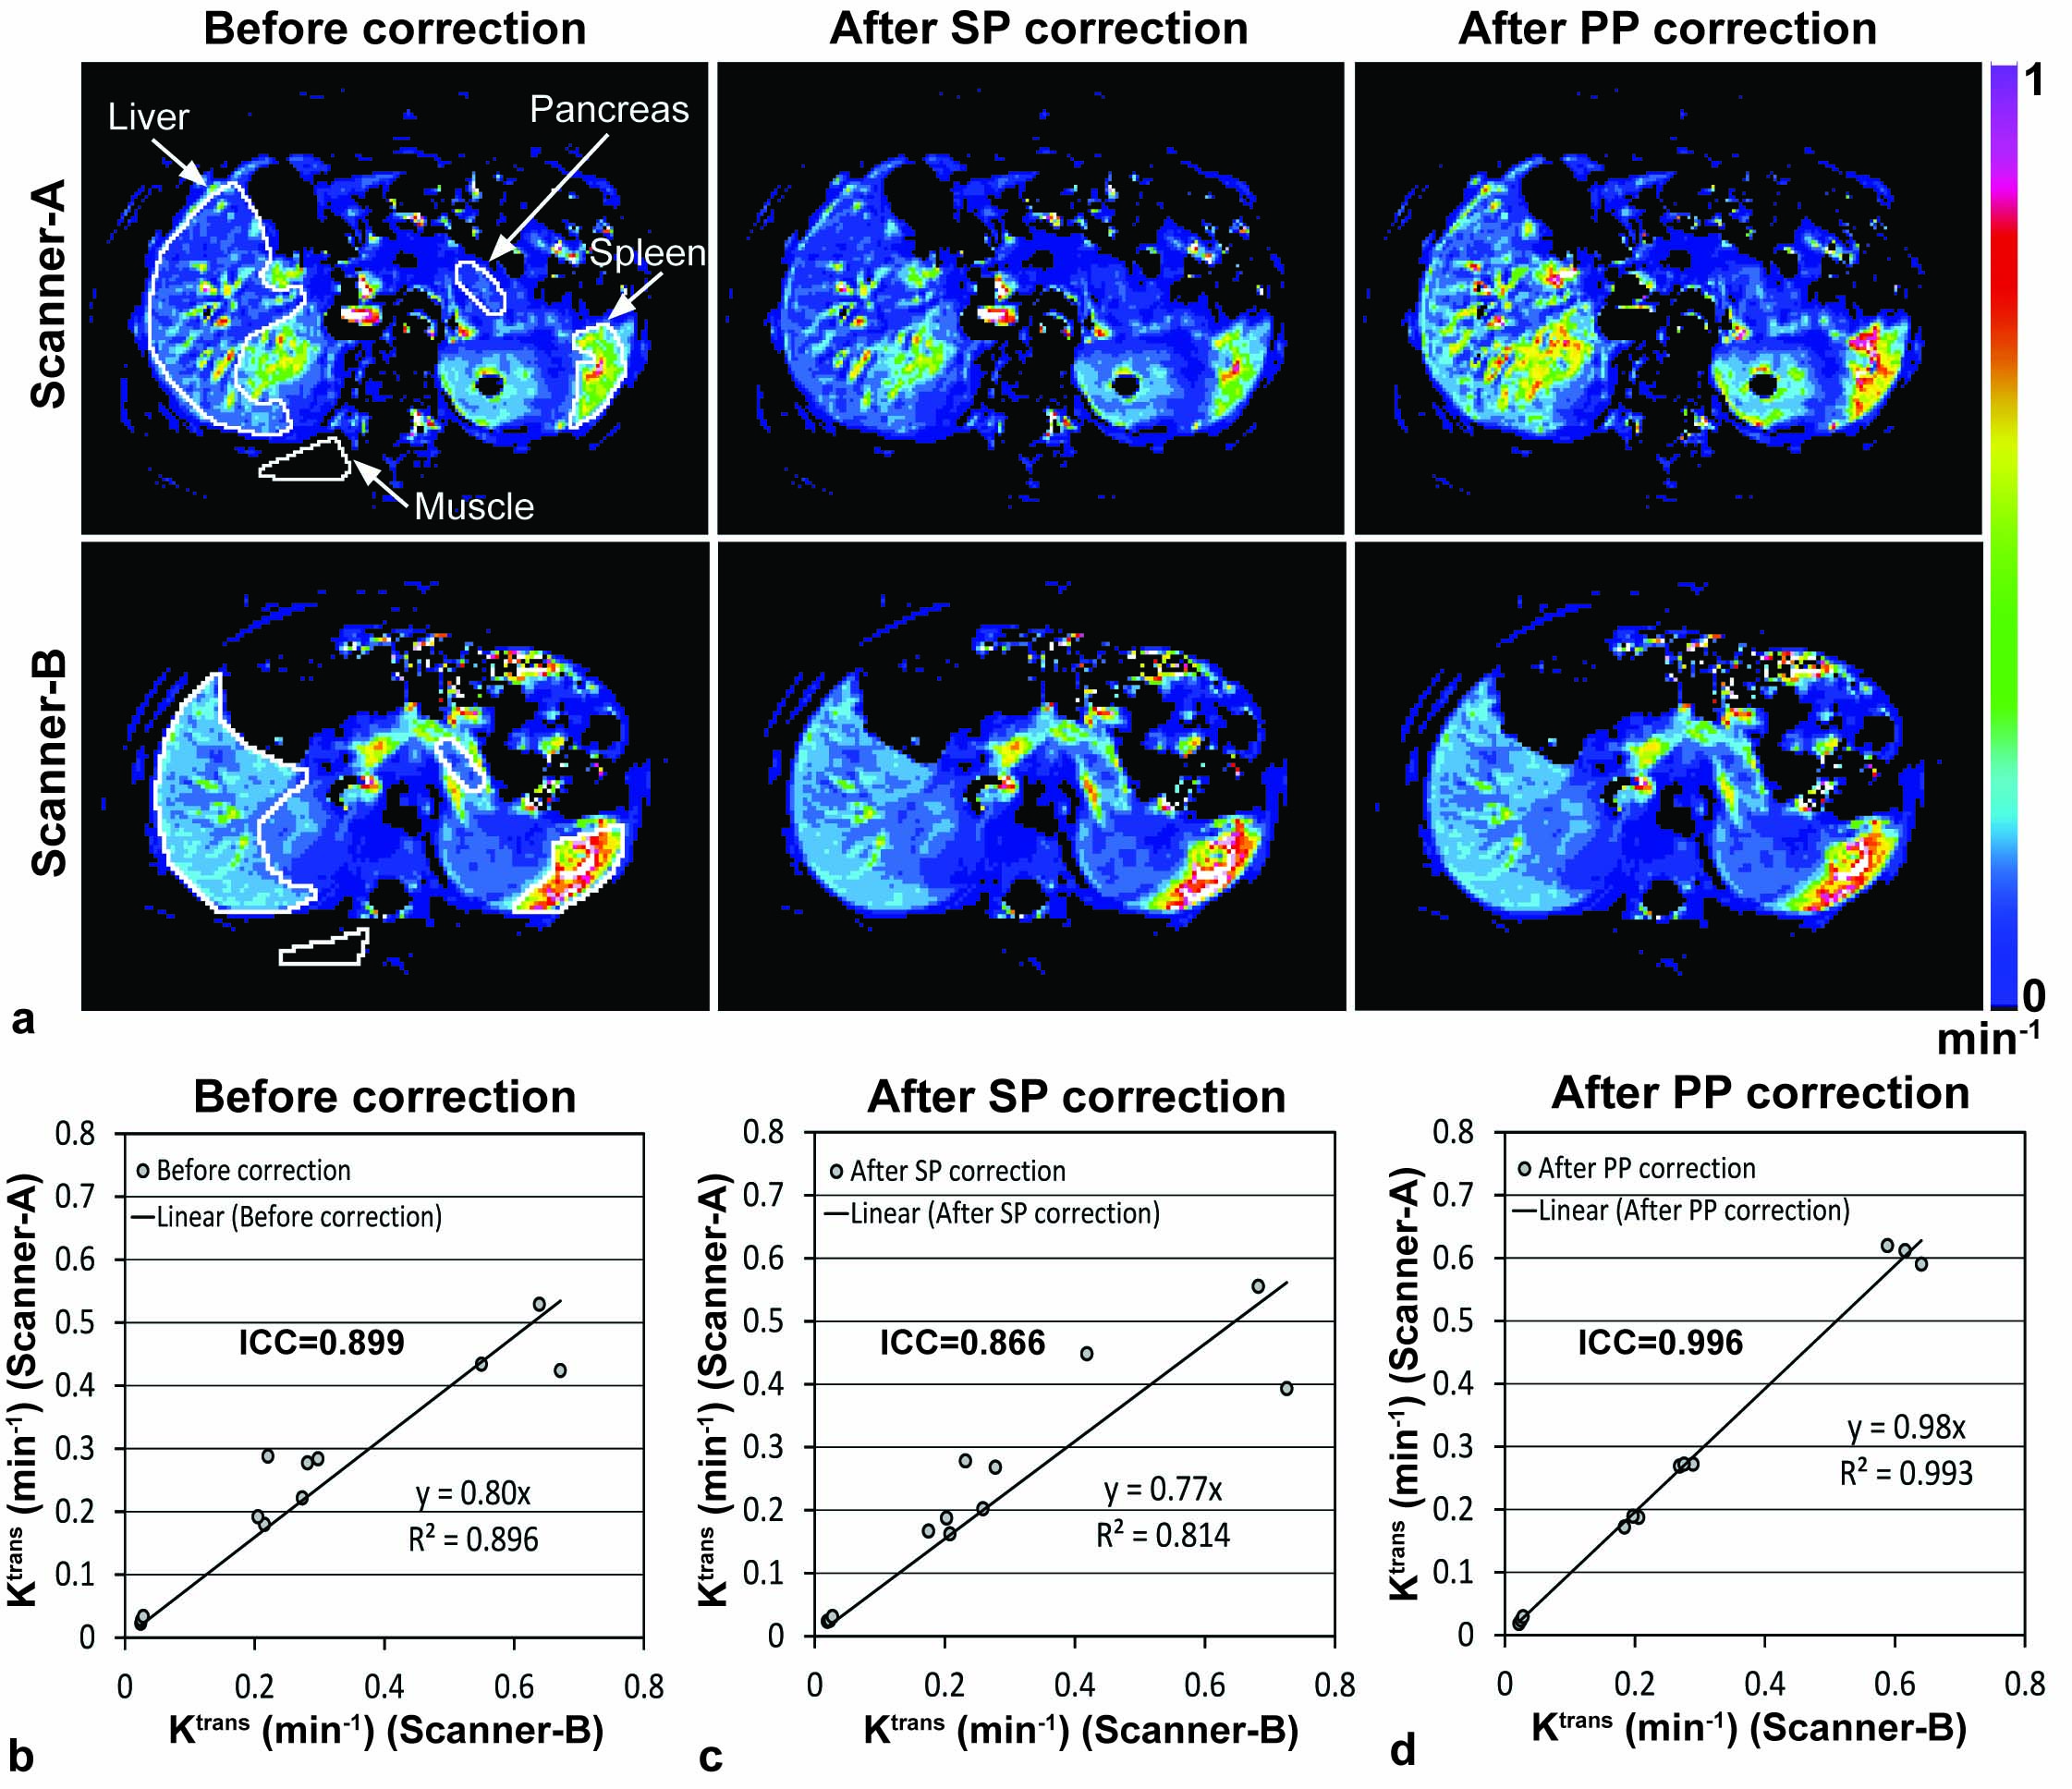
Results: Figure 1 shows a photograph of a perfusion phantom with dimensions. Figure 2a shows the representative DCE-MR images of the phantom package located under a volunteer before (baseline) and at 2 and 9 minutes after contrast infusion. Three perfusion phantoms are indicated with white arrows. Figure 2b shows the contrast maps in the ROIs of three perfusion phantoms (P1, P2, and P3) at 3, 6, and 9 minutes after contrast infusion when the same gray scale (0~1 mM) was applied. Figure 2c shows the CECs of three perfusion phantoms and the average. Figure 3 shows the graphical representation of look-up tables of the (a, b) static phantoms and (c, d) perfusion phantoms to correlate the reference (known) contrast concentration with the measured ones by either (a, c) Scanner-A or (b, d) Scanner-B. Figure 4a shows the Ktrans maps of a volunteer before and after data correction using the look-up tables of static phantoms (SP) or perfusion phantoms (PP). Figures 4b-4d show the correlation of Ktrans values averaged in the four organs of three volunteers (n=12) obtained from either Scanner-A (Y-axis) or Scanner-B (X-axis) before and after data correction using SP or PP look-up tables. ICC was 0.899 before correction, but increased to 0.996 after correction using PP look-up tables. ICC was, however, not increased after correction using SP look-up tables.
Discussion: We developed a perfusion phantom that reduced variability in quantifying perfusion parameters of human abdominal tissues across different MR units. The phantom is compact enough to be imaged with human subject and large enough to not suffer from partial volume effect, thus MR system calibration can be implemented simultaneously with patient imaging. Since it is composed of inexpensive materials, the phantom can be constructed as a disposable device. It is simple to use, so incorporation into routine clinical operations is possible. This phantom has the potential to facilitate multi-institutional clinical trials employing quantitative DCE-MRI to evaluate various abdominal malignancies.
Acknowledgements
Authors thank Drs. Kurt R. Zinn, Janet F. Eary, and Wlad Sobol for study advice, Mr. Lael Gore and Ms. Heather Edmonds for MRI protocol development, and Ms. April Riddle for human subject recruitment and imaging assistance. Authors also thank Dr. Daniel Barboriak (Duke University) to provide the digital reference objects and Dr. Geoffrey Parker (University of Manchester) to provide the population-based arterial input function.References
1. Kim H, Samuel S, Totenhagen JW, Warren M, Sellers JC, Buchsbaum DJ. Dynamic contrast enhanced magnetic resonance imaging of an orthotopic pancreatic cancer mouse model. Journal of visualized experiments : JoVE 2015.
2. Li Z, Tielbeek JA, Caan MW, Puylaert CA, Ziech ML, Nio CY, Stoker J, van Vliet LJ, Vos FM. Expiration-phase template-based motion correction of free-breathing abdominal dynamic contrast enhanced MRI. IEEE transactions on bio-medical engineering 2015; 62:1215-1225.
Figures