4844
Quantitative Susceptibility Mapping to Characterise Hepatic Hyperoxia in Mice1Centre for Advanced Biomedical Imaging, University College London, London, United Kingdom, 2Medical Physics and Biomedical Engineering, University College London, London, United Kingdom, 3Institute of Neurology, University College London, United Kingdom
Synopsis
Information gleaned from Hepatic Venous Oxygen Saturation (ShvO2) can be beneficial in the post-operative care of those who have undergone a partial hepatectomy. Previously this has been performed invasively. We hypothesise that Quantitative Susceptibility Mapping (QSM) can do so non-invasively. The ShvO2 of a healthy cohort of mice was manipulated with a hyperoxic gas challenge. Susceptibility was measured under normoxic and hyperoxic conditions, and ShvO2 was calculated from the measurements. Significant differences were measured in susceptibility and ShvO2 in response to the gas challenge. We conclude that QSM can non-invasively measure changes in ShvO2 in the pre-clinical liver in-vivo.
Introduction
Partial hepatectomy has increasingly become a more viable treatment option in cases of malignant and benign hepatic lesions due to improvements in diagnostic radiology, patient selection and operative technique[1]. The ability to assess changes in the oxygen metabolism of the liver may have important implications for the postoperative care of those who have undergone the procedure[2]. Hepatic Venous Oxygen Saturation (ShvO2) is an indicator of hepatic oxygen supply-demand ratio[3], and has been the focus of studies that have sought to predict the occurrence and severity of postoperative liver dysfunction[4], or assess the regenerative status of the remnant portion[2]. Previously, ShvO2 has been measured invasively by means of catheterisation, which increases the risk of infection and may not be suitable for all patients. Quantitative Susceptibility Mapping (QSM) MRI has been used to non-invasively assess hyperoxic effects on venous oxygen saturation in the brain[5,6]. This study aimed to investigate whether QSM can be used to non-invasively assess ShvO2. To do this we performed a pre-clinical study, wherein a hyperoxic gas challenge was administered to a cohort of healthy mice in order to manipulate ShvO2 in a controlled fashion. Susceptibility maps were calculated over the entire liver of each animal under both normoxic and hyperoxic conditions, and susceptibility was measured in a large branch of the hepatic vein in each case. Susceptibility measurements were then used to calculate the change in ShvO2 in response to the gas challenge.Methods
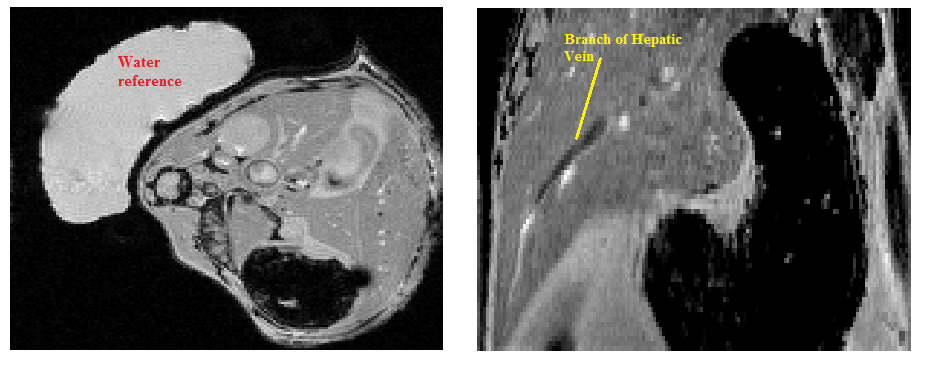
Data were acquired in eight healthy CD1 mice (8 – 12 weeks) under normoxic and hyperoxic conditions. Respiratory rate was monitored using a pressure pad (SA instruments, Stony Brook, NY USA) and maintained at ~40 - 80 breaths p/m by varying isoflurane concentration between 1.5 and 3%. Rectal temperature was maintained at 37.5 ± 0.5oC using a warm water circulation system. Fully flow-compensated, respiratory-gated, single-echo (TE/TR = 1000/4 ms) 2D T2*-weighted GRE data (200µm isotropic resolution, 8 averages, 70o FA) were acquired on a Varian 9.4T scanner using a 39-mm birdcage coil (RAPID Biomed,Rimpar, Germany). Gases were administered through a nose cone at a rate of 0.5 ltr/min. Normoxia was induced with medical air (21% O2/balance Nitrogen) followed by hyperoxia (100% O2). 10 minutes were allowed after changing gases such that the animal could acclimatise before imaging. A sample of distilled water accompanied each subject in the scanner to act as a reference for the susceptibility measurements. During post-processing, a region of interest (ROI) was manually drawn around the entire liver in each magnitude image using ITK-SNAP[7]. Corresponding phase data were unwrapped and the background field suppressed using a SHARP algorithm (TSVD threshold =0.08, mask eroded 2-3 voxels)[8]. Susceptibility maps were calculated using a TKD algorithm (threshold =0.2)[9]. ROIs were manually segmented on magnitude images, then transferred to the susceptibility maps (fig 1). The change in venous oxygen saturation was calculated as such:
ΔShvO2 = 100% * ((Δχvein(normoxia) - Δχvein(hyperoxia)) / (Hct * Δχdo))
where Δχvein is the susceptibility shift between the ROI and the water reference, Δχdo = 3.392 ppm(SI) is the difference in susceptibility between fully oxygenated and fully deoxygenated blood[10], and Hct (taken to be 0.4) is the haematocrit, i.e. the fraction of blood composed of haemoglobin[6]. A Wilcoxon matched-pairs signed rank test was carried out to assess the significance of the changes in measured values.
Results
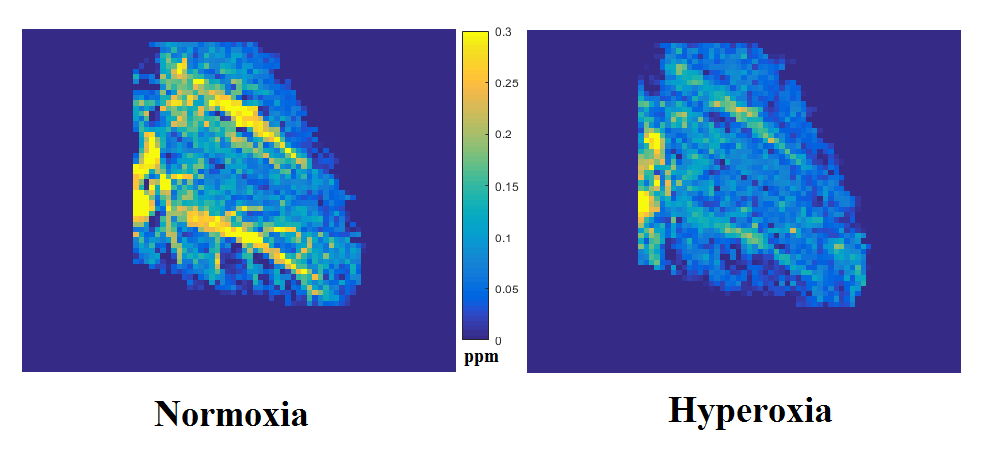
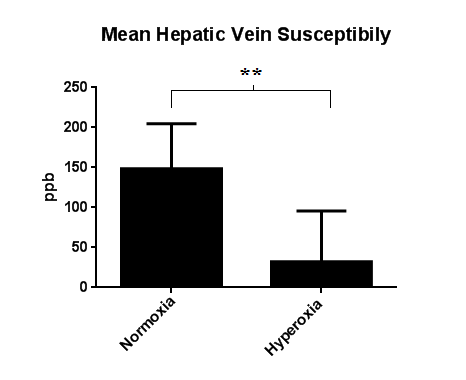
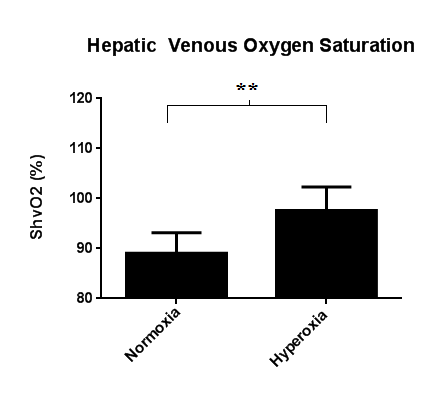
The hepatic vein is more hypointense on the susceptibility map under hyperoxia than under normoxia(fig 2). This indicates that the blood is more diamagnetic due to a lower concentration of deoxyhaemoglobin. Mean susceptibility measured in the hepatic vein was 148.63 ± 56.22 ppb under normoxia and 32.23 ± 63.45 ppb under hyperoxia, resulting in a significant decrease of -116.4 ppb (p<0.01) (fig 3). This equates to a significant increase in mean ShvO2 of 8.58 ± 4.76% (p<0.01), from 89.04 ± 4.14% to 97.62 ± 4.68% (fig 4)Discussion & Conclusion
Our results show that it is possible to measure changes in susceptibility in the hepatic vein that reflect differences in deoxyhaemoglobin concentration in response to a hyperoxic challenge. The magnitude of the changes in both susceptibility and ShvO2 are of the same order as those in similar experiments[5,6]. The mean susceptibility values measured here are lower than those observed in the cerebral veins in similar studies[5], and would in turn lead to an overestimation of ShvO2. However, susceptibility values in the literature are quoted with respect to reference tissues rather than an external water reference, making direct comparison difficult. Further methodological improvements will be explored in order to investigate whether processing factors may have introduced systematic errors into the results.Acknowledgements
No acknowledgement found.References
[1] Dimick J, J Am Coll Surg 2004 199(1): 31-8
[2] Yoshioka S, Hepatology 1997 27(5): 1349-53
[3] Katsuramaki T, J Hep Bil Pacr Surg 1997 4: 351-5
[4] Takano H, J Thor Cardiovasc Surg 1994 108 (4): 700-8
[5] Ozbay P, NMR Biomed 2015 28: 1688-96
[6] Hsieh M, MRM 2016 00: 00-00
[7] Yuskevich P, Neuroimage 2006 31:1116-28
[8] Schweser F, MRM 2013; 69:1582-94
[9] Shmueli K, MRM 2009; 62:1510-22
[10] Jain V, Magn Reson Med 2012 68(3): 863-7
Figures