4837
Automated scan prescription for an oblique plane through the aortic arch for bolus tracking in DCE-MRI1MR Engineering, GE Healthcare, Hino-shi, Japan
Synopsis
Accurate placement of a 2D plane across the aorta arch while examining scout images is a complex task that makes the operator’s workflow difficult when bolus tracking in DCE-MRI. We present a novel method for automated scan prescription for an oblique plane delineating the entire aortic arch used to monitor bolus arrival. The oblique plane was prescribed automatically by selecting the optimal oblique angle using regression forests. A dataset with 31 volunteers was tested, and all cases depicted the cross section of the aortic arch clearly. This automation will assist the operator and decrease the total examination time.
PURPOSE
In bolus tracking, the operator prescribes an oblique plane through the aorta. This prescription is a complex process, and its accuracy is highly dependent on operator skill. Previously, we proposed an aorta detection method (ADM)1, which automated oblique plane positioning through the abdominal aorta. Since the aortic arch is also often used to detect bolus arrival, we propose an automated method for prescribing a 2D oblique plane through the aortic arch, thereby allowing us to offer a suite of workflow automation techniques for abdominal bolus tracking.METHODS
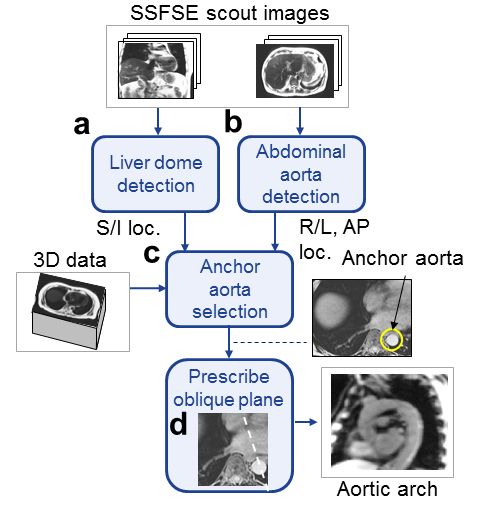
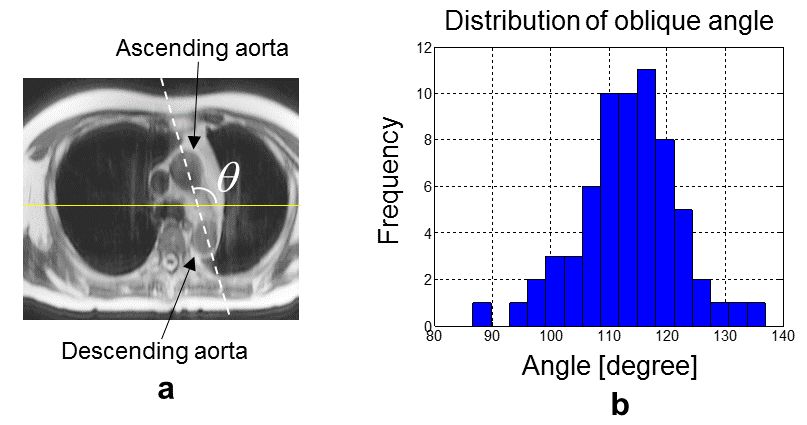
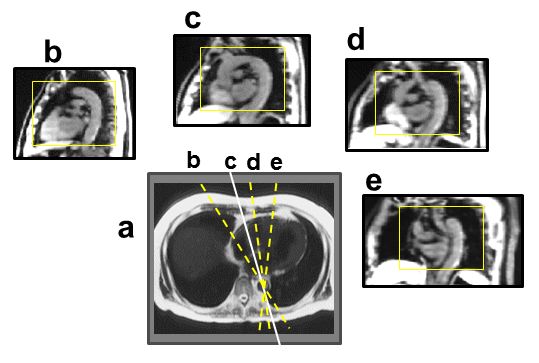
2D SSFSE scout images were analyzed so as to not prolong the total examination time. Since the aortic arch is close to the heart, it is susceptible to motion effects due to heartbeats, resulting in flow artifacts around the aorta. Furthermore, multiple vessels often cause false positives. Therefore, we adopted a different approach from the ADM. Fig. 1 shows the algorithm flow. First, the location of the liver dome peak in the superior/inferior (S/I) direction is detected by an automated navigator tracker2 (Fig. 1a) and the location of the abdominal aorta in the right/left (R/L) and anterior/posterior (A/P) directions are detected by the ADM (Fig. 1b). This permits the selection of an axial plane containing both the aorta and the liver dome peak from a 3D abdominal dataset. In addition to the axial plane, a reference point called the “anchor aorta” is detected from the 3D abdominal dataset (Fig. 1c). Using the selected axial plane and anchor aorta as inputs, an oblique plane crossing through the anchor aorta is reformatted by selecting an optimal oblique angle using a machine learning technique called regression forests (RF) 3 (Fig. 1d). Fig. 2a shows the definition of the oblique angle in the axial plane. Our training dataset was comprised of 31 volunteers whose optimal oblique angles were evaluated by two trained experts, an MR application specialist and scientist, to generate the angle of ground truth (GT angle) in the oblique image. RF inputs were created as follows. Each oblique plane was reformatted from a random selection of 11 oblique angles between -30 and +30 degrees, with zero centered at the GT angle. Then, a small image patch (41×53 pixels) was cropped from the oblique plane, and its histogram of oriented gradients (HOG) feature vector was treated as an input for the RF. This yielded a total of 3641 oblique angle and HOG feature vector pairs. In the RF training step, the parameters of decision trees in the RF were trained. We used 100 trees and 10 depth parameters. A leave-one-out method was used for cross-validation. In the testing step, the oblique plane was reformatted from an angle randomly selected from the range of -30 to +30 degrees, with zero centered on the average of the GT angle, and followed by HOG feature calculation. The RF outputs the value closest to zero as the optimal angle of the oblique plane. Fig. 3 shows an example of how the contents of oblique plane images (a-d) change as the oblique angle rotates about the anchor aorta. In the case of Fig. 3, plane b is the most appropriate plane position, delineating the entire aortic arch. The oblique plane matrix size was set to 256×132, 380×270 mm field of view, and 10 mm slice thickness. Volunteer datasets were obtained with informed consent and received institutional review and approval.RESULTS
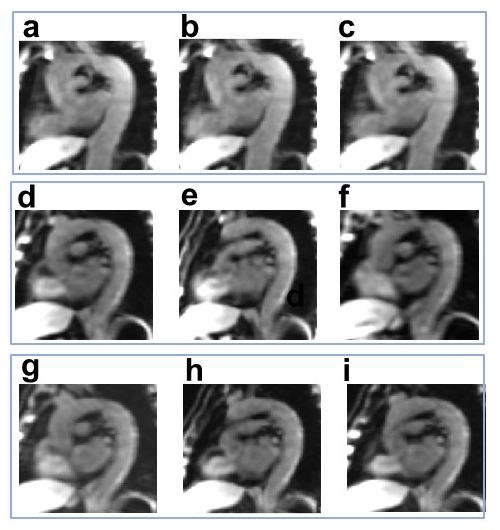
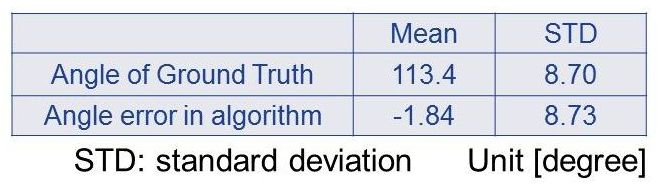
Our algorithm worked well for all 31 volunteers. The distribution of the GT angles measured from the 31 volunteers is shown in Fig. 2b. Here, the angle error is the difference between the GT angle and the angle that the algorithm outputted. The statistical values of the angle error and GT angle are given in Table 1. The average and standard deviation of the GT angle were 113.4 and 8.7 degree, respectively. Fig. 4 shows the comparison of the oblique images, GT angle (a,d,g), the average of the GT angles (b,e,h) and the algorithm results (c,f,i). The resulting oblique images from the proposed algorithm were almost the same as the GT angle images.DISCUSSION
Although it was difficult to obtain the sufficient delineation of the aortic arch by one average GT angle, our proposed method is essential to cover the wide range of possible GT angles. The results were satisfactory in healthy volunteers. However, an actual patient dataset may include cases with deformation of the aorta and other organs. Therefore, it is critical to make the algorithm robust against variations and other outlier cases.CONCLUSION
We propose a novel method for the automated prescription of oblique planes passing through the aortic arch, critical for bolus tracking. This automation will decrease operator burden and shorten the total exam time per patient.Acknowledgements
No acknowledgement found.References
[1]. Goto T. Araki M. ISMRM, 2016, Singapore, 248
[2]. Goto T. Kabasawa H. Magnetic Resonance Imaging, 2015;33:63–71
[3]. Criminisi A. et. al. In: MICCAI 2010 workshop on medical computer vision: recognition techniques and applications in medical imaging.
Figures