4835
Quantitative BOLD MRI and T1 Mapping in Acute Kidney Injury Patients: A preliminary study1School of Biomedical Engineering, Guangdong Provincial Key Laborary of Medical Image Processing, Southern Medical University, Guangzhou, People's Republic of China, 2Philips Healthcare, Guangzhou, People's Republic of China, 3Medical Imaging Center, Nanfang Hospital of Southern Medical University, Guangzhou, People's Republic of China, 4Division of Nephrology, Nanfang Hospital, Southern Medical University, Guangzhou, People's Republic of China
Synopsis
Hypoperfusion and hypoxia are thought to be important factors in the pathogenesis of AKI and in the progression from AKI to chronic kidney disease. Previous studies have demonstrated the correlation between MR relaxation time (T1 and T2*) and tissue oxygenation. The result of this preliminary study suggests BOLD and T1 mapping are potential to diagnose AKI at early stage and predict the progression of AKI non-invasively.
Purpose
Acute kidney injury (AKI) causes an estimated worldwide death toll of 2 million each year1. Hypoperfusion and hypoxia are thought to be important factors in the pathogenesis of AKI and in the progression from AKI to chronic kidney disease (CKD)2,3. There is an urgent need for non-invasive and sensitive tools to assess the oxygenation and hemodynamics of renal tissue. Previous studies have demonstrated the correlation between MR relaxation time (T1 and T2*) and tissue oxygenation4,5. The aim of our study was to evaluate blood oxygen level dependence (BOLD) and T1 mapping as potential biomarkers for the assessment of renal impairment in AKI patients.Materials and Methods
This study was approved by local Local Ethics Committee and informed consent was obtained from all patients. Six AKI patients (2 stage II , 4 stage III) confirmed by serum creatinine level6 and 10 matched healthy controls were recruited. All subjects were scanned with a clinical 3.0T scanner (Philips, Achieva TX, Best, the Netherlands). Breath-hold BOLD and T1 mapping scans were performed with following imaging parameters: BOLD TR/ΔTE/TE1 = 144/2/0.8ms, 12 echoes, flip angle = 45°; FOV = 340x250mm2, acquired matrix = 124x169, scan duration = 13ms; T1 mapping Look-Locker with 19 inversion delay time points from 78ms to 2200ms, flip angle = 7°; FOV = 320x250mm2, acquired matrix = 100x91, scan duration = 15ms.
R2* maps were generated with BOLD scan images using custom program in Matlab7, and T1 maps were generated with MRmap software V1.4. Regions-of-interest (ROIs) of cortex and medulla were manually drawn on mid-slice of quantitative maps on the left and right kidney respectively, using corresponding T1w and T2w MRI (similar slice position) as references. Difference value (D-value) of quantitative maps between cortex and medulla was also calculated.
Statistical analysis was performed using SPSS version 20.0. One-way analysis of variance was used to compare the R2* and T1 values and of cortex, medulla and D-value in different groups, followed by LSD method to further determine the statistical differences across groups. We used Dunnett’s T3 method in case of heterogeneity of variance. The statistically significant difference was set at p < 0.05.
Results
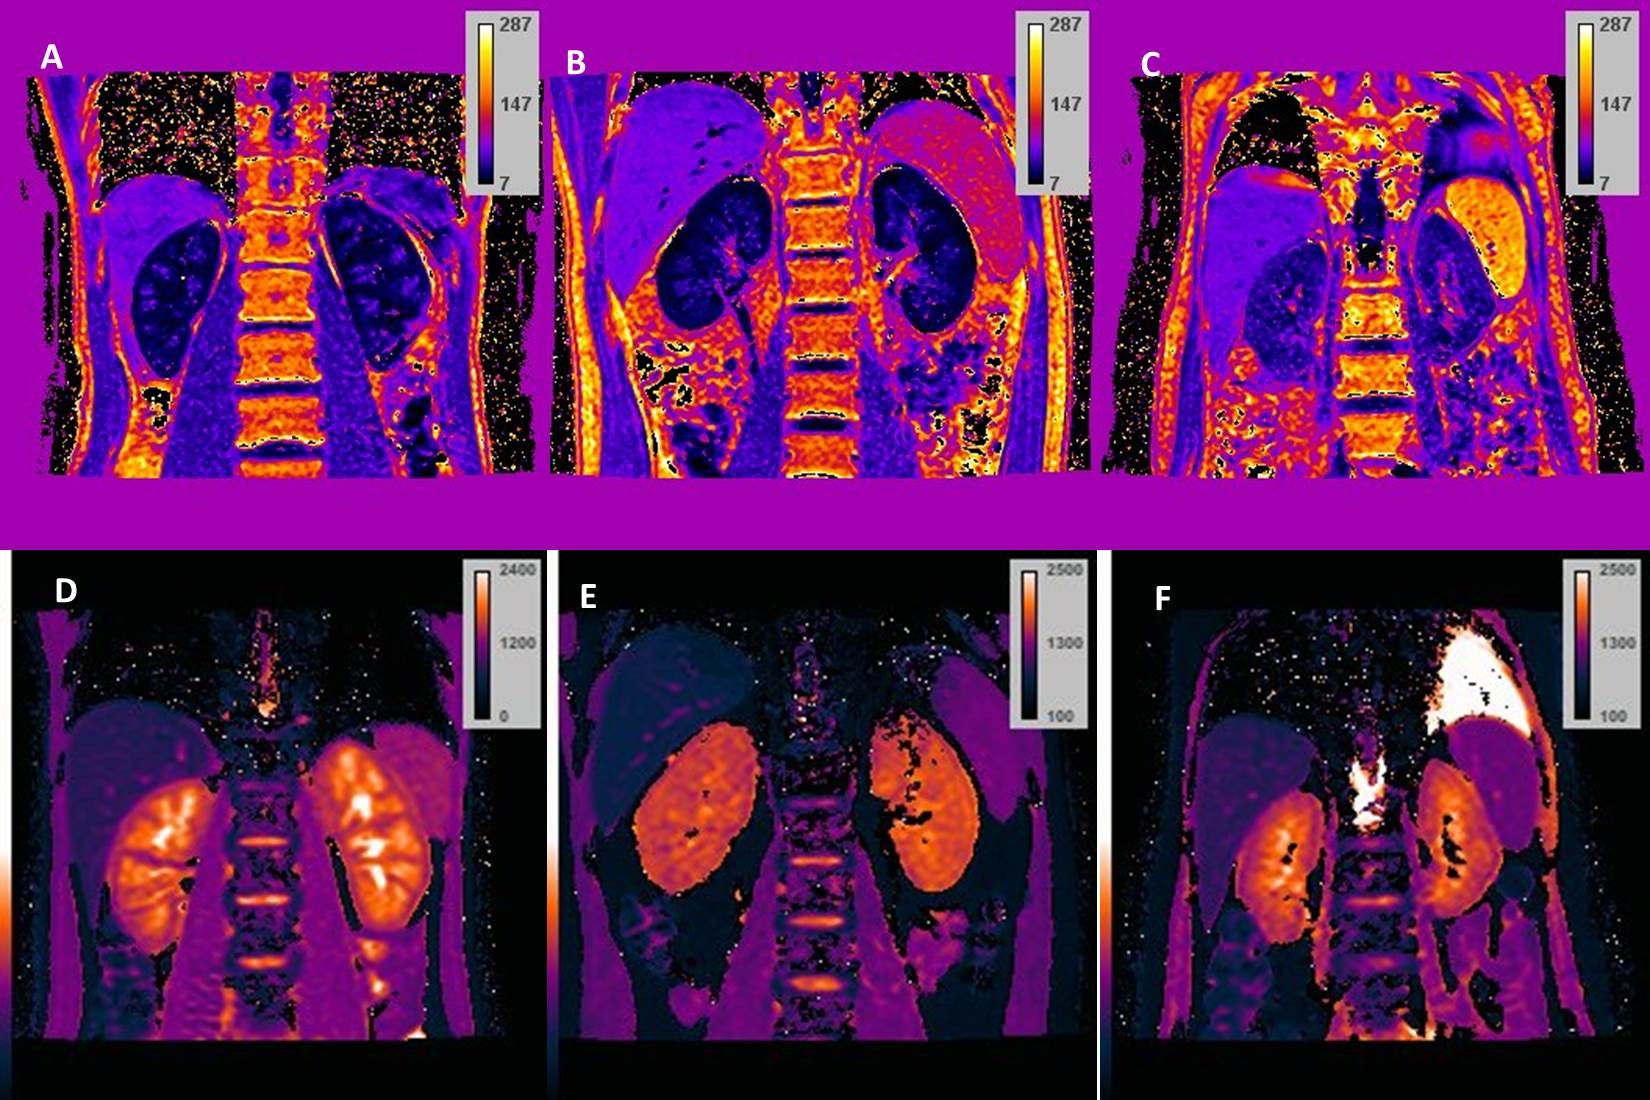
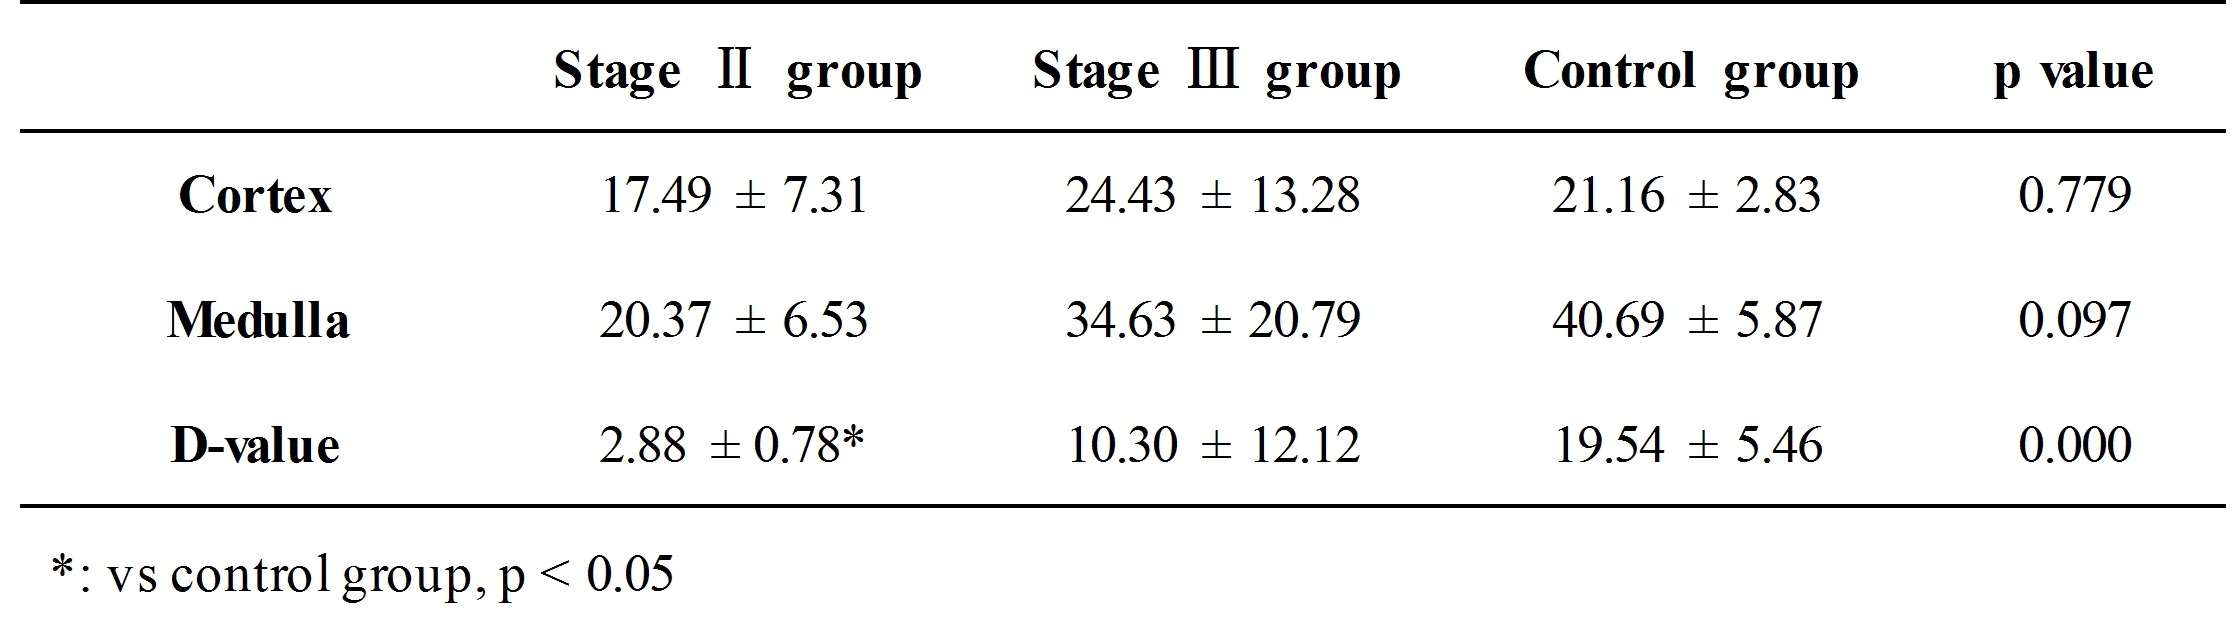
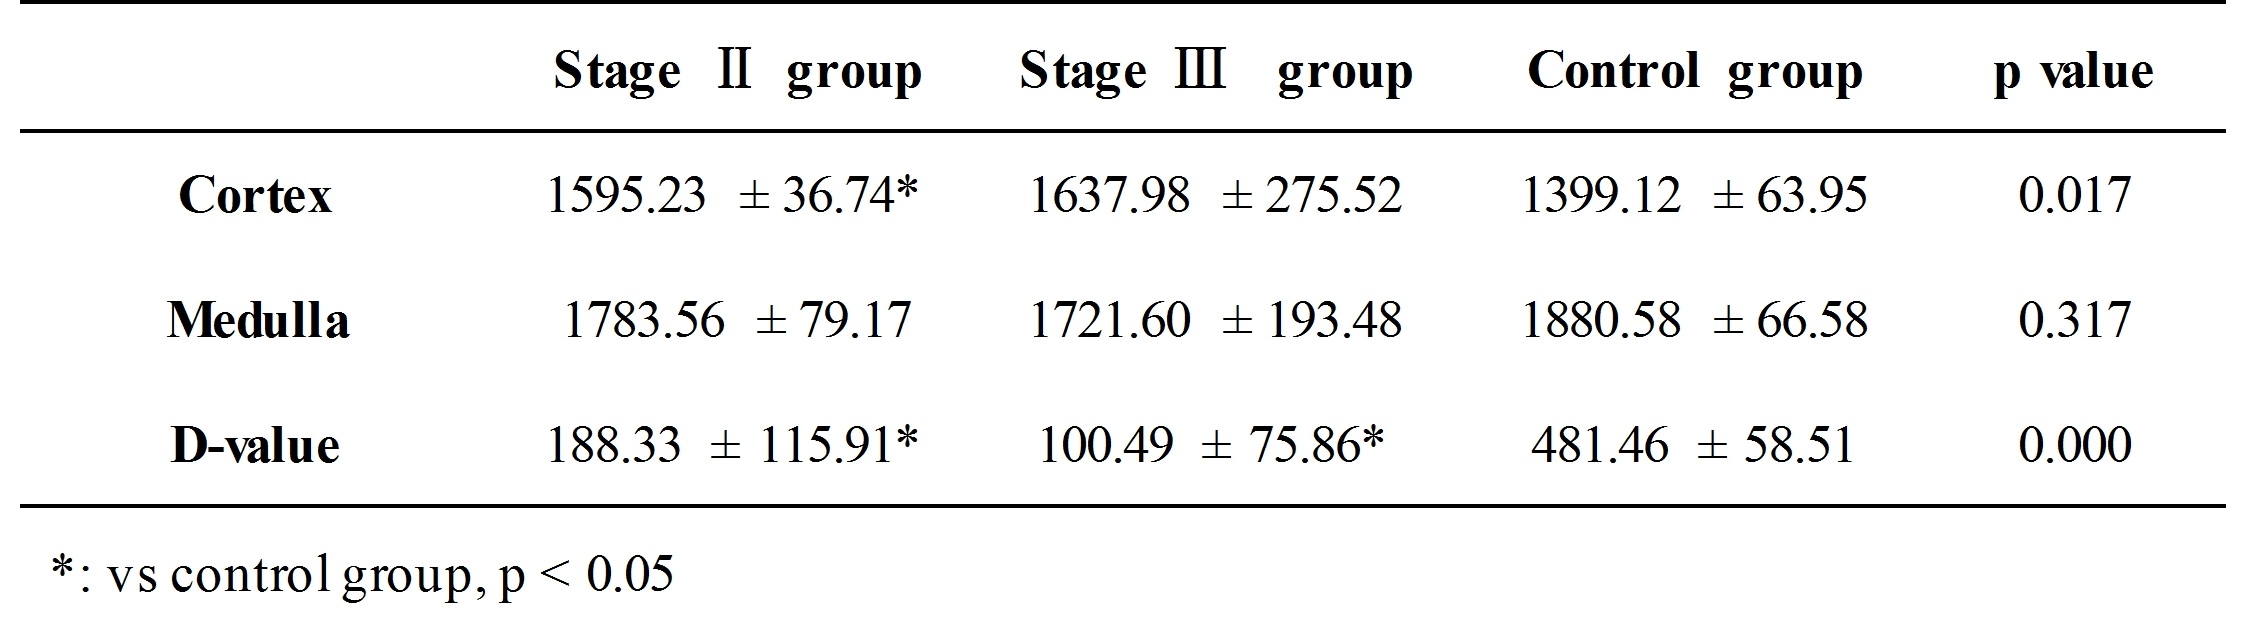
In Figure 1, clear kidney structures, i.e. cortex and medulla can be seen on R2* (upper row) and T1 (bottom row) maps of healthy volunteer (A and D), while the boundaries between cortex and medulla became vague in stage II (B and E) and stage III (C and F) patients, which may be attributed to the impairment of renal tissue. D-values of both R2* and T1 between cortex and medulla showed statistical differences among the healthy volunteer and different stages of AK patients (Table 1). T1 values of cortex also showed similar statistical differences among the three groups (Table2).Conclusion
This preliminary study suggested BOLD and T1 mapping are potential to diagnose AKI at early stage and predict the progression of AKI non-invasively. Due to limited number of patients in this study, further research is needed to investigate the relationship between the relaxation times and diagnosis and progression of AKI, and to reveal the underlying mechanism.Acknowledgements
No acknowledgement found.References
1. Thakar, C.V. 2013. Perioperative acute kidney injury. Adv Chronic Kidney Dis 20, 67–75
2. Evans, R.G., Goddard, D., Eppel, G.A. & O’Connor, P.M. 2011a. Factors that render the kidney susceptible to tissue hypoxia in hypoxemia. Am J Physiol Regul Integr Comp Physiol 300, R931–R940.
3. Niendorf, T., et al. "How bold is blood oxygenation level-dependent (BOLD) magnetic resonance imaging of the kidney? Opportunities, challenges and future directions." Acta Physiologica 213.1 (2015): 19-38.
4. Hallac, Rami R., et al. "Correlations of noninvasive BOLD and TOLD MRI with pO2 and relevance to tumor radiation response." Magnetic resonance in medicine 71.5 (2014): 1863-1873.
5. O'Connor, James PB, et al. "Comparison of normal tissue R1 and R* 2 modulation by oxygen and carbogen." Magnetic resonance in medicine 61.1 (2009): 75-83.
6. Kidney Disease: Improving Global Outcomes (KDIGO) CKD-MBD Work Group. KDIGO clinical practice guideline for the diagnosis, evaluation, prevention, and treatment of Chronic Kidney Disease-Mineral and Bone Disorder (CKD-MBD)[J]. Kidney international. Supplement, 2009 (113): S1.
7. Feng, Yanqiu, et al. "Improved MRI R2* relaxometry of iron-loaded liver with noise correction." Magnetic resonance in medicine 70.6 (2013): 1765-1774.
Figures