4833
Comparison of diffusion imaging microstructure models of the human placenta at 3T1Centre for Medical Image Computing, Department of Computer Science, University College London, London, United Kingdom, 2Centre for the Developing Brain, King's College London, London, United Kingdom, 3Biomedical Engineering Department, Division of Imaging Sciences, King's College London, London, United Kingdom
Synopsis
Developmental abnormalities in placental vascular formation are associated with major complications of pregnancy, such as fetal growth restriction and early onset pre-eclampsia. Multi-shell diffusion MRI at 3T has been shown to be capable of capturing fine microstructural information in a wide variety of organs and disease states, and could prove valuable for studying the human placenta in-vivo. We develop a rich scanning protocol, and use the data to investigate the complexity of models supported by the placental diffusion MRI signal. We demonstrate the feasibility of using this non-invasive approach to quantify microstructure in the human placenta and surrounding tissue.
Introduction
Diffusion MRI (dMRI) of the placenta commonly uses apparent diffusion coefficient (ADC)1–3, intravoxel incoherent motion (IVIM)4–9 or diffusion tensor10 models. IVIM is the more biologically relevant model – the bi-exponential curve may reflect the two separate populations of placental blood (residing in the intervillous space and fetal vasculature)11. The IVIM perfusion fraction has been shown to relate to pathologies such as fetal growth restriction4,6,8,9. In other contexts, e.g. brain and prostate12, a range of models have shown the ability to estimate more specific microstructural parameters. We compare a variety of these models on a rich dMRI acquisition from the in-vivo human placenta.
Methods
MRI was performed on three healthy pregnant subjects (gestational ages 27-37 weeks) using a 3T Philips Achieva scanner with a 32-channel cardiac coil. A single-shot echo-planar dMRI protocol spanning a large range of b-values and gradient directions was used: the 3 principal gradient directions were sampled at b=15, 25, 80, 115, 206, 346 s/mm2 and 8 directions were obtained at b=40, 400, 1000, 2000 s/mm2. Six b=0 images were also obtained. Other acquisition values were as follows: TR = 3792 ms, TE = 132 ms, FOV = 300 x 300 x 44 mm3, 2.2 mm isotropic voxels, 20-25 contiguous axial slices. Total scan duration was 3’55”. ROIs containing the placenta and uterine wall were defined on the first b=0 image.
We fit the diffusion tensor model (using Camino13) to each of the b=40, 400, 1000, 2000 s/mm2 shells individually. We also fit various isotropic (ADC, IVIM, ball-sphere) and anisotropic (diffusion tensor, stick, ball-stick – using the terminology of14) models to the complete set of diffusion-weighted measurements in each voxel. We fit each model using maximum likelihood estimation of the parameters, assuming a Rician noise model14,15.
Model selection was performed on a voxel-wise basis by calculating the Bayesian information criterion (BIC). To assess the strength of model preference between model pairs we calculated ∆BIC = BICmodel1 – BICmodel2. A difference of 10 or more between BIC values implies “strong” evidence for the model with lower BIC16.
Results
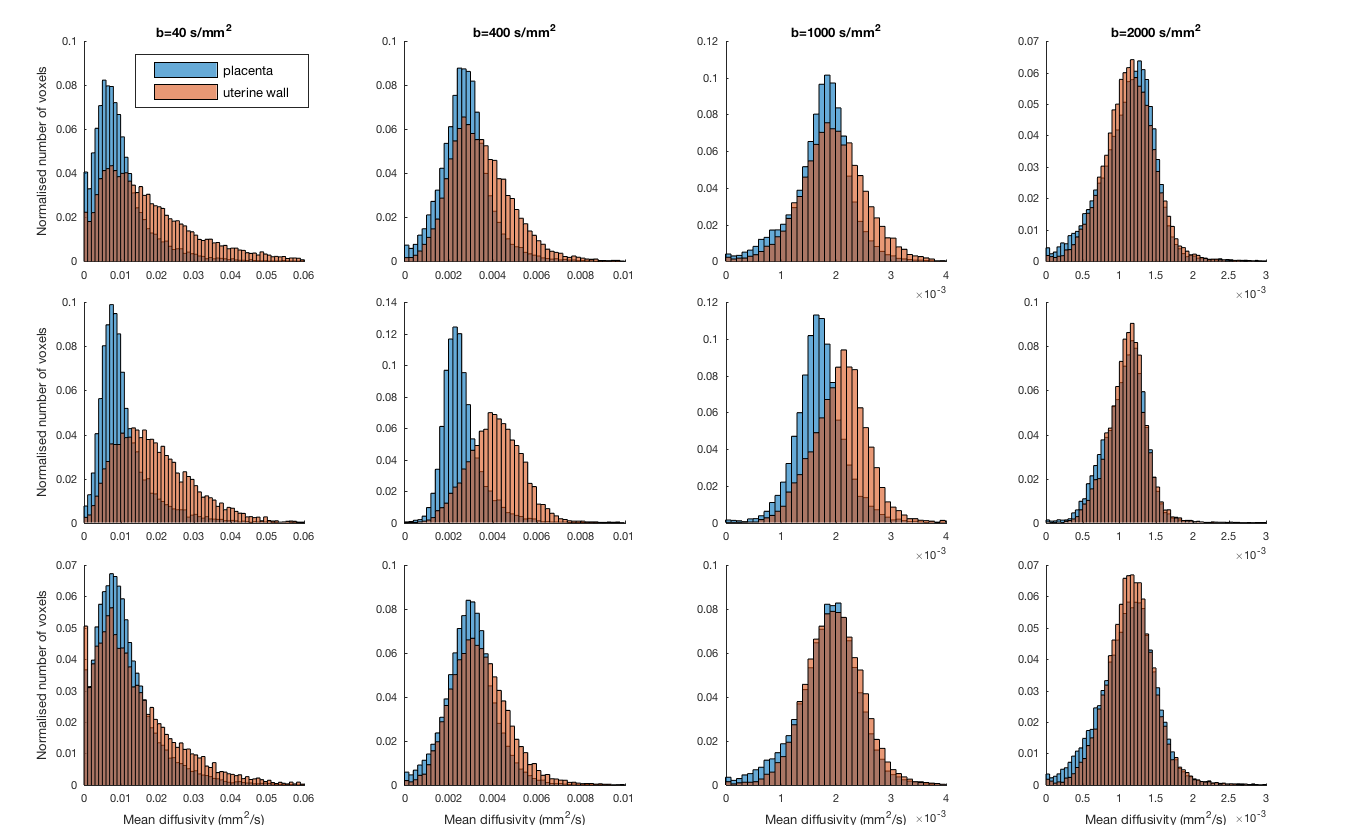
All subjects showed similar trends in their data. Figure 1 shows mean diffusivity (MD) maps across the b=40, 400, 1000 and 2000 s/mm2 shells for one subject. At lower b values (b=40 s/mm2 and b=400 s/mm2 shells) the MD in two subjects was much higher in the uterine wall than the placenta (Figure 1) reflecting high levels of perfusion from maternal arteries and veins. At high b-values the uterine wall and placenta are not well differentiated by MD, although there is some structure remaining in spatial maps (Figure 2).
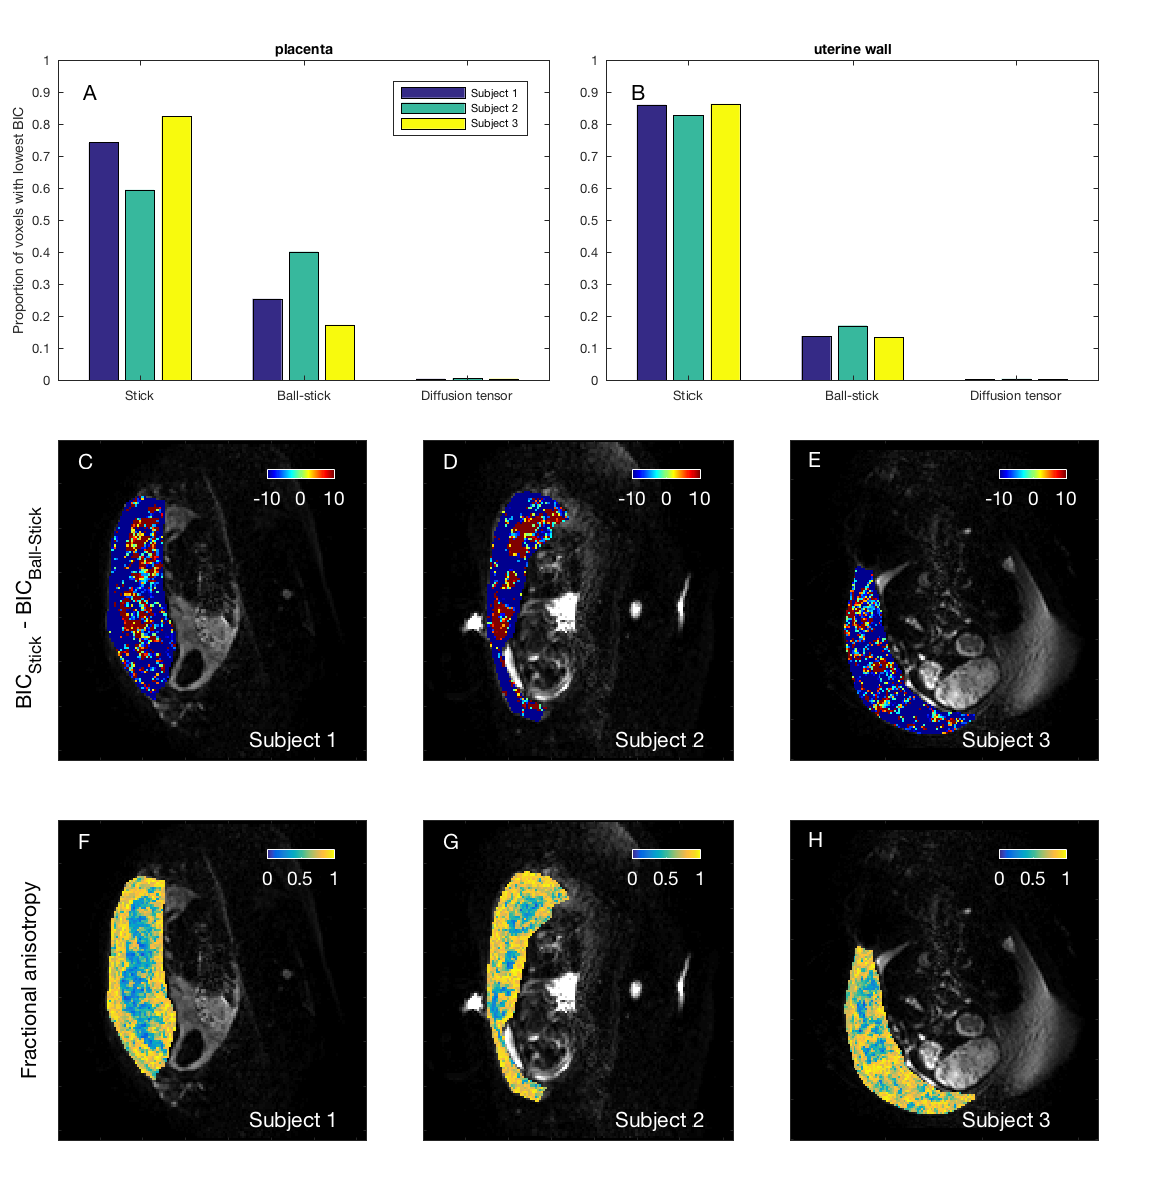
We next examined, for isotropic models, the proportion of voxels where each model had the lowest BIC value (Figures 3a-b). For the two best models (ADC and IVIM) we visualized the areas of tissue where each performed best by plotting spatial maps of ∆BIC (Figures 3c-e), diffusivity (Figures 3f-h) and perfusion fraction (Figures 3i-k). Interestingly, ADC performed better than IVIM in the most of uterine wall voxels, and slightly better in placental voxels. The same analysis for anisotropic models (Figure 4) showed stick and ball-stick to be the best models, with stick generally better in areas surrounding the placenta.
We then directly compared two isotropic (ADC) and anisotropic (stick) models (Figure 5). ADC was clearly the best model within the placenta, whereas the stick model was preferred in some areas surrounding the placenta.
Discussion
We observed similar patterns in the placenta and uterine wall for parameter and ∆BIC maps in scans from three individuals. This suggests that dMRI is consistently sensitive to anatomically-linked microstructural differences.
Although the BIC comparison shows that an ADC model explains the signal better than IVIM in a majority of placental voxels (Figure 3), there are large patches of voxels where the bi-exponential IVIM explains the signal better. We hypothesize that these correspond to areas where the fetal vasculature and maternal blood (within the intervillous space) are both present.
When mapping the fractional anisotropy (Figures 4f-h), and comparing isotropic and anisotropic models directly (Figure 5), we observe that diffusion in the placenta is mainly isotropic, although there is evidence of anisotropy in the surrounding tissue. This is consistent with blood perfusing anisotropically into the placenta from the fetal and maternal sides.
Conclusion
We demonstrated 3T dMRI of the placenta and a model based approach to data analysis. Future development of scanning protocols will elucidate which models best capture placental microstructure, and what data should optimally be acquired. We also aim to confirm consistency across multiple subjects, and extend to pathological placentae.Acknowledgements
This work is part of the NIH-funded Placenta imaging Project: project number 1U01HD087202-01. EPSRC grants N018702 and M020533 also supported the work.References
1. Bonel, H. M., Stolz, B., Diedrichsen, L., Frei, K., Saar, B., Tutschek, B., Raio, L., Surbek, D., Srivastav, S., Nelle, M., Slotboom, J. & Wiest, R. Diffusion-weighted MR Imaging of the Placenta in Fetuses with Placental Insufficiency . Radiology 257, 810–819 (2010).
2. Manganaro, L., Fierro, F., Tomei, A., La Barbera, L., Savelli, S., Sollazzo, P., Sergi, M. E., Vinci, V., Ballesio, L. & Marini, M. MRI and DWI: feasibility of DWI and ADC maps in the evaluation of placental changes during gestation. Prenat. Diagn. 30, 1178–1184 (2010).
3. Sivrioglu, A. K., Ozcan, U. A., Turk, A., Ulus, S., Yildiz, M. E., Sonmez, G. & Mutlu, H. Evaluation of placenta with relative apparent diffusion coefficient and relative T2 signal intensity analysis. Diagnostic Interv. Radiol. 19, 495–500 (2013).
4. Moore, R. J., Strachan, B. K., Tyler, D. J., Duncan, K. R., Baker, P. N., Worthington, B. S., Johnson, I. R. & Gowland, P. A. In utero perfusing fraction maps in normal and growth restricted pregnancy measured using IVIM echo-planar MRI. Placenta 21, 726–732 (2000).
5. Moore, R. J., Issa, B., Tokarczuk, P., Duncan, K. R., Boulby, P., Baker, P. N., Bowtell, R. W., Worthington, B. S., Johnson, I. R. & Gowland, P. A. In Vivo Intravoxel Incoherent Motion Measurements in the Human Placenta Using Echo-Planar Imaging at 0 . 5 T. 302, 295–302 (2000).
6. Derwig, I., Lythgoe, D. J., Barker, G. J., Poon, L., Gowland, P. A., Yeung, R., Zelaya, F. & Nicolaides, K. Association of placental perfusion, as assessed by magnetic resonance imaging and uterine artery Doppler ultrasound, and its relationship to pregnancy outcome. Placenta 34, 885–891 (2013).
7. Sohlberg, S., Mulic-Lutvica, A., Lindgren, P., Ortiz-Nieto, F., Wikström, A. K. & Wikström, J. Placental perfusion in normal pregnancy and early and late preeclampsia: A magnetic resonance imaging study. Placenta 35, 202–206 (2014).
8. Sohlberg, S., Mulic-Lutvica, A., Olovsson, M., Weis, J., Axelsson, O., Wikström, J. & Wikström, A. K. Magnetic resonance imaging-estimated placental perfusion in fetal growth assessment. Ultrasound Obstet. Gynecol. 46, 700–705 (2015).
9. Tang, M., Liu, X., Zhang, X. & Shi, K. The Diffusion and Perfusion Characteristics of Placenta with Differential Fetal Growth Restriction Types Using Intravoxel Incoherent Motion MR Imaging. in Proc. Intl. Soc. Mag. Reson. Med. 24 (2016). at <http://cds.ismrm.org/protected/16MPresentations/abstracts/0829.html>
10. Javor, D., Nasel, C., Schweim, T., Dekan, S., Chalubinski, K. & Prayera, D. In vivo assessment of putative functional placental tissue volume in placental intrauterine growth restriction (IUGR) in human fetuses using diffusion tensor magnetic resonance imaging. Placenta 34, 676–680 (2013).
11. Solomon, E., Avni, R., Hadas, R., Raz, T., Garbow, J. R., Bendel, P., Frydman, L. & Neeman, M. Major mouse placental compartments revealed by diffusion-weighted MRI, contrast-enhanced MRI, and fluorescence imaging. Proc. Natl. Acad. Sci. 111, 10353–8 (2014).
12. Panagiotaki, E., Chan, R. W., Dikaios, N., Ahmed, H. U., O’Callaghan, J., Freeman, A., Atkinson, D., Punwani, S., Hawkes, D. J. & Alexander, D. C. Microstructural characterization of normal and malignant human prostate tissue with vascular, extracellular, and restricted diffusion for cytometry in tumours magnetic resonance imaging. Invest. Radiol. 50, 218–227 (2015).
13. Cook, P. A., Bai, Y., Seunarine, K. K., Hall, M. G., Parker, G. J. & Alexander, D. C. Camino: Open-Source Diffusion-MRI Reconstruction and Processing. 14th Sci. Meet. Int. Soc. Magn. Reson. Med. 14, 2759 (2006).
14. Panagiotaki, E., Schneider, T., Siow, B., Hall, M. G., Lythgoe, M. F. & Alexander, D. C. Compartment models of the diffusion MR signal in brain white matter: A taxonomy and comparison. Neuroimage 59, 2241–2254 (2012).
15. Ferizi, U., Schneider, T., Panagiotaki, E., Nedjati-Gilani, G., Zhang, H., Wheeler-Kingshott, C. A. M. & Alexander, D. C. A ranking of diffusion MRI compartment models with in vivo human brain data. Magn. Reson. Med. 72, 1785–1792 (2014).
16. Kass, R. E. & Raftery, A. E. Bayes Factors. J. Am. Stat. Assoc. 90, 773–795 (1995).
Figures