4829
3D MSVAT-SPACE-STIR or 2D SEMAC-STIR for high resolution dental MRI?1Heidelberg University, Heidelberg, Germany, 2Heidelberg University, 3NORAS MRI products GmbH, 4Siemens Healthcare GmbH
Synopsis
Dental MRI is a new and promising diagnostic tool. Unfortunately, in presence of implants image quality is impaired by failure of fat suppression and susceptibility artifacts. Here, we for the first time systematically evaluated fat saturated MR sequences for artifact reduction for dental MRI. Smallest artifact volume was noted for SEMAC-STIR and TSE-STIR sequences. But, higher and isotropic resolution was only achieved with MSVAT-SPACE-STIR sequence. No artifact reduction was measured for SEMAC-STIR compared to standard TSE-STIR. In contrast, MSVAT-SPACE-STIR reduced artifacts up to 70% compared to standard SPACE-STIR. Since imaging of dental structures benefit from isotropic high resolution MSVAT-SPACE-STIR is advantageous.
Introduction
Dental MRI is a new and promising diagnostic tool. Feasible applications have been published in the fields of orthodontics [1, 2], endodontics [3], prosthodontics [4] and periodontology [5]. However, in presence of metallic implants image quality is impaired by failure of fat suppression and susceptibility artifacts. Spectral fat suppression is commonly used but fails already in the upper jaw in the absence of any metallic materials as a result of susceptibility differences at the tissue-air-border at the bottom of the maxillary sinus. In contrast, Dixon-based fat suppression is more robust but fails as well adjacent to dental implants. Short Tau Inversion (STIR) based fat suppression does not account for these disadvantages and seems the ideal fat suppression technique for dental MRI. Up to now, STIR based fat suppression was not tested in combination with multiple slab acquisition with VAT gradient based on a SPACE sequence (MSVAT-SPACE) and slice-encoding metal artifact correction (SEMAC) for dental MRI, which are developed for enhanced susceptibility artifact suppression. It is unclear which technique is favourable in terms of artifact volume and image quality while maintaining reasonable acquisition times which allows in vivo application.Material and Methods
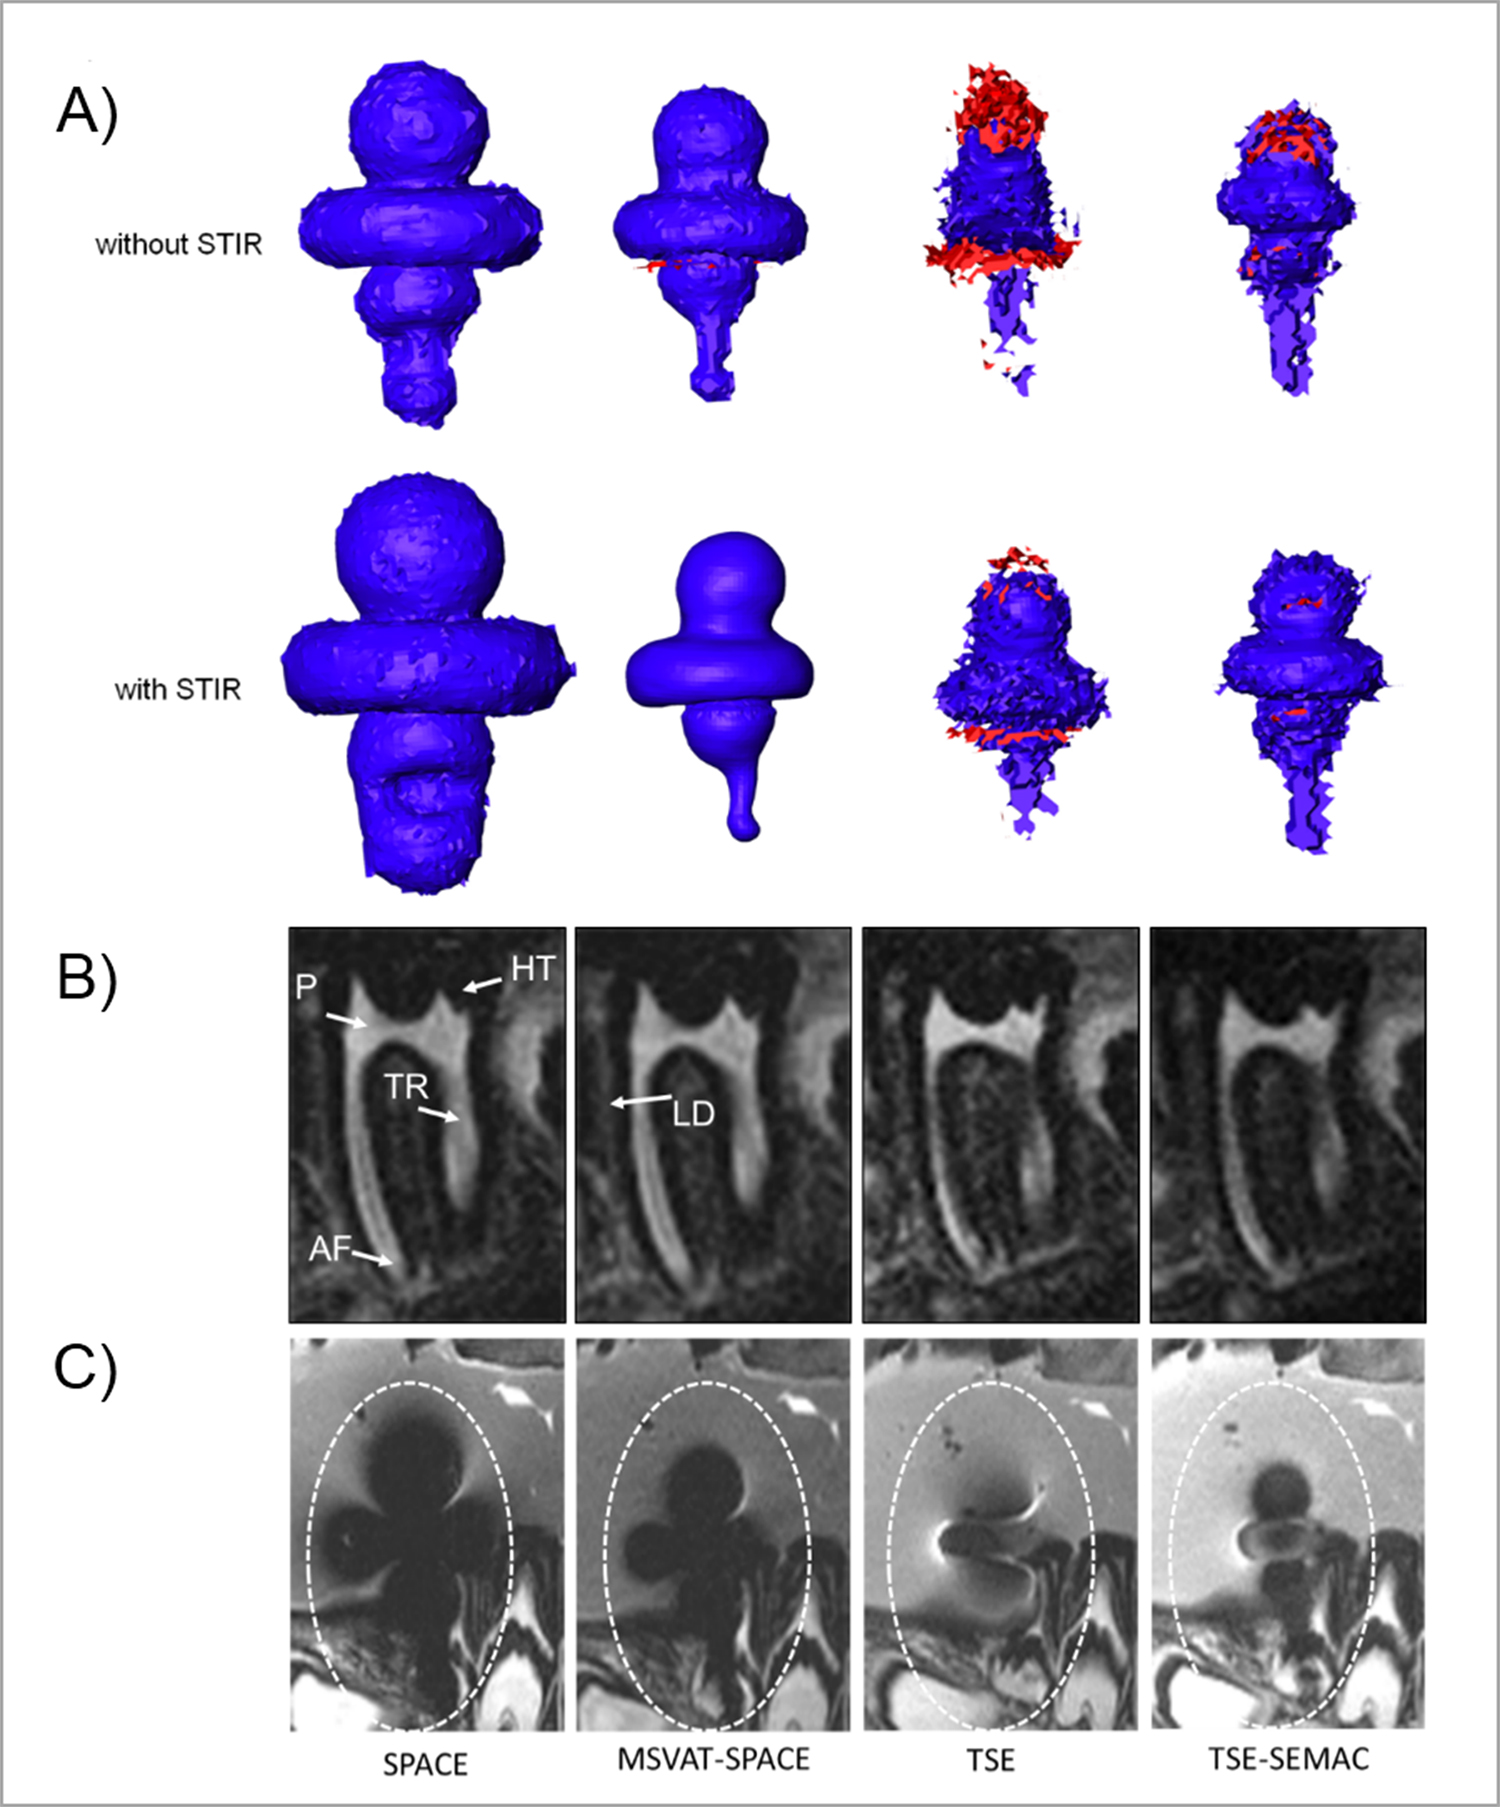
A 3T MRI system (Tim-Trio; Siemens Healthcare GmbH), a 16-channel multipurpose coil (Variety; NORAS MRI products; measurement of artifact volume and imaging of porcine head), and a 12-channel head coil (Siemens Healthcare GmbH; signal-to-noise ratio (SNR) measurement) were used. Two dental implants with different composition of crowns (CCT-T implant: cobalt, chromium and tungsten; Z-T implant: zirconium dioxide), prosthesis screws and abutments made of titanium were used. For measurement of artifact volume, implants were embedded in a mixture of water and fat. Afterwards image quality was assessed in porcine head with implants placed in anterior mandible. MSVAT-SPACE and SEMAC sequences were optimized with regards to artifact size (for example matrix size, readout bandwidth, and slice thickness). In a second step standard TSE and SPACE sequences with identical imaging parameters as much as possible were implemented for comparison. Determination of artifact volume was performed by subtraction of the true implant volume (determined by water displacement) from the volume measured in MRI. Semi-automatic quantification and rendering of signal loss- and pile up artifact volume were done with Amira 3D (FEI). Image quality was assessed quantitatively by calculating SNR and qualitatively by blinded read of porcine heads by two radiologists. The SNR was determined by measuring the dynamic noise [11] and was normalized for voxel size and acquisition time. Radiologists evaluated image quality of eight anatomical structures for the last molar on a scale from 1 (best visibility) to 5 (poor visibility) as published before [8]. Two-way ANOVA with pairwise post-hoc Tukey was used for multiple comparisons of artifact volumes. Visibility scores were analysed with Cohen’s kappa statistic and Fisher’s exact test after dichotomization of data in two groups.Results
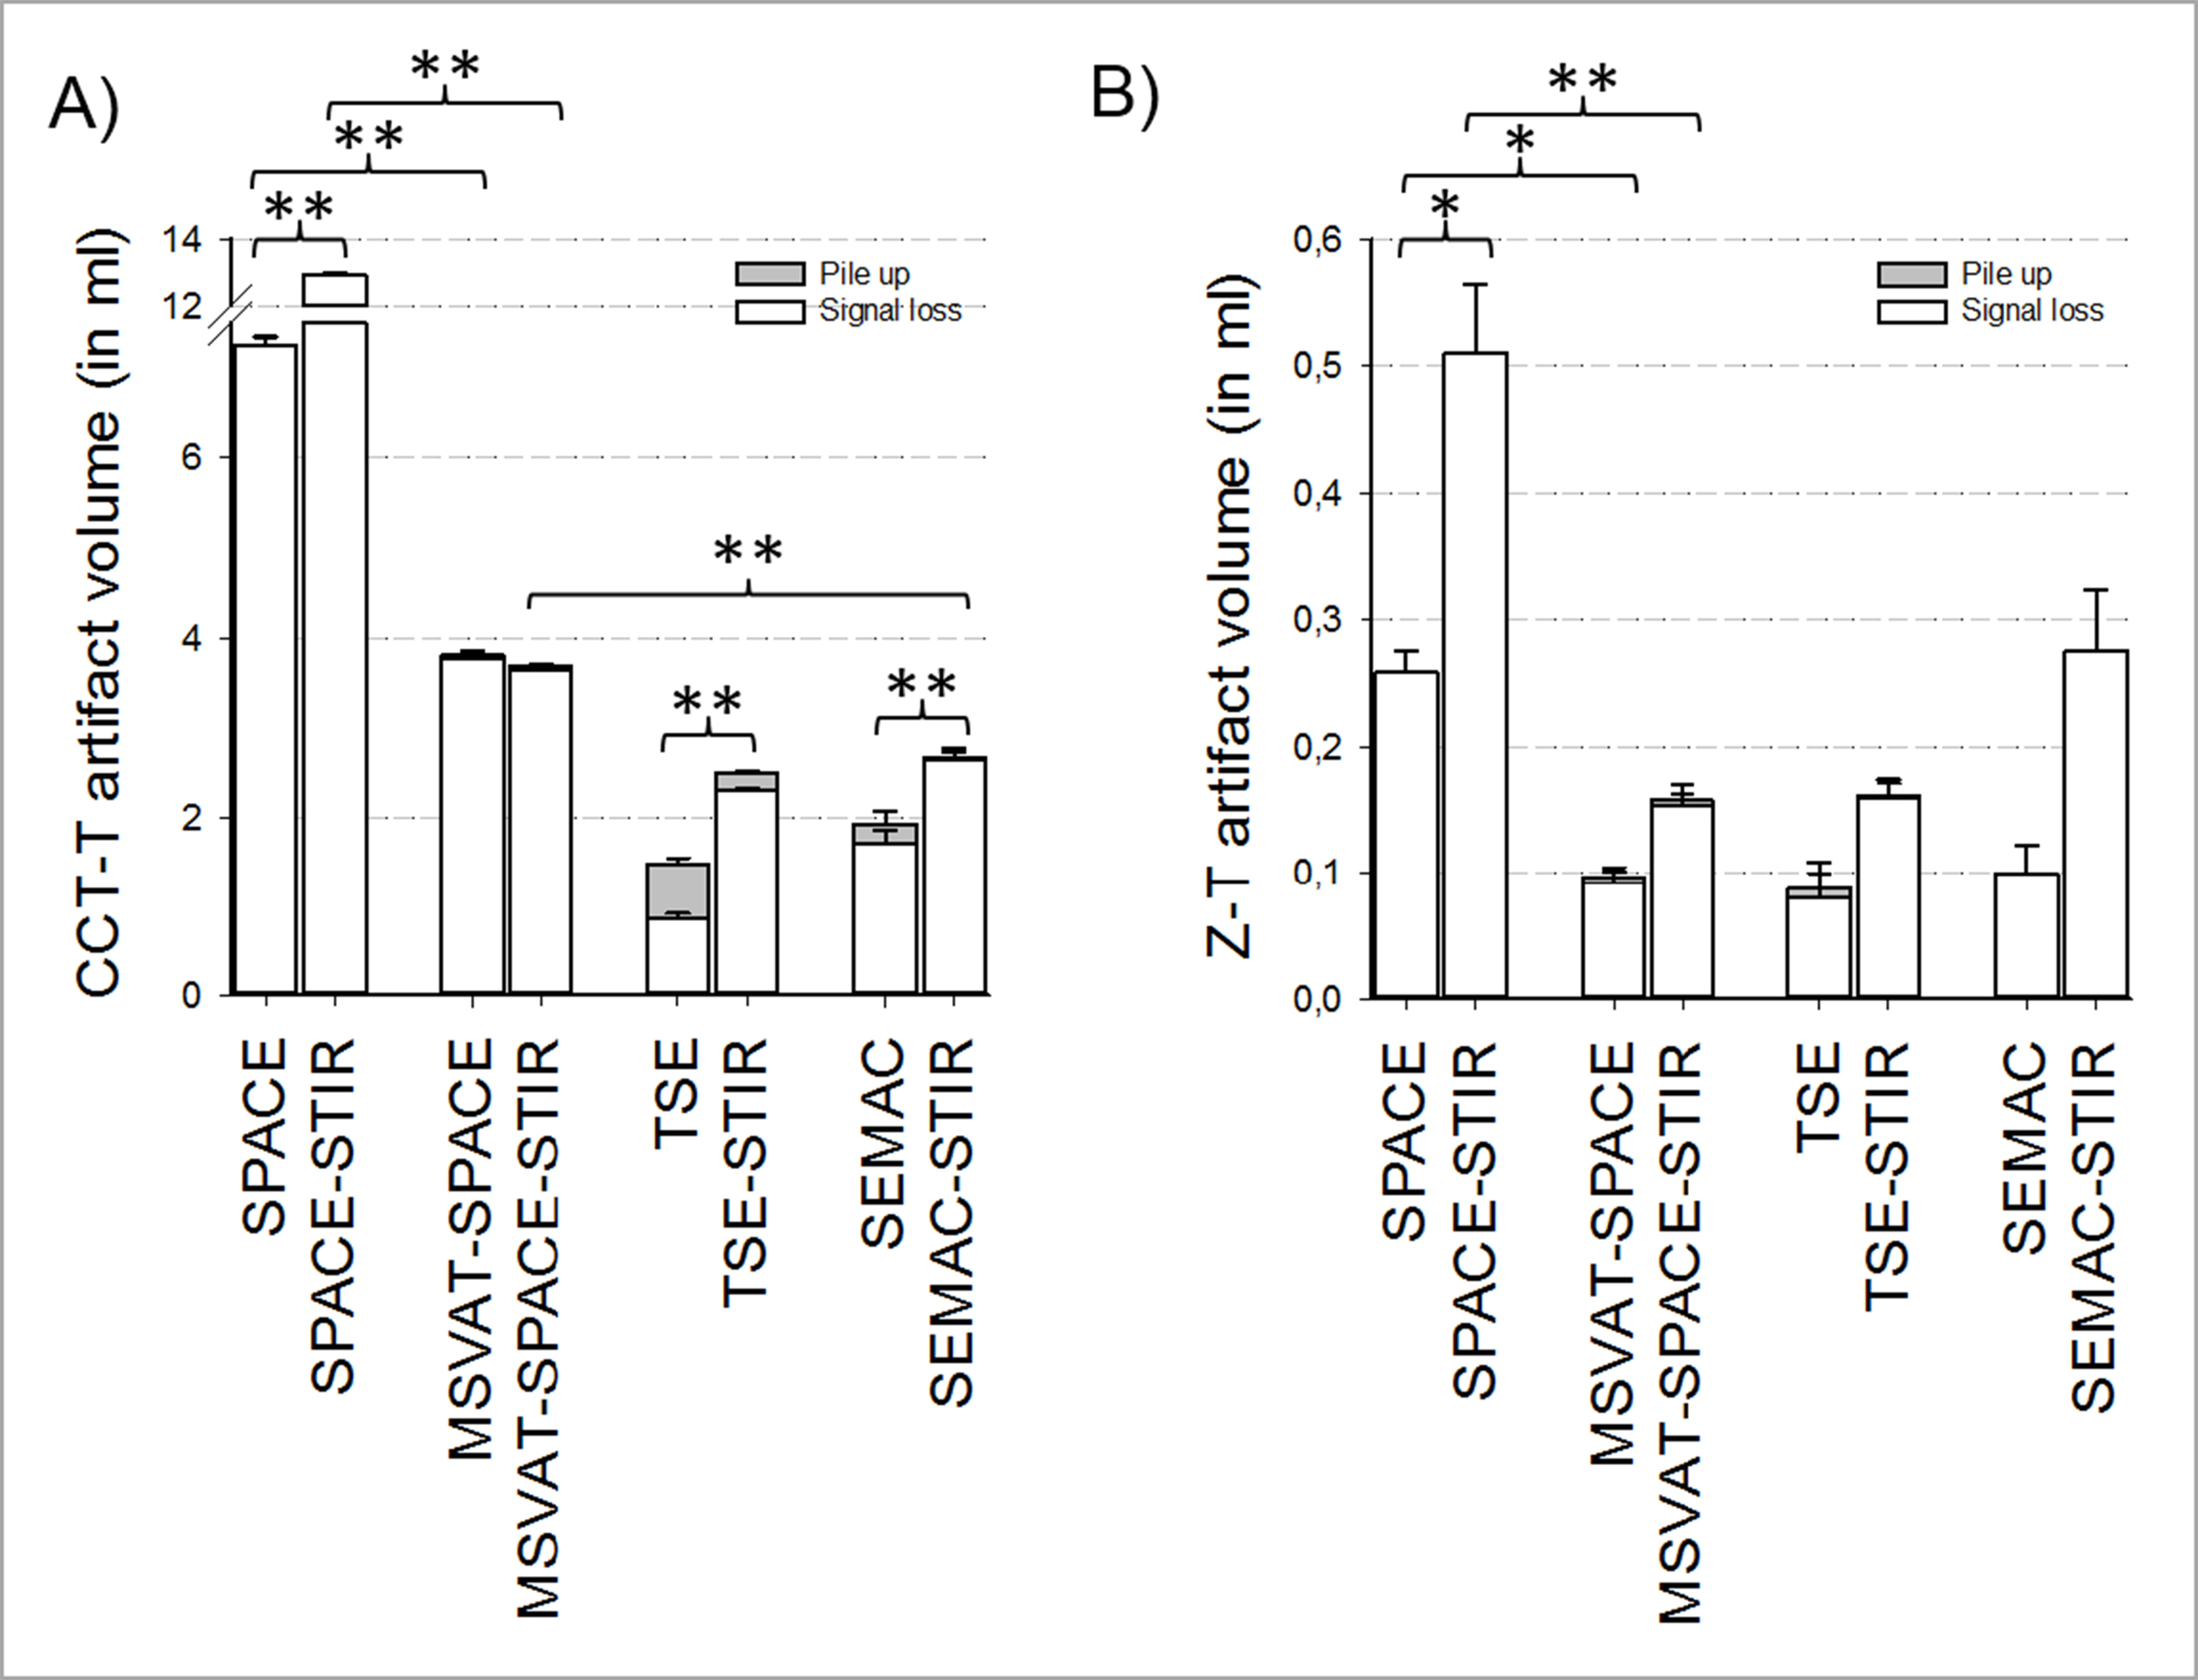
Our algorithm for 3D artifact quantification revealed only minor intrarater- and interrater-variability (mean 3.3%; mean 2.9%). Activation of STIR fat suppression was associated with a significant increase in artifact volume in the SPACE sequence for both implants (CCT-T: + 78 ± 2.5%; Z-T + 98 ± 11.3%; p ≤ 0.05) and in the TSE and SEMAC sequence for the CCT-T-implant (TSE: + 69 ± 9.8 %; SEMAC: + 38 ± 6.1%; p ≤ 0.001). In contrast, no significant increase in artifact volume was noted for the MSVAT-SPACE sequence when STIR was activated for both implants (CCT-T-implant: 3.8 ml vs. 3.7 ml; Z-T-implant: 0.1 ml vs. 0.2 ml). Artifact volume of SEMAC-STIR was not different to standard TSE-STIR for both implants. But, artifact volume of MSVAT-SPACE-STIR was 71% lower compared to SPACE-STIR for the CCT-implant and 70% lower for the Z-T-implant. No difference in artifact volume was noted between MSVAT-SPACE-STIR and SEMAC-STIR for the Z-T-implant. Only for the CCT-implant a significant smaller artifact volume was observed for the SEMAC-STIR (2.7 ml vs. 3.7 ml). No significant differences in image quality were noted MSVAT-SPACE-STIR and SEMAC-STIR. Cohen’s κ for interrater agreement was excellent (0.86). Normalized SNR of MSVAT-SPACE-STIR was significantly higher than for SEMAC-STIR (13.9 vs. 2.9)Conclusion
In contrast to the MSVAT-SPACE-STIR, the SEMAC-STIR sequence did not reduce artifact volume for both implants compared to their standard sequence and offered a lower resolution. Furthermore the normalized SNR of the MSVAT-SPACE was higher and 3D reconstructions are possible because of isotropic voxel size. That is advantageous for various reasons in dental MRI. Only when dealing with materials with high susceptibility differences to water TSE-STIR is advantageous since artifact volume is smaller compared to the MSVAT-SPACE-STIR.Acknowledgements
No acknowledgement found.References
1. Eley, K.A., S.R. Watt-Smith, and S.J. Golding, "Black Bone" MRI: a potential non-ionizing method for three-dimensional cephalometric analysis--a preliminary feasibility study. Dento maxillo facial radiology, 2013. 42(10): p. 20130236.
2. Tymofiyeva, O., et al., Three-dimensional localization of impacted teeth using magnetic resonance imaging. Clinical oral investigations, 2010. 14(2): p. 169-176.
3. Kress, B., et al., Age- and tooth-related pulp cavity signal intensity changes in healthy teeth: a comparative magnetic resonance imaging analysis. Oral surgery, oral medicine, oral pathology, oral radiology, and endodontics, 2007. 103(1): p. 134-137.
4. Tymofiyeva, O., et al., In vivo MRI-based dental impression using an intraoral RF receiver coil. Concepts in Magnetic Resonance Part B: Magnetic Resonance Engineering, 2008. 33B.
5. Schara, R., I. Sersa, and U. Skaleric, T1 relaxation time and magnetic resonance imaging of inflamed gingival tissue. Dento maxillo facial radiology, 2009. 38(4): p. 216-223.
6. Penarrocha Diago, M., A. Boronat Lopez, and J. Lamas Pelayo, Update in dental implant periapical surgery. Med Oral Patol Oral Cir Bucal, 2006. 11(5): p. E429-32.
7. Ai, T., et al., SEMAC-VAT and MSVAT-SPACE sequence strategies for metal artifact reduction in 1.5T magnetic resonance imaging. Investigative radiology, 2012. 47(5): p. 267-276.
8. Lee, Y.H., et al., Usefulness of slice encoding for metal artifact correction (SEMAC) for reducing metallic artifacts in 3-T MRI. Magn Reson Imaging, 2013. 31(5): p. 703-6.
9. Sutter, R., et al., Reduction of metal artifacts in patients with total hip arthroplasty with slice-encoding metal artifact correction and view-angle tilting MR imaging. Radiology, 2012. 265(1): p. 204-214.
10. Cho, Z.H., D.J. Kim, and Y.K. Kim, Total inhomogeneity correction including chemical shifts and susceptibility by view angle tilting. Medical physics, 1988. 15(1): p. 7-11.
11. Dietrich, O., et al., Measurement of signal-to-noise ratios in MR images: influence of multichannel coils, parallel imaging, and reconstruction filters. Journal of magnetic resonance imaging : JMRI, 2007. 26(2): p. 375-385.
Figures