4827
Complex Chemical Shift-Encoded MRI to Estimate Fat in Livers with Elevated Iron Content1Memorial Sloan Kettering Cancer Center, New York, NY, United States, 2New York Presbyterian Hospital/Weill Cornell Medicine, New York, NY, United States, 3University of Wisconsin
Synopsis
In patients with elevated liver iron, in-and-out-of-phase and IDEAL-IQ methods yield very different proton density fat fractions. In these patients, IDEAL-IQ could potentially serve as a more sensitive marker of hepatic steatosis than in-and-out-of-phase imaging, although larger studies are needed to confirm these findings. Irrespective of liver fat and liver iron content, conventional and IDEAL-IQ R2* values are highly correlated.
Purpose
Cancer patients undergoing chemotherapy are monitored for signs of hepatotoxicity, which can impact treatment options, including surgery, liver embolization, and chemotherapeutics[1]. An important manifestation of hepatotoxicity is hepatic steatosis, since chemotherapy-induced oxidative stress can lead to accumulation of intracellular vacuoles of fat within hepatocytes[2]. Most routine abdominal MRI protocols include T1-weighted-in-and-out-of-phase(IOP) imaging, allowing for qualitative steatosis assessment[3-5]. However, in livers containing both elevated iron and elevated fat, fat-induced and iron-induced signal changes cancel, underestimating fat content[6]. In our cancer population, many patients exhibit iron overload due to repeat blood transfusions to treat anemia, potentially masking hepatic steatosis on IOP imaging. IDEAL-IQ is a complex chemical shift–encoded MRI(CSE-MRI) method for fat quantification. This method uses multiecho T2* fitting with correction for field inhomogeneity, providing an estimate of proton density fat fraction (PDFF), corrected for the dephasing effects of liver iron[7-11]. Here, we evaluate how PDFF estimates using IOP correlate with PDFF estimates using IDEAL-IQ in cancer patients with varying levels of liver iron and liver fat. We also evaluate how conventional R2* correlate with IDEAL-IQ R2*, in patients with varying levels of liver iron and liver fat.Methods
A retrospective study was performed after
obtaining IRB-approved waiver of informed consent. Of all patients that
received a liver MRI at our institution between May 2016 and October 2016, 8
patients were identified whose exams included: (1)IOP, (2)IDEAL-IQ and (3)R2*
mapping (See Table 1). For each patient, three ROIs were selected in the right
lobe of the liver and spleen. To calculate IOP PDFF, the following equation was
used: $$ Proton density fat
fractionIOP = {(T1_in_phaseLIVER/T1_in_phaseSPLEEN)-(T1_out_phaseLIVER/T1_out_phaseSPLEEN)}/{2*(T1_in_phaseLIVER/T1_in_phaseSPLEEN)}
$$.
To calculate IDEAL-IQ fat fraction, liver ROIs were
measured on automatically-generated PDFF maps. To calculate IDEAL-IQ R2*
values, liver ROIs were measured on automatically-generated R2* maps.
Conventional R2* values were calculated by taking median R2* of the three
values generated by GE T2* mapping software. GE software was also used to
calculate iron concentration from T2* maps.
Patients were divided into normal iron([Fe] ≤ 2mg) and
elevated iron (Fe > 2mg) groups. Pearson correlation coefficients were
calculated between R2* estimates using conventional and IDEAL-IQ methods, over
all patients. Pearson correlation coefficients were calculated between PDFF
estimates using conventional and IDEAL-IQ methods over all patients, and over
normal iron group patients only. For patients with elevated iron, PDFF using
IOP and IDEAL-IQ methods were tabulated.
Results
Of the 8 patients, 4 were in the normal iron group and 4 were in the elevated iron group. Over all patients, the Pearson correlation coefficient between R2* estimates using conventional and IDEAL-IQ methods was 0.99, which was statistically significant(p=3.6E-11). Over all patients, the Pearson correlation coefficient between PDFF estimates using conventional and IDEAL-IQ methods was 0.312, which was not statistically significant(p = 0.44). However, when elevated liver iron patients were excluded, the Pearson correlation coefficient for PDFF estimates using conventional and IDEAL-IQ methods was 0.98, which was statistically significant (p=0.00016). For patients with elevated liver iron, PDFF estimates using conventional and IDEAL-IQ methods are compared in Table 2.Discussion
Our
results show that in patients with elevated liver iron, conventional IOP and
IDEAL-IQ methods yield very different PDFF estimates. Small sample size did not
permit further statistical testing, although it appears that IDEAL-IQ generally
estimated fat fraction to be higher than the conventional method did (See table
2). Therefore, IDEAL IQ could potentially serve as a more sensitive early
detector of hepatosteatosis in chemotherapy patients, given the concomitant
elevated liver iron levels many of them exhibit.
Our results also show that irrespective of
liver fat content, conventional and IDEAL-IQ R2* values are highly correlated.
This study lacks a pathological or MR
spectroscopy gold standard, and so accuracy of the conventional and IDEAL-IQ
methods was not assessed. However, this type of analysis has been previously
performed [8, 12]. IDEAL-IQ was recently introduced in our institution, and so
this study is limited by small sample size. Future studies will include a
larger number of patients, as well as pre- and post-chemotherapy time
points.
Conclusion
In patients with elevated liver iron, IDEAL-IQ could potentially serve as a more sensitive marker of hepatic steatosis than IOP, although larger studies are needed to confirm these findings. Since many chemotherapy patients have elevated liver iron levels, IDEAL-IQ could serve as a useful tool for early detection of hepatic steatosis in this population. Irrespective of liver PDFF, R2* using conventional and IDEAL-IQ methods are highly correlated.Acknowledgements
No acknowledgement found.References
1. Grigorian, A. and C.B. O'Brien, Hepatotoxicity Secondary to Chemotherapy. J Clin Transl Hepatol, 2014. 2(2): p. 95-102. 2. Sharma, A., et al., Chemotherapy induced liver abnormalities: an imaging perspective. Clin Mol Hepatol, 2014. 20(3): p. 317-26. 3. Bahl, M., et al., Liver steatosis: investigation of opposed-phase T1-weighted liver MR signal intensity loss and visceral fat measurement as biomarkers. Radiology, 2008. 249(1): p. 160-6. 4. Merkle, E.M. and R.C. Nelson, Dual gradient-echo in-phase and opposed-phase hepatic MR imaging: a useful tool for evaluating more than fatty infiltration or fatty sparing. Radiographics, 2006. 26(5): p. 1409-18. 5. Earls, J.P. and G.A. Krinsky, Abdominal and pelvic applications of opposed-phase MR imaging. AJR Am J Roentgenol, 1997. 169(4): p. 1071-7. 6. Queiroz-Andrade, M., et al., MR imaging findings of iron overload. Radiographics, 2009. 29(6): p. 1575-89. 7. Hernando, D., et al., Quantification of Liver Iron With MRI: State of the Art and Remaining Challenges. Journal of Magnetic Resonance Imaging, 2014. 40(5): p. 1003-1021. 8. Reeder, S.B., et al., Quantitative Assessment of Liver Fat with Magnetic Resonance Imaging and Spectroscopy. J Magn Reson Imaging, 2011. 34(4): p. spcone. 9. Reeder, S.B., et al., Water-fat separation with IDEAL gradient-echo imaging. J Magn Reson Imaging, 2007. 25(3): p. 644-52. 10. Reeder, S.B., et al., Iterative decomposition of water and fat with echo asymmetry and least-squares estimation (IDEAL): application with fast spin-echo imaging. Magn Reson Med, 2005. 54(3): p. 636-44. 11. Reeder, S.B., et al., Multicoil Dixon chemical species separation with an iterative least-squares estimation method. Magn Reson Med, 2004. 51(1): p. 35-45. 12. Idilman, I.S., et al., Hepatic steatosis: quantification by proton density fat fraction with MR imaging versus liver biopsy. Radiology, 2013. 267(3): p. 767-75.
Figures
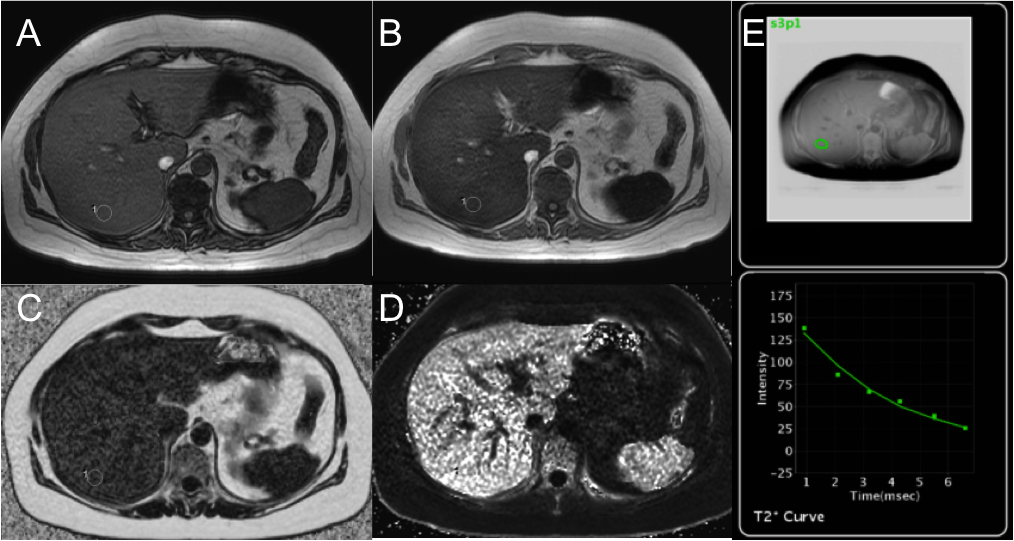
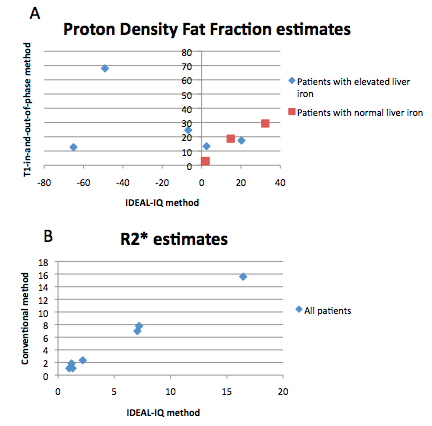
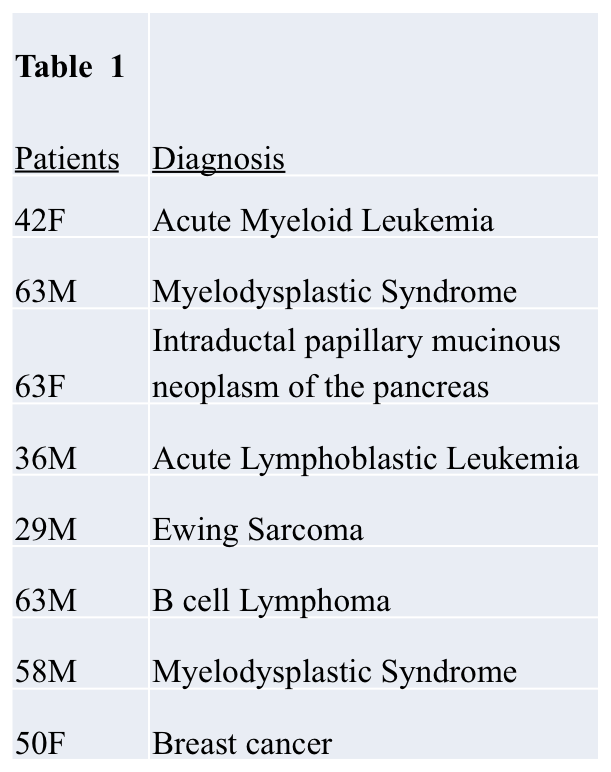
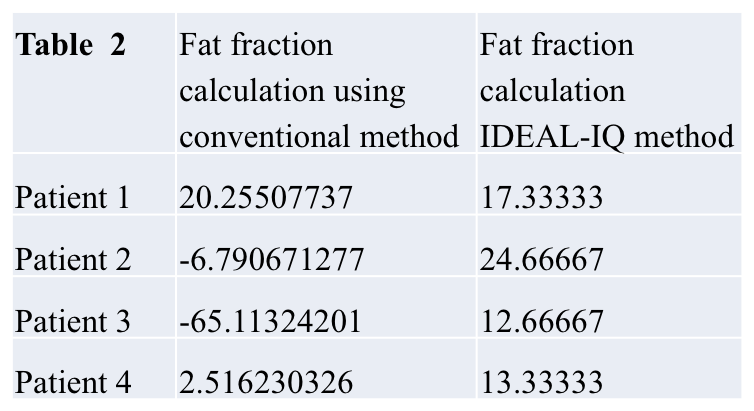
Table 2 illustrates that in patients with elevated liver iron, proton density fat fraction estimates from IDEAL-IQ were generally higher than from T1-in-and-out-of-phase, although small sample size did not permit meaningful statistical testing.