4822
Application of Texture Analysis to Apparent Diffusion Coefficient Images of the Normal Human Placenta1Radiology, University of Texas Southwestern Medical Center, Dallas, TX, United States, 2Advanced Imaging Research Center, University of Texas Southwestern Medical Center, Dallas, TX, United States, 3Department of Clinical Science, University of Texas Southwestern Medical Center, Dallas, TX, United States, 4Obstetrics & Gynecology, University of Texas Southwestern Medical Center, Dallas, TX, United States
Synopsis
The human placenta is a complex structure with unique capabilities. It has a 40-week average life span, during which it facilitates the exchange between the maternal and fetal cardiovascular systems. There is little known about the development and maturation of the placenta throughout the gestational period during normal pregnancy. It is however recognized that the placenta appears more heterogeneous on various imaging modalities as the pregnancy progresses. In this work, we propose to characterize the placenta heterogeneity as a function of gestational age through the application of grey-scale texture analysis to ADC maps using a large retrospective MRI database.
Purpose
In response to the recent Human Placenta Project initiative, we developed and applied software-based data analysis tools for semi-automated texture feature analysis of our selected database of approximately 1000 existing fetal MRI studies spanning 14-41 weeks gestation from 2006-2016.Methods
Our current imaging database includes 965 MR fetal imaging studies with gestational age ranging from 14 to 41 weeks (Figure 1). Gestational age was assigned based on last menstrual history and ultrasound dating, which is the current standard practice. Maternal weight was also recorded. Of 965 cases, 205 were determined to be normal and 186 had mild to moderate ventriculomegaly and the remaining 574 cases had confirmed CNS abnormalities.
Majority of the fetal cases (>920) were acquired on a Siemens Avanto 1.5 Tesla (T) scanner. For almost all cases, the following images were acquired: T2-weighted single shot turbo spin echo (SShTSE) images capturing the entire fetus and placenta, T1-weighted gradient echo (GRE) images matching the same locations as the above T2-weighted images, covering the entire fetus and placenta, Multiple T2-weighted SShTSE series covering the fetal brain, that also includes placenta, T1-weighted GRE images closely matching the above T2-weighted images, covering the fetal brain and placenta, and Diffusion-weighted (DW) images closely matching the above T2- and T1-weighted images, covering the fetal brain and placenta with b=0 and b=800 s/mm2. In many cases, a derived apparent diffusion coefficient (ADC) map included a large segment of the placenta, as shown in Figure 2.
Non-invasive ultrasound imaging was proposed as a potential evaluator of placental development based on texture and related statistical metrics almost 30 years ago1-3. Recognizing the operator dependence of ultrasound and true volumetric nature of MRI, we propose that texture analysis in retrospective MR fetal imaging studies (specifically in the ADC images) would allow us to characterize the development of normal placenta. Similar approaches have recently been described for prostate MR4, MR-assessment of liver fibrosis,5,6 and DCE-MRI in breast cancer.
The original texture feature analysis for gray scale images was published by Haralick et. al. in a pioneering paper on image analysis for photomicrographs, aerial photography, and satellite imagery7. We have implemented semi-automated MATLAB scripts and more recently Osirix-based plugins to perform preliminary texture analysis in a cohort of 47 studies. The initial step in this analysis is the construction of a gray-level co-occurrence matrix (GLCM – also known as a spatial gray-level dependence matrix) on an ROI basis. The pixel offset for comparison must be specified at this point. The benefit of small offsets is that gradients in brightness due to coil sensitivity profiles will automatically be handled. However, the offset distance (typically 1-10 pixels or ~0.1-1.0 cm) must be sufficient to capture the expected heterogeneity in the mature placenta. From the GLCM, a variety of second order statistics can be calculated and exported for statistical compilation and analysis.
Results
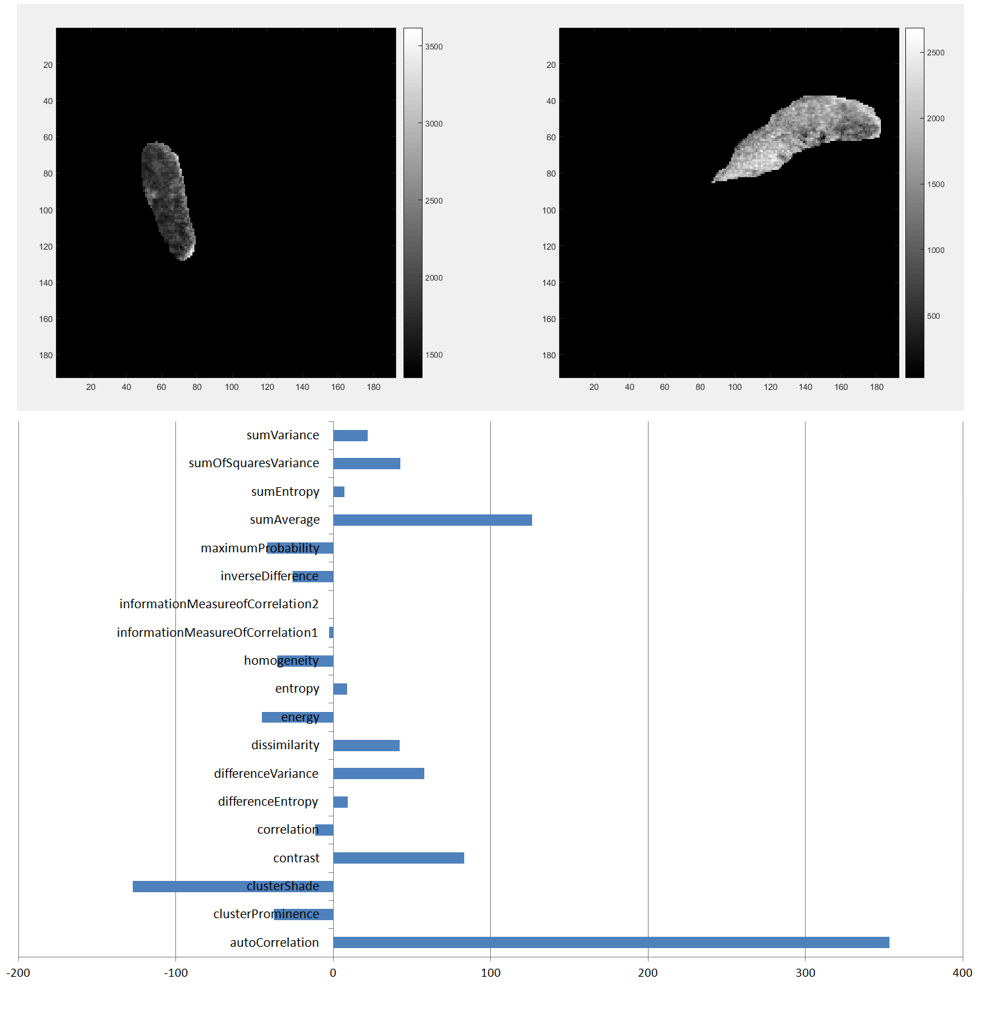
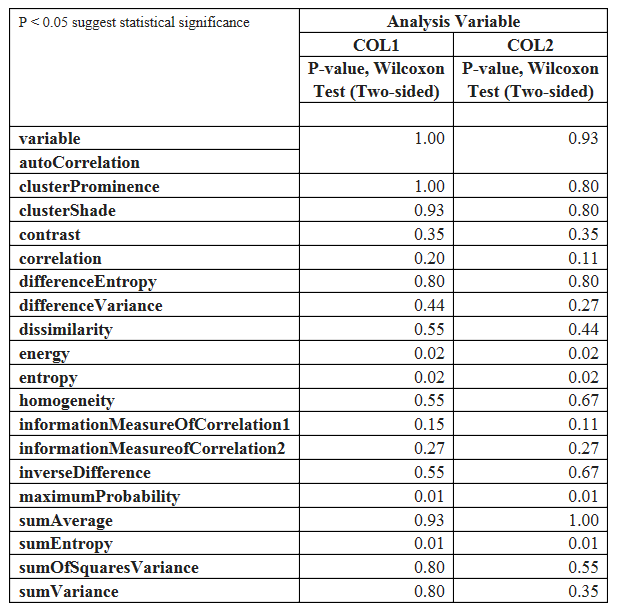
In Figure 3, changes in the traditional Haralick texture features are shown as a percent change in representative 18-week and 38-week placentas. The more mature placenta has increased heterogeneity and increased entropy. To investigate the statistical significance of the 38 traditional texture metrics available for nearest-voxel comparison, we compared the texture metrics for a subgroup (n=4) of late gestational age placentas (35-36 weeks) to early gestational age (n=8, 20-24 weeks). Preliminary analysis using a two-sided Wilcoxon test suggests statistical significance (P<0.05) for energy, entropy, maximumProbability, and sumEntropy texture metrics (Figure 4). These results provide critical guidance in selecting appropriate metrics for compilation over the entire retrospective fetal MRI database. In future work, we anticipate exploring the optimization of pixel offset in characterizing placenta development, with the possibility of developing a secondary estimator for gestational age.Discussion
Our preliminary analysis suggests increasing placental heterogeneity with gestational age. We will extend this analysis to our existing database of approximately 1000 MR fetal studies.Acknowledgements
No acknowledgement found.References
1. Almond DC, Pryce WIJ. Characterisation of in vivo placental ultrasonic images using digital techniques-a preliminary report. Ultrasound Med Biol. 1982; 8:29-39.
2. Crawford DC, Morris DT, Fenton DW, Pryce WI. Possible applications of digital analysis of ultrasonic images of the placenta. Ultrasound Med Biol. 1985; 11:79-84.
3. Morris DT. An evaluation of the use of texture measurements for the tissue characterisation of ultrasonic images of in vivo human placentae. Ultrasound Med Biol. 1988; 14:387-395.
4. Wibmer A, Hricak H, Gondo T, et al. Haralick texture analysis of prostate MRI: utility for differentiating non-cancerous prostate from prostate cancer and differentiating prostate cancers with different Gleason scores. Eur Radiol. 2015; 25:2840-2850.
5. House MJ, Bangma SJ, Thomas M, et al. Texture-Based Classification of Liver Fibrosis Using MRI. J Magn Reson Imaging. 2015; 41:322-328.
6. Yu H, Touret AS, Li B, et al. Application of texture analysis on parametric T1 and T2 maps for detection of hepatic fibrosis. J Magn Reson Imaging 2016.
7. Haralick RM, Shanmuga.K, Dinstein I. Textural Features for Image Classification. IEEE Trans Syst Man Cybern. 1973; Smc3:610-621.
Figures