4821
Pseudo-fat in the fetal liver with two-point Dixon water-fat separation1Medical Biophysics, The University of Western Ontario, London, ON, Canada, 2Obstetrics and Gynaecology, The University of Western Ontario, London, ON, Canada, 3Division of Maternal, Fetal and Newborn Health, Children's Health Research Institute, London, ON, Canada
Synopsis
2-point Dixon water-fat imaging is a widely available sequence that can be used to generate fat images. Increased fat was seen in the livers of a 35+4 week anencephalic fetus and a 37 week normal fetus on 2-point Dixon images, but not with IDEAL water-fat imaging. When applied to the fetus late in gestation, caution should be taken as a shortened fetal liver T2* may appear as false liver fat. IDEAL water-fat imaging corrects for changes in T2* and is a more appropriate sequence for fetal water-fat separated imaging in the third trimester.
Purpose
Animal and observational clinical studies have highlighted that childhood obesity starts with abnormal metabolic development inside the womb, in response to an adverse environment created by placental insufficiency or nutritional cues associated with maternal obesity or diabetes. Abnormal liver fat accumulation is associated with childhood obesity and can be detected as early as in infancy in children born to mothers with gestational diabetes1. We have been using 3D water-fat imaging of the fetus in an effort to measure the lipid content of fetal adipose tissue, both visceral and subcutaneous, and assess how early signs of abnormal fetal fat accumulation are detectable.
2-point Dixon water-fat imaging uses 2 echoes and B0 field mapping techniques to model water and fat2,3. It does not account for the complex fat spectrum and is unable to correct for T2* effects2,3. Quantitative IDEAL water-fat imaging uses 6 echoes and is able to model both T2* effects and the complex fat spectrum4-6. Both sequences produce water and fat images which are used to produce fat fraction images (fat/(water + fat)). Here we present cases in which there falsely appeared to be fatty liver on 2-point Dixon fat images which was not seen with quantitative IDEAL.
Methods
Volunteers with singleton pregnancies were recruited from low-risk and high body mass index (BMI) clinics and imaged in a wide-bore (70cm bore) 1.5T MRI (GE MR450w). During an approximately 30 min MRI exam, 3D 2-point Dixon (TR 6.26-6.316 ms, flip angle 5°, FOV 50 cm, acquisition matrix 160×160, slice thickness 4-6 mm, 64-128 slices) and 3D quantitative IDEAL (TR 11.158-12.448 ms, flip angle 7°, FOV 50 cm, acquisition matrix 160×160, slice thickness 5-6.5 mm, 36-64 slices) were used during maternal breath hold to image fetal fat. The liver was segmented on the quantitative IDEAL images to measure the fat fraction using 3D Slicer (v4.7.0 Nightly 2016-10-24).Results
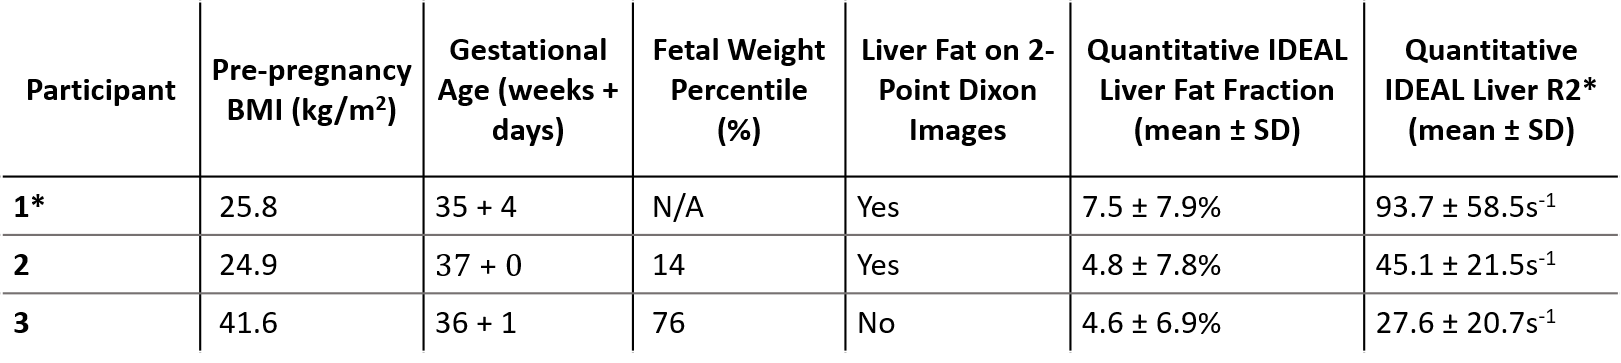
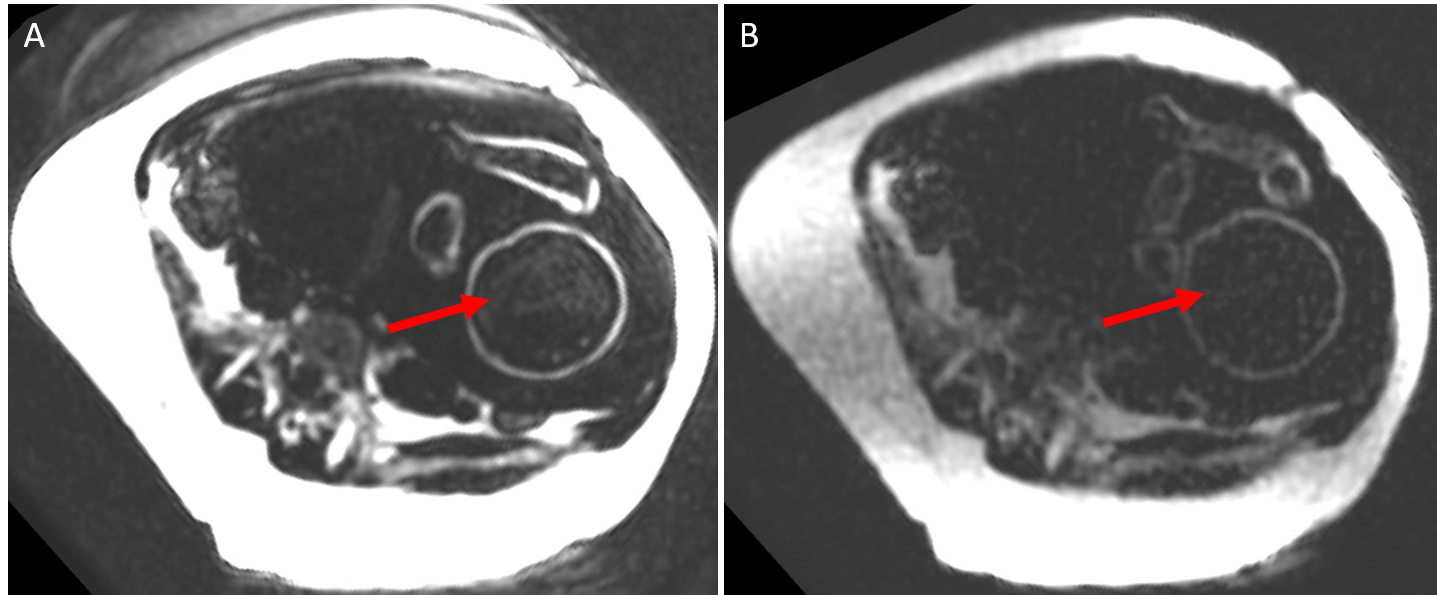
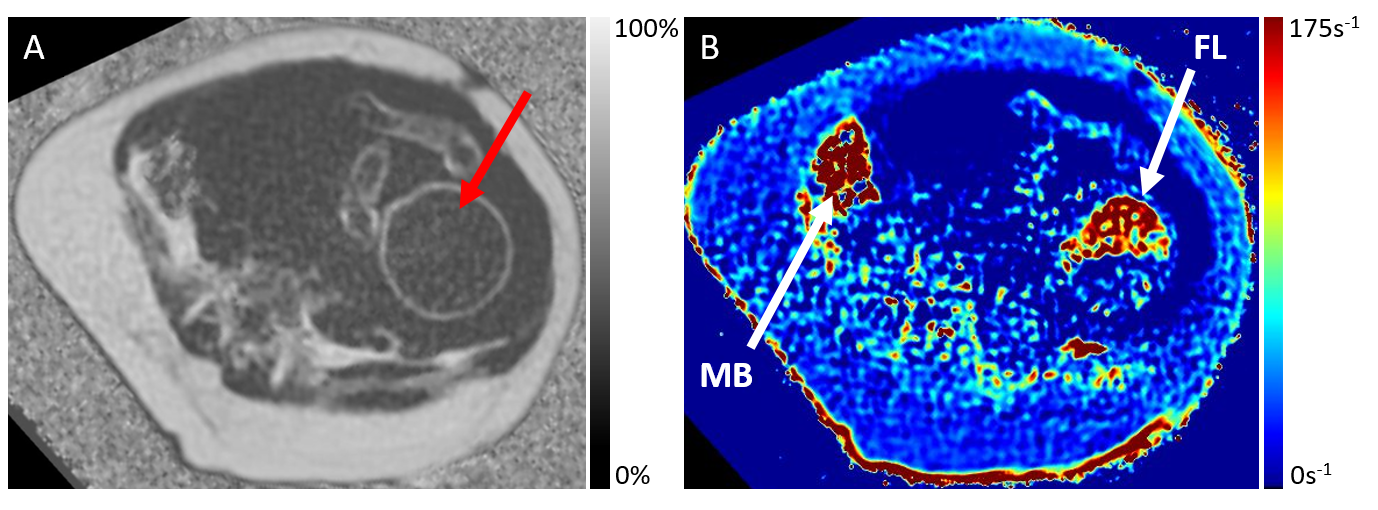
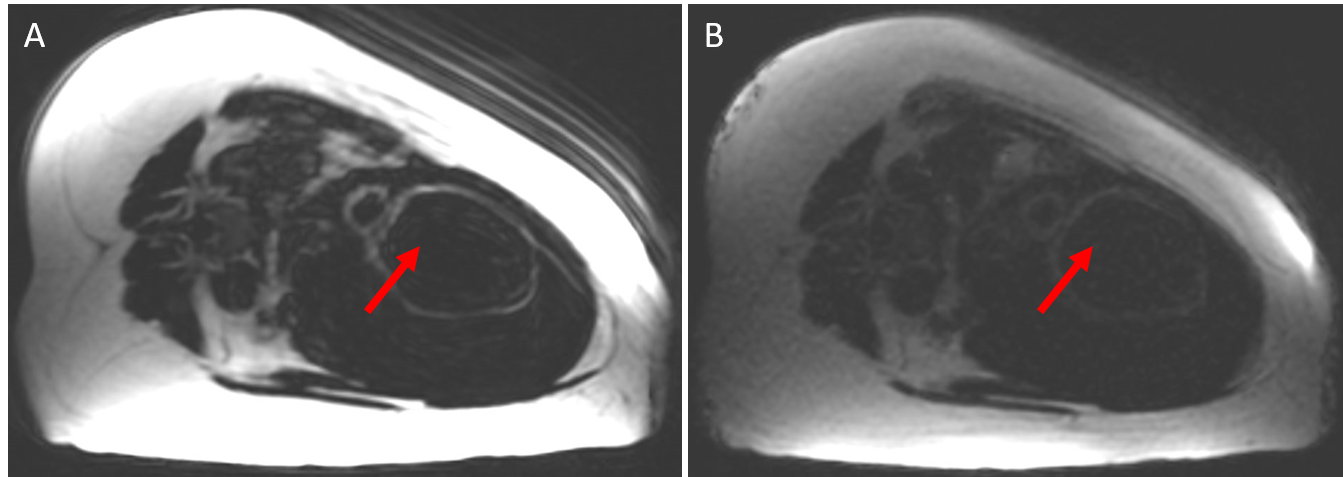
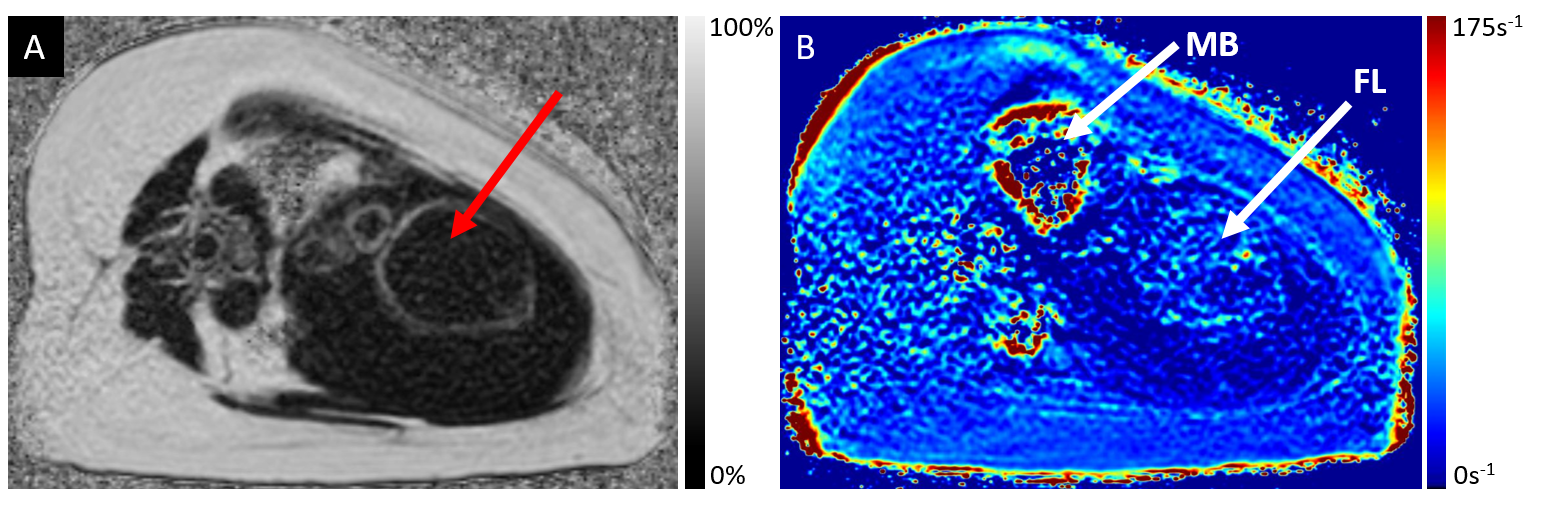
Preliminary data were acquired from 3 pregnant women imaged between 35+4 and 37+0 weeks gestational age. One patient pregnant with a fetus with anencephaly was included in the study. Table 1 shows participant demographics and liver fat fraction and R2* measurements made. In two of the volunteers, elevated fat appeared in the fetal liver on the 2-point Dixon fat images (Figure 1A). In comparison, no fat was seen in the fetal liver on the quantitative IDEAL fat images (Figure 1B), while the fetal liver was apparent on the R2* map (Figure 2B). In the third volunteer, no fat appeared in the 2-point Dixon images (Figure 3A) and the fetal liver did not appear as clearly on the quantitative IDEAL R2* map (Figure 4B).Discussion
2-point Dixon images showed false liver fat in two of three fetuses, while the third fetus showed no liver fat in 2-point Dixon images and had a longer R2* value. 2-point Dixon incorrectly models a reduced T2* as fat signal, which can result in a false-positive identification of liver signal as liver fat. Quantitative IDEAL modeling corrects for changes in T2*4-6 and therefore is considered superior in performing water-fat MRI.
The false fetal liver fat signal occurs as the consequence of a much shorter T2* in fetal liver compared to adult liver (R2* of approximately 50s-1 in third trimester, compared to 36s-1 in adult liver at 1.5T7). This reduced T2* is the result of the fact that the fetal liver is a major hemopoietic site during fetal development and acts as a reservoir for iron in the third trimester7. We demonstrate false liver fat in both a normal and anencephalic fetus, highlighting that for fetal water-fat separated imaging, a correction for T2* needs to be applied.
Conclusion
Users should be aware that fetal liver may have a shortened T2* in the third trimester which 2-point Dixon incorrectly models as increased liver fat. Quantitative IDEAL accounts for changes in T2* and should be the preferred sequence for fetal water-fat separated imaging in the third trimester.Acknowledgements
Grant support from the Children's Health Research Institute, the University of Western Ontario, the Natural Sciences and Engineering Research Council of Canada, and the Canadian Institutes of Health Research.References
1. Brumbaugh, D.E., Tearse, P., Cree-Green, M., et al., Intrahepatic fat is increased in the neonatal offspring of obese women with gestational diabetes. J Pediatr. 2013. 162(5): p. 930-6 e1.
2. Ma, J., Breath-hold water and fat imaging using a dual-echo two-point Dixon technique with an efficient and robust phase-correction algorithm. Magn Reson Med. 2004. 52(2): p. 415-9.
3. Ma, J., Dixon techniques for water and fat imaging. J Magn Reson Imaging. 2008. 28(3): p. 543-58.
4. Hines, C.D., Frydrychowicz, A., Hamilton, G., et al., T(1) independent, T(2) (*) corrected chemical shift based fat-water separation with multi-peak fat spectral modeling is an accurate and precise measure of hepatic steatosis. J Magn Reson Imaging. 2011. 33(4): p. 873-81.
5. Meisamy, S., Hines, C.D.G., Hamilton, G., et al., Quantification of Hepatic Steatosis with T1-independent, T2*-corrected MR Imaging with Spectral Modeling of Fat: Blinded Comparison with MR Spectroscopy. Radiology. 2011. 258(3): p. 767-775.
6. Yu, H., Shimakawa, A., Hines, C.D., et al., Combination of complex-based and magnitude-based multiecho water-fat separation for accurate quantification of fat-fraction. Magn Reson Med. 2011. 66(1): p. 199-206.
7. Goitein, O., Eshet, Y., Hoffmann, C., et al., Fetal liver T2* values: defining a standardized scale. J Magn Reson Imaging. 2013. 38(6): p. 1342-5.
Figures