4817
Histogram analysis of intravoxel incoherent motion parameters in assessing tumour diffusion and perfusion heterogeneity in cervical cancer before and after chemoradiotherapy1Department of Diagnostic Radiology, The University of Hong Kong, Hong Kong, Hong Kong, 2Department of Health Technology and Informatics, The Hong Kong Polytechnic University, Hong Kong, 3University of California, Berkeley, CA, United States, 4Philips Healthcare, Hong Kong, Hong Kong
Synopsis
Histogram analysis of intravoxel incoherent motion (IVIM) diffusion-weighted MRI (DWI) could be a promising quantitative approach in assessing tumour heterogeneity. We retrospectively studied twenty-five patients with cervical cancer who had paired IVIM MRI examinations before and at week-4 of chemoradiotherapy treatment (CRT). We observed histogram skewness and kurtosis significantly decreased while mean and all percentiles significantly increased in apparent diffusion coefficient (ADC), true diffusion coefficient (D) and perfusion fraction (f) following treatment. Furthermore, these significant differences were not correlated with a change in primary tumour volume (PTV) following treatment.
Purpose
Tumour heterogeneity is known to critically influence treatment outcome. The purpose of this study was to determine how the distribution of IVIM parameters change following CRT, to determine if these changes were correlated with changes in PTV, and to evaluate the ability of histogram analysis to evaluate tumour heterogeneity.Methods
Twenty-five patients with newly diagnosed cervical cancer were prospectively recruited. All patients received whole-pelvis radiotherapy and concurrent chemotherapy (CRT) as the primary treatment. Two sequential MRI examinations were performed on 3.0T Achieva TX scanner, Philips Healthcare at pre-treatment (MRI-1) and week-4 of CRT (MRI-2). DWI was acquired using single-shot spin-echo echo-planar imaging in free breathing with background body signal suppression (b=0-1000 s/mm2). Parametric maps of ADC were generated; D and f maps were calculated using non-linear least squares (NLLS) Levenberg-Marquardt algorithm in MATLAB (R2016a, The Mathworks Inc.). Volumetric regions of interest (VOIs) were placed to encompass the whole tumour volume and histogram parameters (skewness, kurtosis, mean, percentiles) were calculated. Primary tumour volume (PTV) was evaluated on the sagittal T2-weighted images. Student’s t-test was used to compare histogram indices of ADC, D and f before and after treatment. Spearman’s rank correlation test was used to assess correlation between the change in PTV and changes in histogram indices of IVIM parameters. Student’s t-test was used to compare the differences between the histogram indices of ADC and D at both time-points.Results
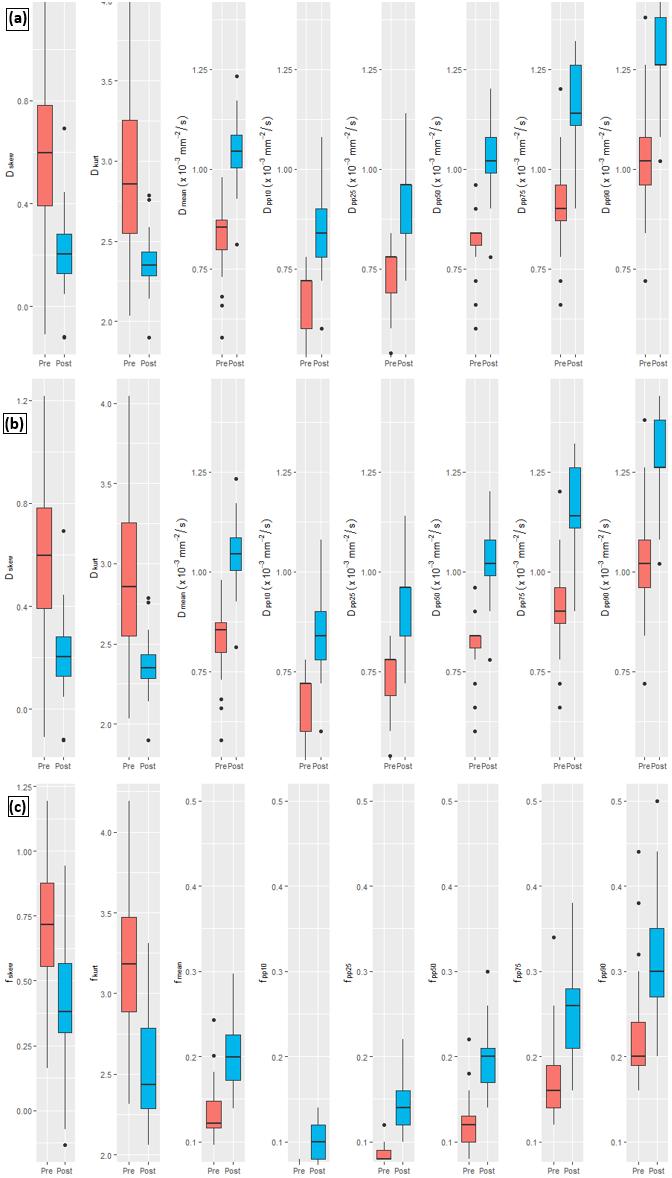
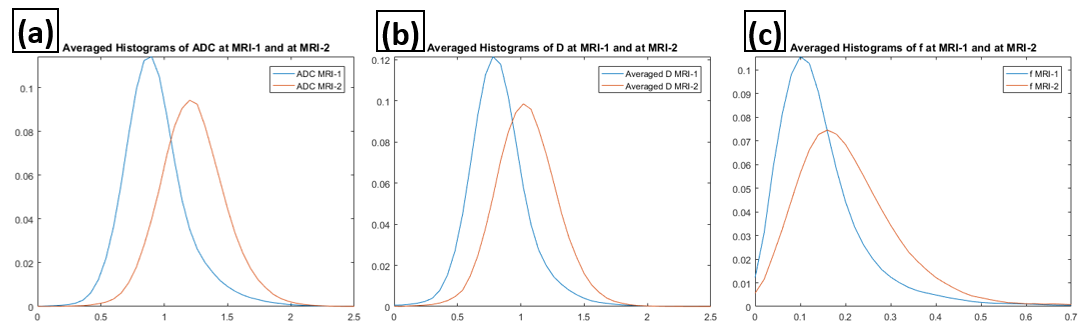
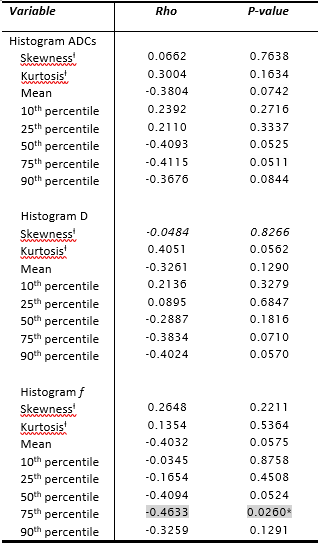
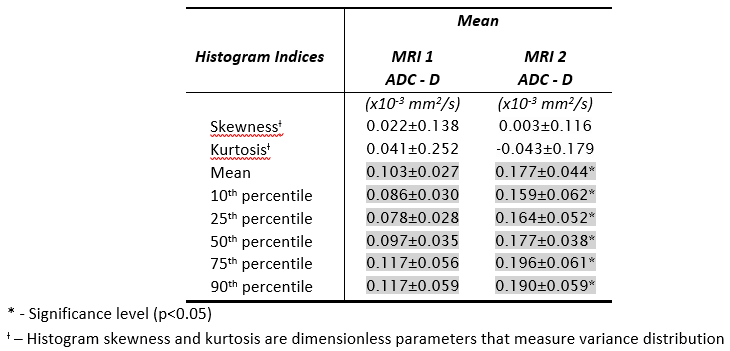
Twenty-four patients had residual tumour while one patient had no residual tumour at MRI-2. Following treatment, skewness and kurtosis were significantly lowered while mean and percentiles (10th, 25th, 50th, 75th, 90th) were significantly increased in ADC, D, and f as shown in Figure 1. Averaged histograms of ADC, D, and f at MRI-1 and at MRI-2 are plotted in Figure 2. Changes in the histogram indices of ADC, D and f were not correlated with changes in PTV, except f75 but the correlation was weak; results are tabulated in Table 1. The histogram skewness and kurtosis of ADC was not significantly different from those of D at both time-points. The mean and percentile indices of ADC were significantly larger than the corresponding indices of D at both time-points. It was additionally found that the degree of difference between ADC and D was significantly greater at MRI-2 compared to MRI-1; results are tabulated in Table 2.Discussion
A normal distribution would have kurtosis equal to three where increasing kurtosis results in sharper peaks and heavier tails. This may be interpreted as increasing image homogeneity as more pixels are concentrated in a narrower range of grey values. A normal distribution would have skewness equal to zero where increasing skewness results in increasingly left-shifted peaks. It is hypothesised that the effect of treatment is a reduction in the cellular density. The observed significant increase in the histogram mean and percentile indices of ADC and D following CRT are consistent with the literature [1] but the change in the distribution of diffusion patterns have not been well explored in cervical cancer. The observed significant decrease in kurtosis of following treatment implies that the diffusion profiles were initially highly concentrated at lower diffusivity levels and treatment caused the profile to become less concentrated with a shift to higher diffusivity levels. In the context of cervical cancer, f is thought to be indicative of perfusion within the tumour microcirculation [2, 3]. Significant differences in histogram indices of f, in the same pattern as ADC and D, indicates that CRT affects perfusivity in a similar manner. A lack of significant correlation between the change in histogram parameters and the change in PTV indicate that histogram analysis of IVIM parametric maps and PTV are independent measurements of tumour response. It is known that ADC overestimates D in-vivo [4, 5], but the results of this study show that ADC overestimates D significantly more in post-treatment than in pre-treatment scans. Furthermore, the significant differences in the histogram indices of f suggest that there are non-negligible perfusion differences [3], which may limit the efficacy of ADC in monitoring CRT response [6].Conclusion
Histogram analysis of IVIM parameters is a potentially useful technique in quantifying the spatial differences in diffusion and perfusion profiles of tumours before and after treatment.Acknowledgements
No acknowledgement found.References
1. Wang, J., et al., Head and Neck Lesions: Characterization with Diffusion-weighted Echo-planar MR Imaging 1. Radiology, 2001. 220(3): p. 621-630.
2. Lee, E.Y., et al., Relationship between intravoxel incoherent motion diffusion-weighted MRI and dynamic contrast-enhanced MRI in tissue perfusion of cervical cancers. J Magn Reson Imaging, 2015. 42(2): p. 454-9.
3. Lee, E.Y., et al., Perfusion and diffusion characteristics of cervical cancer based on intraxovel incoherent motion MR imaging-a pilot study. Eur Radiol, 2014. 24(7): p. 1506-13.
4. Kallehauge, J.F., et al., Apparent Diffusion Coefficient (ADC) as a quantitative parameter in diffusion weighted MR imaging in gynecologic cancer: Dependence on b-values used. Acta oncologica, 2010. 49(7): p. 1017-1022.
5. Le Bihan, D., et al., Separation of diffusion and perfusion in intravoxel incoherent motion MR imaging. Radiology, 1988. 168(2): p. 497-505.
6. Kuru, T.H., et al., Intravoxel incoherent motion (IVIM) diffusion imaging in prostate cancer-what does it add? Journal of computer assisted tomography, 2014. 38(4): p. 558-564.
Figures