4807
Measuring human placental blood flow with multi-delay 3D GRASE pseudo-continuous arterial spin labeling at 3 Tesla1Laboratory of FMRI Technology (LOFT), Mark & Mary Stevens Neuroimaging and Informatics Institute, Keck School of Medicine, University of Southern California, Los Angeles, CA, United States, 2Department of Radiology, David Geffen School of Medicine at UCLA, Los Angeles, CA, United States, 3Department of Pediatrics, David Geffen School of Medicine at UCLA, Los Angeles, CA, United States, 4Department of Obstetrics and Gynecology, Division of Perinatology, David Geffen School of Medicine at UCLA, Los Angeles, CA, United States
Synopsis
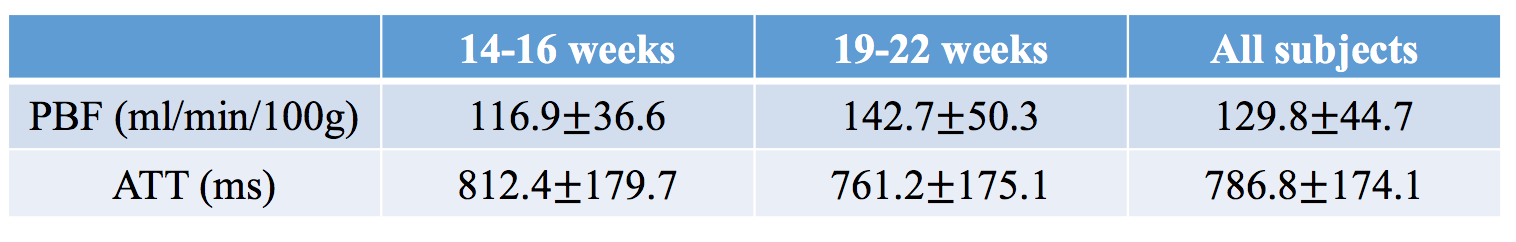
We presented a multi-delay pCASL combined with inner-volume GRASE imaging technique to measure placental blood flow (PBF) and arterial transit time (ATT) simultaneously, and report PBF and ATT evolution along different gestational ages during the second trimester. More blood flew through placenta with a slightly shorter transit time was seen with fetal development. Overall, PBF and ATT for the second trimester were 129.8±44.7 ml/min/100g and 786.8±174.1 ms respectively.
Purpose
Placenta supports pregnancy by providing the developing fetus with nutrients and oxygen via maternal blood supply. As a highly vascularized organ, placental perfusion is one of the most important indices to gauge placental function which affects fetal development. Here we present a multi-delay pCASL combined with fast 3D inner-volume GRASE imaging technique to measure placental blood flow (PBF) and arterial transit time (ATT) simultaneously, and report PBF and ATT evolution along different gestational ages during the second trimester.Methods
Thirteen normal pregnant women were scanned on Siemens 3T scanners (Prisma and Skyra; Siemens Healthcare, Erlangen, Germany) after they provided informed consent according to a protocol approved by the UCLA Institutional Review Board (IRB). Each subject was scanned twice within the second trimester, and the first and second MRI scans were conducted between 14-16 weeks and 19-22 weeks of pregnancy, respectively. Placental perfusion was measured using single-shot pseudo-continuous arterial spin labeling (pCASL) with inner-volume Gradient-and Spin Echo (GRASE) imaging at four post-labeling delays: 500, 1000, 1500 and 2000 ms. Background suppression (BS) was applied with two non-selective inversion pulses within the post-labeling delay following a whole volume saturation at the beginning [1]. Imaging parameters were: FOV=289mm, 8 slices with 20% slice oversampling, resolution=3×3×3mm3, bandwidth=2604 Hz/pixel, echo spacing=0.49ms, TE=36.5ms, TR=4000ms, label/control duration=1500ms, each PLD contained 14 repetitions and one M0 scan with a total scan time of 2min 4sec. Inner volume excitation was applied to avoid the signal wrapping around along phase encoding direction [2]. Subjects were breathing normally during all scans.
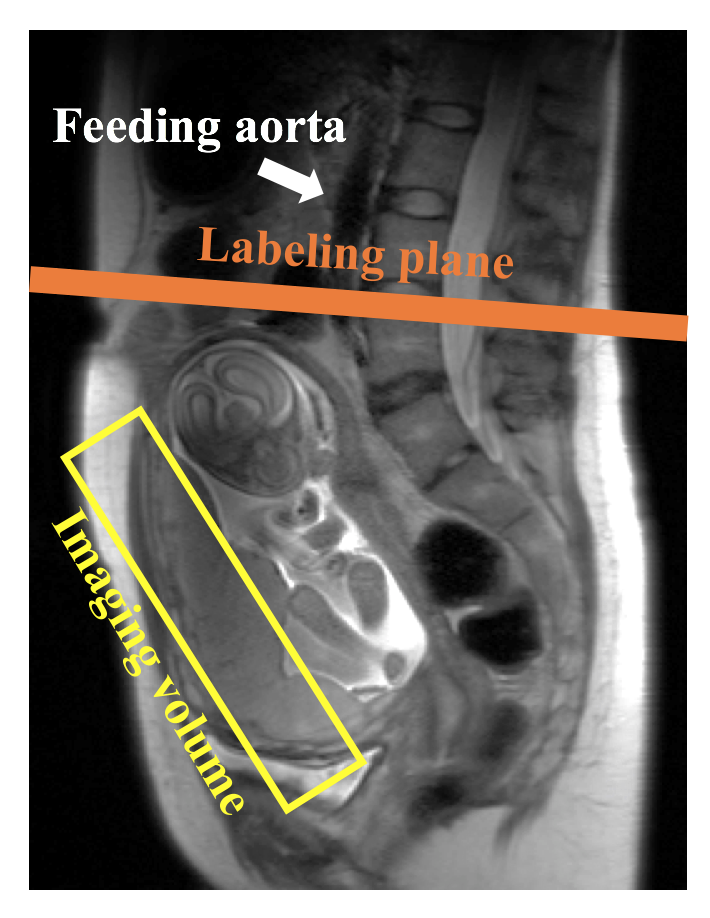
As shown in Figure 1, the imaging volume was selected as perpendicular to the maternal-fetal axis and labeling plane was placed perpendicular to the feeding aorta. GRASE images were corrected for non-rigid body motion using ANTs (Advanced Normalization Tools). Perfusion signal was measured in hand-drawn ROIs. Voxel-wise ATT was calculated by weighted delay method according to [3], and PBF was calculated as described in [4]. Four subject data sets were excluded due to severe motion.
Results and discussion
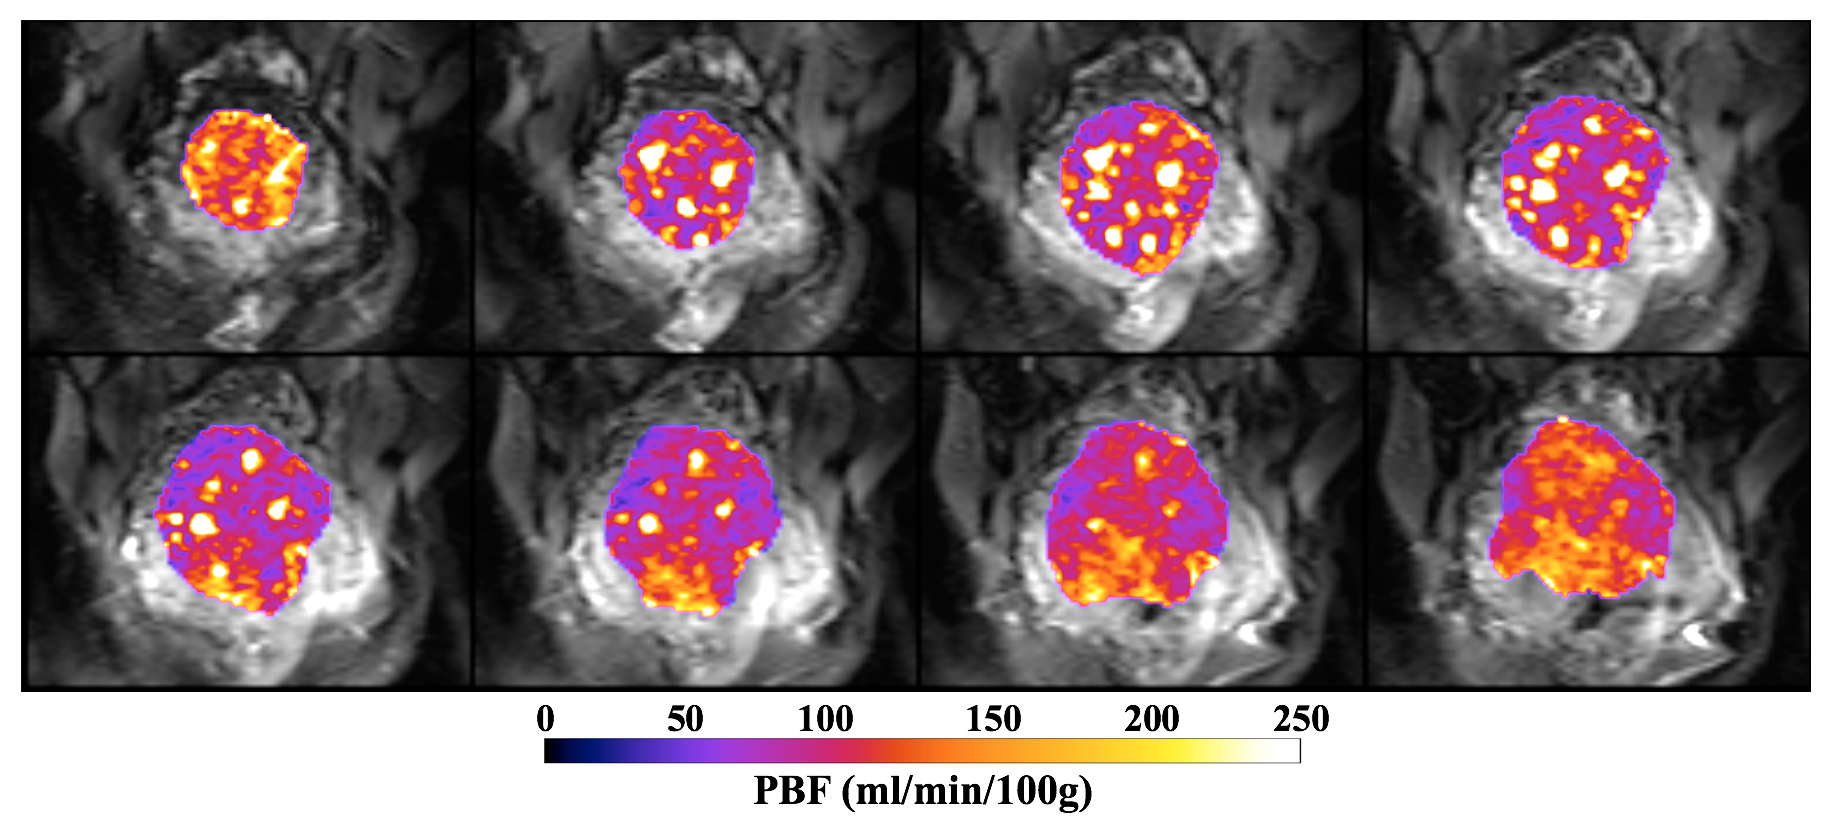
Figure 2 shows one representative PBF map overlaid on the T2-weighted structural image measured by GRASE sequence. Heterogeneity of perfusion indicates the vascular structure in placenta, which is not seen in T2-weighted images.
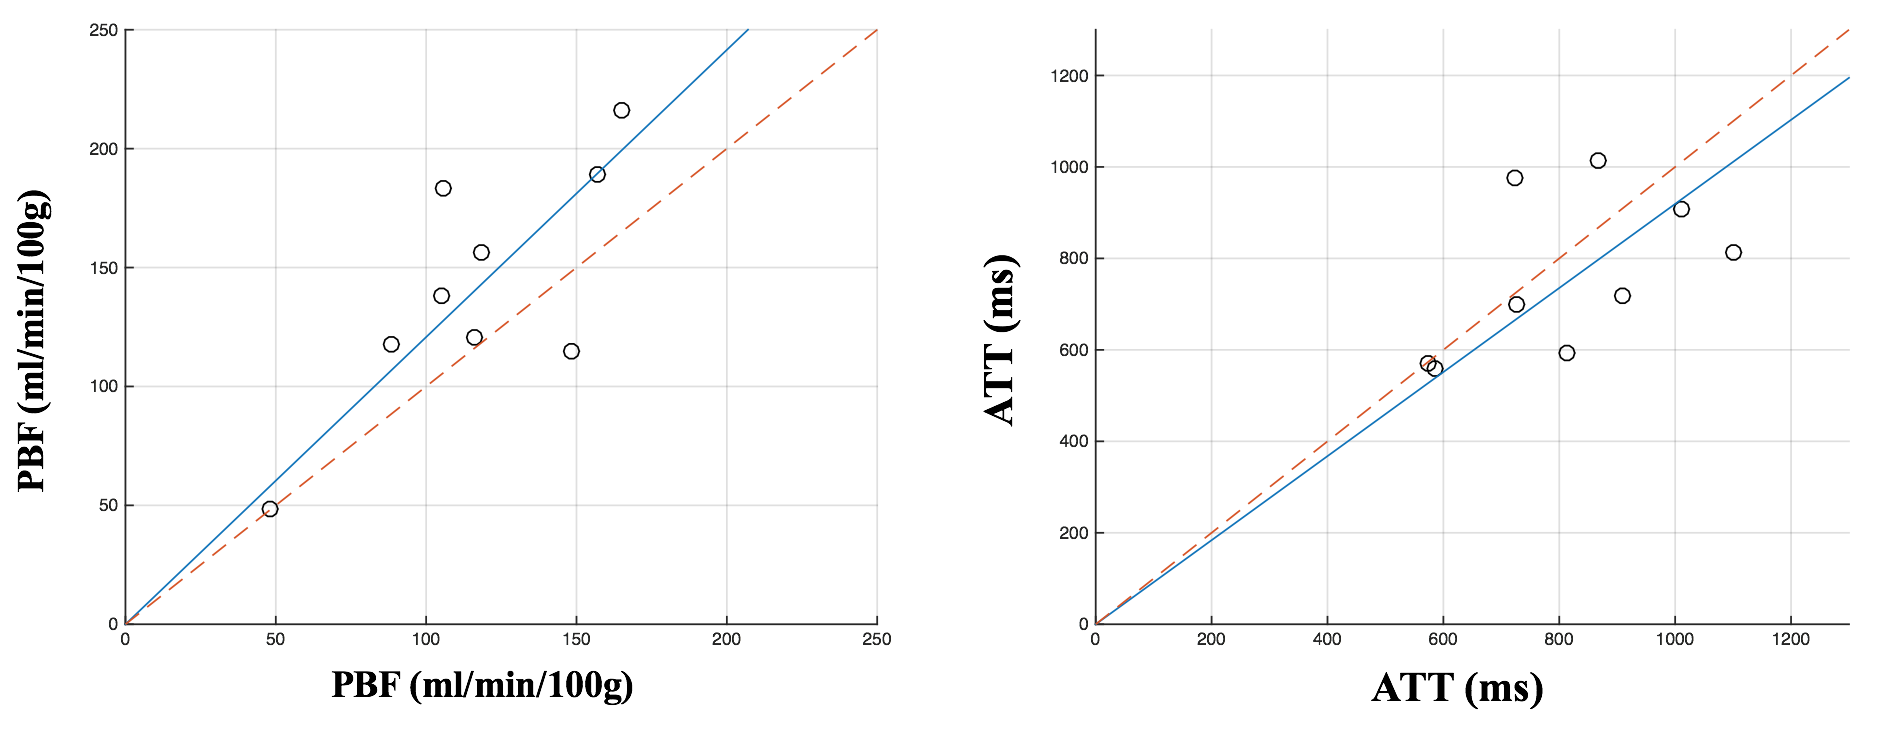
Nine subjects with repeated scans were analyzed for their PBF and ATT variations with placental development, the results are illustrated in Figure 3. PBF increased in eight subjects and ATT decreased in seven subjects in the second scan (19-22 weeks) compared to the first scan (14-16 weeks), the average PBF increase and ATT decrease were 22.5% and 4.6% respectively, indicating that more blood flew through placenta with a slightly shorter transit time was seen with fetal development. Mean and standard deviation of PBF and ATT values were calculated for each scan group as well as for all participant subjects, as summarized in Table. 1. Overall, PBF and ATT for the second trimester were 129.8±44.7 ml/min/100g and 786.8±174.1 ms respectively, which match the literature [5].
With 3D encoding, increased signal-to-noise ratio (SNR) and high spatial resolution placental perfusion measurement were possible within a limited time. Motion from respiration and fetal movement is still the major limitation, while the background suppression and non-rigid motion registration helped to eliminate the background noise from motion and other system instabilities.
Conclusion
We proposed using single-shot 3D pCASL to measure placental perfusion with high SNR, which is applicable to a wide range of clinical applications such as detection of placental morphology and prediction of fetal developmental aberrations.Acknowledgements
This work was funded by NIH U01-HD087221.References
[1] Maleki N, et al. Magnetic Resonance Materials in Physics, Biology and Medicine, 2012, 25(2): 127-133. [2] Feinberg D A, et al. MRM, 1990, 13(1): 162-169. [3] Dai W, et al. MRM, 2012, 67(5): 1252-1265. [4] Wang D J J, et al. NeuroImage: Clinical, 2013, 3: 1-7. [5] Gowland, et al. MRM 40.3 (1998): 467-473.Figures