4799
3T Restriction Spectrum Imaging Association with Prostate Cancer Gleason Score, PI-RADS v2 Score and Tumor Diameter on Whole Mount 3D-Mold-Sectioned Histopathology1Radiological Sciences, UCLA, Los Angeles, CA, United States, 2Radiological Sciences, UCSD, La Jolla, CA, United States, 3Radiology, Cornell University, New York, NY, United States, 4Pathology, UCLA, Los Angeles, CA, United States, 5Urology, UCLA, Los Angeles, CA, United States
Synopsis
Multiparametric MRI is becoming a crucial imaging for prostate cancers. A novel advanced, diffusion-based technique, restriction spectrum imaging (RSI) has been applied for prostate cancer imaging recently. In this work we will investigate the RSI performance in prostate cancer evaluation verified by post-surgery whole mount histopathology slides.
Introduction
Multi-parametric MRI (MP-MRI) has recently been very popular for detecting, localizing, staging, targeted biopsy, focal therapies and monitoring of prostate cancer. Restriction Spectrum Imaging (RSI), a novel advanced diffusion imaging technique initially used in brain cancer detection, has also recently been applied as a part of clinical MP-MRI of prostate cancer.Purpose
In this work, we evaluate restriction spectrum imaging(RSI), in prostate cancer(CaP) imaging, in terms of association with aggressiveness, Prostate Imaging Reporting and Data System version2 (PI-RADSv2) and tumor diameter, with post- radical prostatectomy (RP) whole mount histopathology (WMHP) verification as reference.Material and Methods
In an IRB approved, HIPAA compliant retrospective study of 30 men who underwent prostate multi-parametric MRI(mpMRI) prior to RP, RSI sequence was processed and generated as normalized cellularity index. A 3D patient-specific mold was printed to precisely fit the excised prostate based on MRI prostate segmentation. A pathologist contoured each tumor on all WMHP slides. Slides were obtained after RP and each individual CaP focus was marked, measured and assigned Gleason Score(GS) blinded to MRI. Corresponding cancerous regions of interest (ROIs) were drawn on RSI and paired with benign ROI on same prostate zone as control. RSI Z-score mean and PI-RADSv2 were assigned per ROI. Kruskal-Wallis and Wilcoxon Rank Sum tests were performed and p<0.05 considered significant.Results
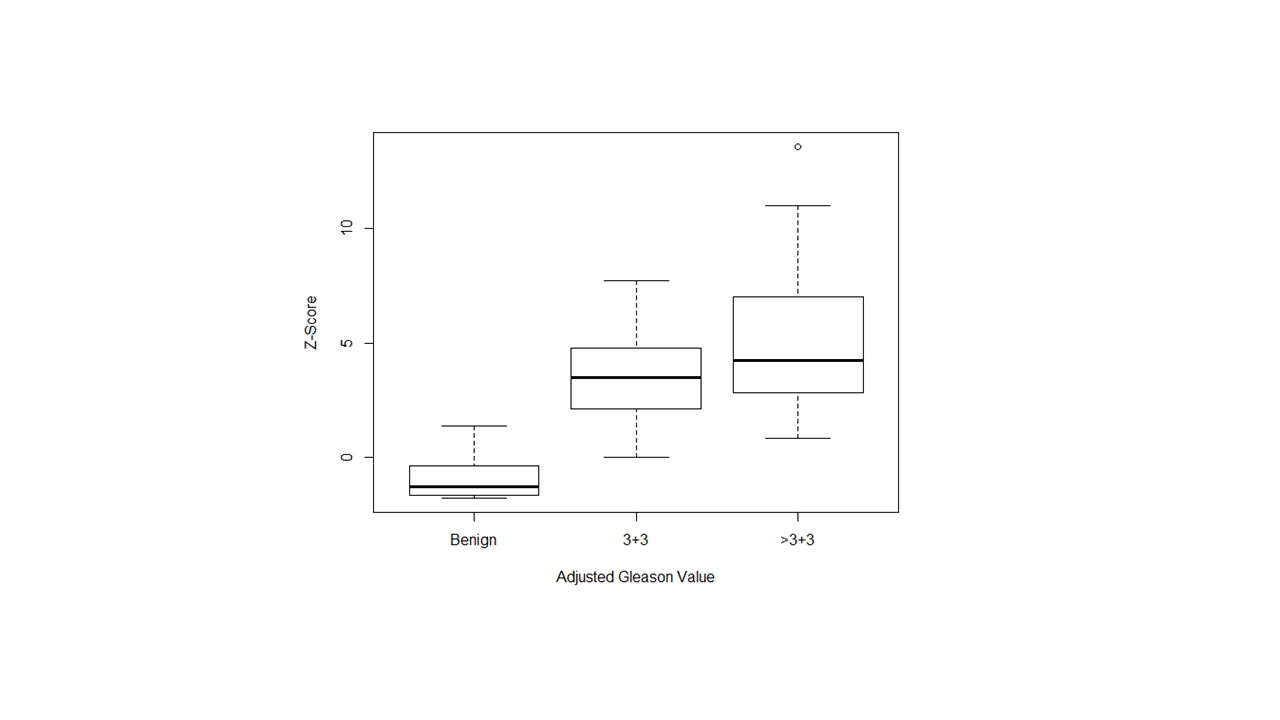
Of 55 proven CaP foci on WMHP of 30 patients, 23 (41.8%) were GS=3+3 and 32(58.2%) were GS≥3+4. Median(IQR) of Z-score was 4(2.5-5.8) in all CaP ROIs (p<0.001). Median(IQR) of Z-scores in benign control ROIs, GS=3+3 and GS≥3+4 were -1.29 (-1.67- -0.40), 3.48(2.10- 4.77) and 4.23(2.86-7) respectively (p<0.001). Median Z-score(IQR) in CaP foci<1cm was 2.2(1.1-4.1) and ≥1cm was 4.3(2.9-6.7) (p=0.008). Of 55 CaP foci, blind to RSI, mpMRI had called 29 (52.7%) normal (PI-RADS= 1), 5 (11%) mildly to moderately suspicious (PI-RADS= 2,3) and 21(38.2%) highly to very highly suspicious (PI-RADS= 4,5) ROIs with corresponding median(IQR) Z-scores of 2.66(1.3-3.6), 4.43(1.87-5.48) and 6.49(4.4-7.78) respectively (p<0.001).Conclusion
The RSI-MRI normalized cellularity index is associated with CaP grade, size of tumor on pathology and suspicious level of target determined by PI-RADS v2.Acknowledgements
This work was supported by funds from the Integrated Diagnostics Program, Department of Radiological Sciences & Pathology, David Geffen School of Medicine at UCLA.References
1. Brunsing RL, Schenker-Ahmed NM, White NS, et al. Restriction spectrum imaging: An evolving imaging biomarker in prostate MRI. J Magn Reson Imaging 2016.
2. Liss MA, White NS, Parsons JK, et al. MRI-Derived Restriction Spectrum Imaging Cellularity Index is Associated with High Grade Prostate Cancer on Radical Prostatectomy Specimens. Front Oncol 2015; 5:30.
3. Le JD, Tan N, Shkolyar E, et al. Multifocality and prostate cancer detection by multiparametric magnetic resonance imaging: correlation with whole-mount histopathology. Eur Urol 2015; 67:569-576.
4. Tan N, Margolis DJ, Lu DY, et al. Characteristics of Detected and Missed Prostate Cancer Foci on 3-T Multiparametric MRI Using an Endorectal Coil Correlated With Whole-Mount Thin-Section Histopathology. AJR Am J Roentgenol 2015; 205:W87-92.
5. McCammack KC, Kane CJ, Parsons JK, et al. In vivo prostate cancer detection and grading using restriction spectrum imaging-MRI. Prostate Cancer Prostatic Dis 2016; 19:168-173.
6. McCammack KC, Schenker-Ahmed NM, White NS, et al. Restriction spectrum imaging improves MRI-based prostate cancer detection. Abdom Radiol (NY) 2016; 41:946-953.
7. Yamin G, Schenker-Ahmed NM, Shabaik A, et al. Voxel Level Radiologic-Pathologic Validation of Restriction Spectrum Imaging Cellularity Index with Gleason Grade in Prostate Cancer. Clin Cancer Res 2016; 22:2668-2674.
8. Rakow-Penner RA, White NS, Parsons JK, et al. Novel technique for characterizing prostate cancer utilizing MRI restriction spectrum imaging: proof of principle and initial clinical experience with extraprostatic extension. Prostate Cancer Prostatic Dis 2015; 18:81-85.
9. Priester A, Natarajan S, Khoshnoodi P, et al. Magnetic Resonance Imaging Underestimation of Prostate Cancer Geometry: Use of Patient Specific Molds to Correlate Images with Whole Mount Pathology. J Urol 2016.
10. White NS, McDonald C, Farid N, et al. Diffusion-weighted imaging in cancer: physical foundations and applications of restriction spectrum imaging. Cancer Res 2014; 74:4638-4652
Figures