4794
Magnetic Resonance Elastography of the Prostate: Impact of Driver Size on Image Quality1Department of Radiology, the Third Affiliated Hospital, Sun Yat-sen University (SYSU), Guangzhou, People's Republic of China, 2Department of Radiology, Mayo Clinic, Rochester, United States, 3Department of Urology, the Third Affiliated Hospital, Sun Yat-sen University (SYSU), Guangzhou, People's Republic of China
Synopsis
Conventional prostate MRE uses an external driver located on the surface of the body to transmit shear waves into the prostate. However, the conventional large-diameter driver produces poorer image quality at higher frequencies. In this study we compared the performance of a large- and small-diameter Pelvic Wall driver at multiple frequencies using 2D and 3D MRE. Our results show that the smaller Pelvic Wall driver performs better than the larger driver in terms of image quality and success rate.
Purpose
Prostate cancer (PCa) is the most common malignancy among males in the western world1. Multiparametric magnetic resonance imaging has emerged as one of the most promising imaging modalities for the detection, localization and staging of PCa2. Magnetic resonance elastography (MRE), as a noninvasive method to measure mechanical properties of tissue, has shown promising results in the detection and characterization of Pca2,3. The aim of our study was to evaluate the feasibility of trans-pelvic MRE of the prostate and compare the results using the standard “large-diameter” passive Resoundant driver (18.5 cm in diameter) developed for liver MRE and a novel, prototype “small-diameter” Pelvic Wall driver(11.5 cm in diameter).Methods
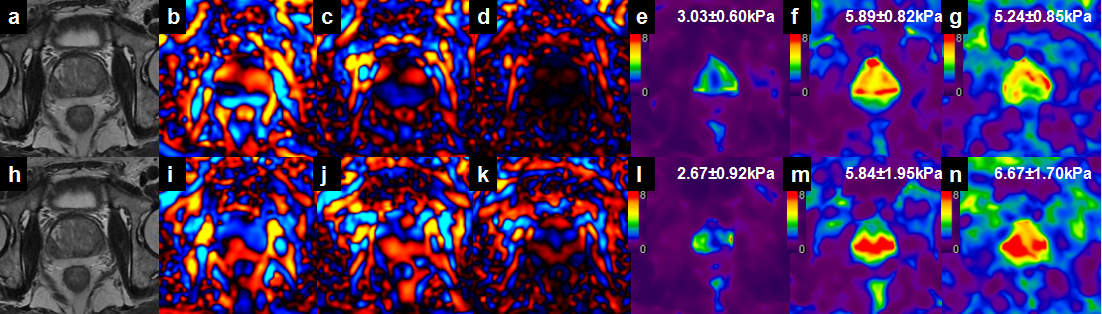
This study was approved by our hospital’s IRB. From June 2016 to October 2016, this preliminary study enrolled 30 patients, including 8 patients with benign prostatic hyperplasia and 9 patients with PCa proven by biopsy, and 13 patients had no biopsy. The large- and small-diameter drivers were separately placed at the level of the public symphysis and secured with a rubber belt. The large driver was produced by Resoundant, Inc. (Rochester, MN), while the small Pelvic Wall driver was developed by Mayo Clinic (Rochester, MN). MRE was performed on a 3.0T scanner with a free-breathing, multi-slice, single-shot, flow-compensated, spin-echo EPI MRE sequence. 2D and 3D MRE at vibration frequencies of 60, 90, and 120 Hz were acquired. The MRE phase images were processed using the multimodel direct inversion algorithm (MMDI) for 2D MRE and a 3D direct inversion algorithm (DI) for 3D MRE4,5. Two radiologists assessed the image quality of MRE based on the wave images. The failure of MRE was defined as visually undetectable wave propagation in the prostate. Regions of interest (ROIs) were drawn in the prostate and adjusted to exclude areas near the prostate edges and with significant wave interference. The confidence value within the ROI from the 2D and 3D algorithms was recorded. The Mann-Whitney U test was used to compare the confidence values between the two drivers. The Kruskal-Wallis test with post hoc testing was used to compare the confidence values among different frequencies.Results
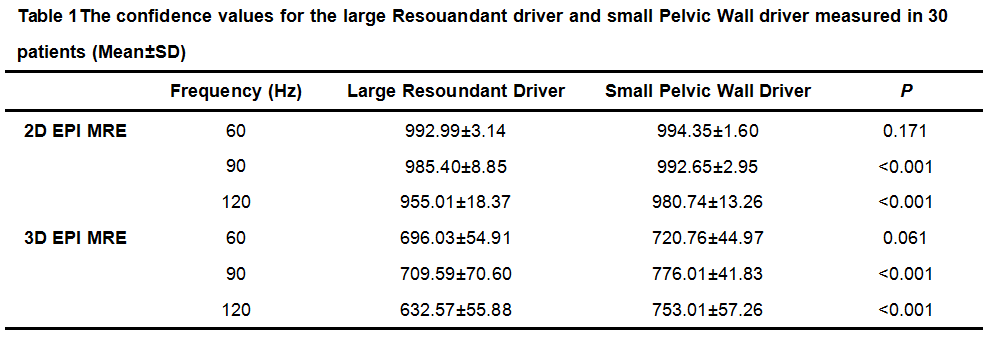
The mean age was 68.5±9.0 years, the mean body mass index was 22.59±3.6kg/m2, and the mean prostate volume was 42.3±28.7ml. At a frequency of 60Hz, mechanical waves were produced in the prostate gland in all patients using both drivers. At a frequency of 90Hz, 6 cases (6/30) with the large driver failed and no cases with the small driver failed. At a frequency of 120Hz, 28 cases(28/30) with the large driver failed, while only 3 cases (3/30) with the small driver failed. Comparisons of the confidence values using the two drivers are shown in Table 1. The confidence values using the small driver were significantly higher than those with the larger driver at 90Hz (P<0.001) and 120Hz(P<0.001) using 2D and 3D MRE processing. There was no significant difference between the two drivers at 60Hz (P>0.05) for either 2D or 3D MRE. With 2D MRE, the confidence values using the larger driver at 60Hz were significantly higher than those at 90Hz (P<0.001) and 120Hz(P<0.001). The confidence values using the smaller driver at 60Hz were also higher than those at 120Hz(P<0.001), but not at 90 Hz. With 3D MRE, the confidence values using both drivers at 90Hz were significantly higher than those at 60 Hz (P=0.001) and 120 Hz(P<0.05).Discussion
Conventional prostate MRE usually uses an external driver located on the surface of the body to transmit shear waves into the prostate6,7. The prostate gland is a deep-seated organ, so higher-frequency shear waves are rapidly attenuated in the soft tissues and only low-frequency (below ~65Hz) shear waves reach the prostate7. However, the wavelength of low-frequency shear waves is about the same size as the prostate, making it difficult to resolve small regions of increased stiffness within the prostate gland. The conventional, large-diameter driver can provide good wave image quality at relatively lower frequencies. Our study shows there are advantages to using a smaller diameter driver for prostate MRE in terms of image quality compared for both 2D and 3D MRE at 90 and 120Hz. Our study also showed that the confidence values at 90Hz were higher than those at 60 and 120Hz in 3D MRE. The smaller Pelvis Wall driver might improve the performance and clinical acceptance of prostate MRE, especially for 3D MRE at 90Hz.Conclusion
Our results show that a smaller Pelvis Wall driver has the potential to improve the performance and success rate of prostate MRE compared to using a larger diameter driver.Acknowledgements
No acknowledgement found.References
1.Torre LA, Bray F, Siegel RL, et al. Global cancer statistics, 2012. CA Cancer J Clin.2015;65(2):87-108.
2. Li S, Chen M, Wang W, et al. A feasibility study of MR elastography in the diagnosis of prostate cancer at 3.0T. ActaRadiol.2011;52(3):354-358
3. Arani A, Da Rosa M, Ramsay E, et al. Incorporating endorectal MR elastography into multi-parametric MRI for prostate cancer imaging: initial feasibility in volunteers. J MagnReson Imaging.2013;38(5):1251-1260.
4. Shi Y, Glaser KJ, Venkatesh SK, et al., Feasibility of using 3D MR elastography to determine pancreatic stiffness in healthy volunteers. J MagnReson Imaging. 2015;41(2):369-75.
5. Dzyubak B, Glaser K, Yin M, et al., Automated liver stiffness measurements with magnetic resonance elastography. J MagnReson Imaging 2013;38(2):371-9.
6. Pepin KM, Ehman RL, McGee KP. Magnetic resonance elastography (MRE) in cancer: technique, analysis, and applications. Prog Nucl Magn Reson Spectrosc. 2015;90-91:32-48.
7. Kemper J, Sinkus R, Lorenzen J, et al. MR elastography of the prostate: initial in-vivo application. Rofo.2004;176(8):1094-1099.
Figures