4793
Linking a multi-compartment T2 model to diffusion microstructure in prostate cancer1Centre for Medical Imaging, University College London, London, United Kingdom, 2Centre for Medical Image Computing, University College London, London, United Kingdom
Synopsis
This work develops a multi-compartment T2 model for prostate imaging. We investigate whether this model can provide information about differences in tissue microstructure, such as those between normal prostate tissue and tumour, by comparing it to the VERDICT diffusion model6. The high correlations found between a number of the parameters suggest that the proposed model is capable of detecting some microstructural differences. In the future this method may be able to provide different and complementary microstructural information to current diffusion models.
Purpose
A recent study1 found high correlations between Gleason pattern and stromal, epithelial and luminal volumes in prostate cancer. One method for investigating such histological changes is to fit a multi-compartment model to multi-echo T2 data2-5. We have developed a model where the distribution of T2 values is constrained to be two Gaussian distributions, one representing stromal and epithelial cells (short T2 component) and the other representing luminal space (long T2 component)3. We investigate whether this multi-compartment T2 model can provide information about tissue microstructure by comparing it to the VERDICT diffusion model6, which uses diffusion data to separate tissue compartments. We also examine whether the proposed model can differentiate between tumour and normal tissue, investigating its potential as a detection tool.
Methods
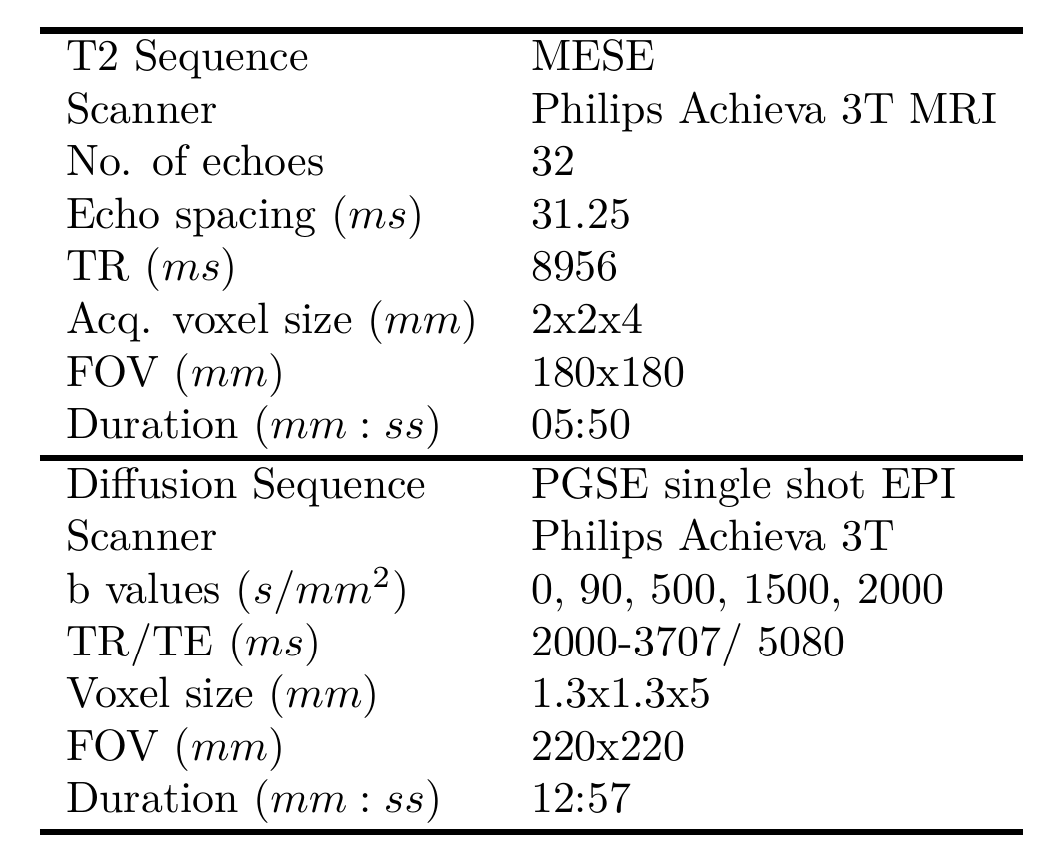
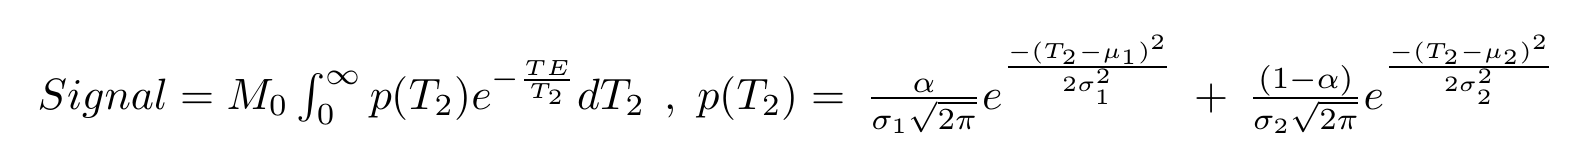
The parameters of the multi-echo T2 and VERDICT diffusion scans are included in Figure 1. Five subjects were imaged for this study. A board certified radiologist contoured the five lesions observed in two patients, which were confirmed to be cancers following targeted biopsy. Regions of interest (ROIs) were also placed in areas of normal tissue in each of the five subjects. The VERDICT model was fit to the diffusion data as described previously7. The T2 model assumed that each voxel contained a distribution of T2 values that form two Gaussians, the equation for which is in Figure 2. For each voxel we estimate six parameters: overall scaling (M0), relative fraction between the two compartments (α), mean and standard deviation of the short T2 peak (μ1 and σ1) and mean and standard deviation of the long T2 peak (μ2 and σ2). The Luminal Water Fraction (LWF), as discussed in previous work4, was also processed for each voxel after fitting. It is calculated as the area under the long T2 component divided by the area under both components. Maps of the VERDICT parameters (cell radius (R), cellularity, extra-cellular extra-vascular fraction (fEES), intra-cellular fraction (fIC) and vascular fraction (fVASC)) and the parameters of the multi-compartment T2 model were produced. Correlations between mean parameter values for both tumour and normal ROIs were computed for both models. A Kruskal-Wallis test was used to investigate whether the multi-compartment T2 model can differentiate between regions of normal tissue and tumour (p<0.05 indicated significance).
Results
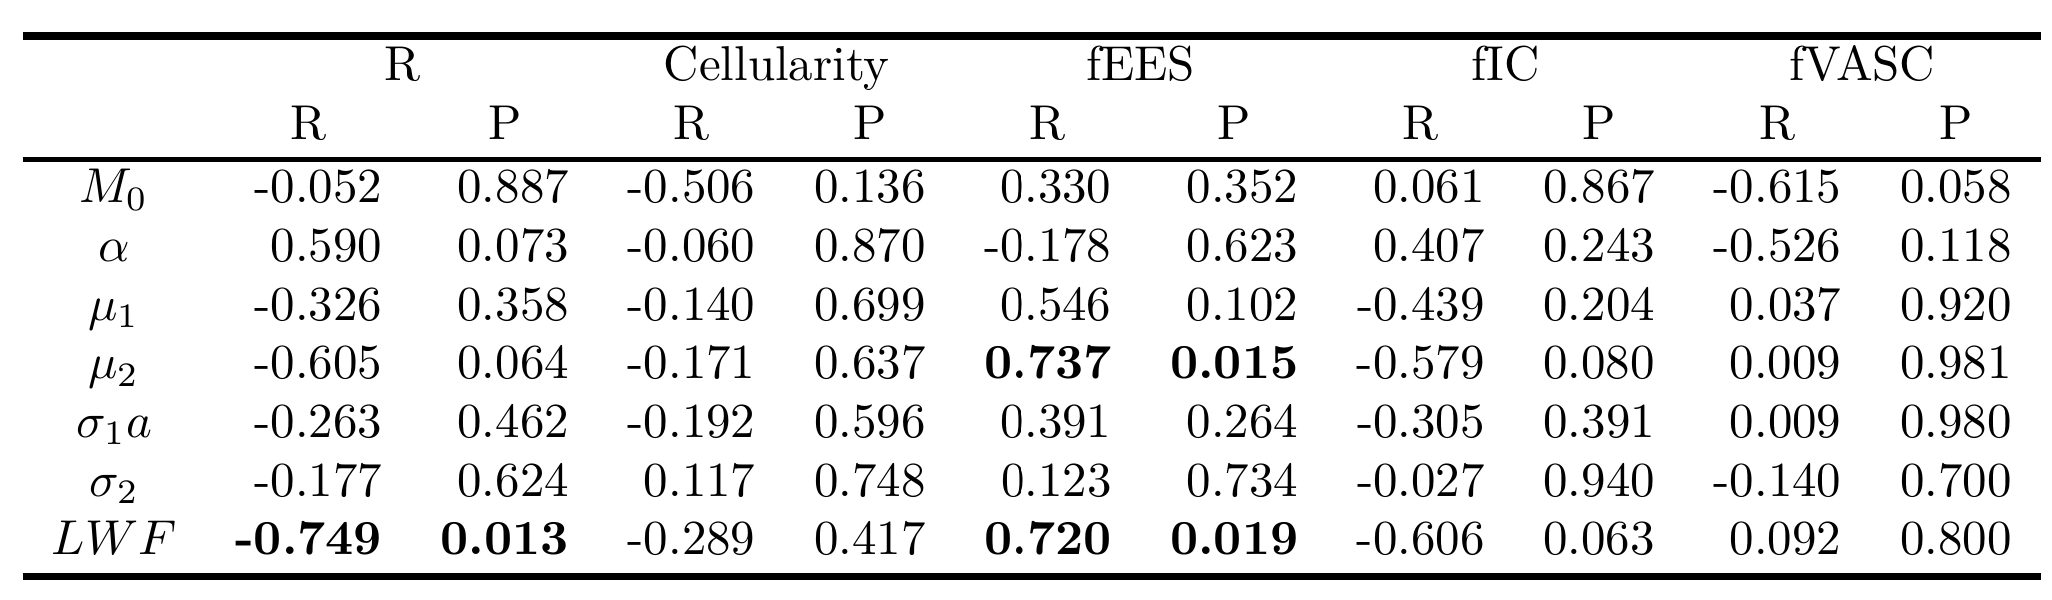
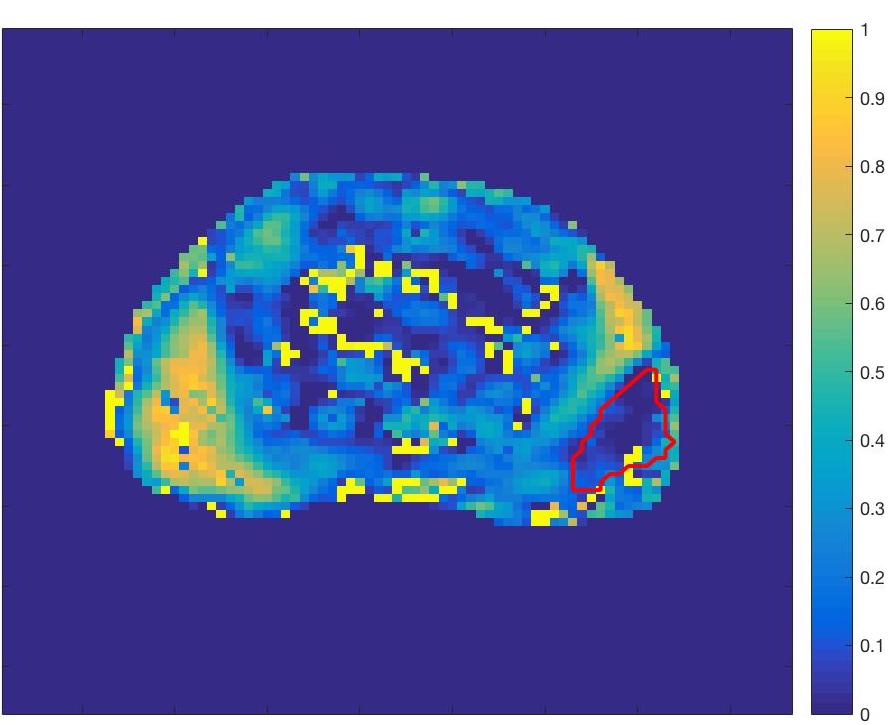
Figure 3 shows the correlations between each of the model parameters. There is a strong positive correlation between fEES and LWF, between R and LWF and between fEES and μ2. A Kruskal-Wallis test showed a significant difference between normal tissue and tumour in μ1, μ2 and LWF (p = 0.047,0.028,0.009). Figure 4 contains a map of the parameter LWF for one subject, showing that tumour (outlined in red) has a lower value of LWF than the highly luminal peripheral zone. This is likely to correspond with a decreased luminal tissue component, one of the hypothesised hallmarks of prostate cancer1.
Discussion & Conclusion
This multi-compartment T2 model suggests changes in LWF are consistent with findings from the VERDICT diffusion model. An interpretation of the results is that in PZ tumours, there is an increase in cell radius R with a corresponding reduction in extra-cellular extra-vascular space fEES and a decreased luminal water content. But importantly these correlations show that the model is detecting microstructural differences, showing promise in separating tumour from normal tissue. In diagnostic imaging both T2W and diffusion images are acquired to assess different tissue properties, suggesting they carry complementary information. In the future the proposed model might be used in conjunction with diffusion to better probe the tissue microstructure, as well as the multi-echo T2 acquisition being faster, less susceptible to motion and suffering fewer artefacts than diffusion MRI. We aim to expand this work by using a larger sample size and validating the model against histology in order to conclude its effectiveness in providing non-invasive estimates of tissue microstructure.
Acknowledgements
Cancer Research UK through the Comprehensive Cancer Imaging Centre.References
1. Chatterjee A., et al. "Changes in epithelium, stroma, and lumen space correlate more strongly with Gleason pattern and are stronger predictors of prostate ADC changes than cellularity metrics." Radiology 277, no. 3 (2015): 751-762.
2. Whittall K., et al. "In vivo measurement of T2 distributions and water contents in normal human brain." Magnetic Resonance in Medicine 37, no. 1 (1997): 34-43.
3. Storås T., et al. "Prostate magnetic resonance imaging: multiexponential T2 decay in prostate tissue." Journal of Magnetic Resonance Imaging 28, no. 5 (2008): 1166-1172.
4. Sabouri S., et al. " Luminal water imaging: a novel MRI method for prostate cancer diagnosis." In International Society for Magnetic Resonance in Medicine (ISMRM), http://www.ismrm.org/2016-annual-meeting-exhibition/.
5. Cheng K., et al. "In vivo tissue characterization of human brain by chisquares parameter maps: Multiparameter proton T2-relaxation analysis." Magnetic resonance imaging 12, no. 7 (1994): 1099-1109.
6. Panagiotaki E., et al. "Microstructural characterization of normal and malignant human prostate tissue with vascular, extracellular, and restricted diffusion for cytometry in tumours magnetic resonance imaging." Investigative Radiology 50, no. 4 (2015): 218-227.
7. Bonet-Carne E., et al. "Non-invasive quantification of prostate cancer using AMICO framework for VERDICT MR." In International Society for Magnetic Resonance in Medicine (ISMRM), no. EPFL-CONF-217122. 2016.
Figures