4792
Clinical Evaluation of a Simple Approach for Improving Shear Wave Illumination in Magnetic Resonance Elastography of the Prostate1Department of Radiology, the Third Affiliated Hospital, Sun Yat-sen University (SYSU), Guangzhou, People's Republic of China, 2Department of Radiology, Mayo Clinic, Rochester, United States, 3Department of Urology, the Third Affiliated Hospital, Sun Yat-sen University (SYSU), Guangzhou, People's Republic of China
Synopsis
Conventional prostate magnetic resonance elastography (MRE) is performed using an external driver to transmit shear waves into the prostate. It is a challenge to produce shear waves in the prostate with adequate amplitude at a suitably high frequency because the prostate is a deep-seated organ. We evaluated the hypothesis that the placement of a urinary catheter would improve the shear wave illumination of the prostate when waves are emitted from an external driver. Our results in 30 BPH patients show that the commercially available liver MRE driver used in combination with a catheter can improve MRE image quality at higher frequencies.
Introduction
Prostate cancer (PCa) is the most common cancer in men in Europe and the USA1. Multi-parametric magnetic resonance imaging (mp-MRI) has been a significant advance in the screening and evaluation of PCa, but MRI consistently underestimates the size and extent of prostate tumors, which can lead to unnecessary biopsy with associated patient anxiety, risk and additional costs2-4. Magnetic resonance elastography (MRE) provides tissue mechanical properties as promising biomarkers for assessing prostatic disease but its success in the prostate has been affected by the difficulty of producing suitable shear wave illumination in the prostate with external vibration sources, particularly at frequencies higher than approximately 60 Hz5-8.In this study, we evaluated the potential value of employing a simple urinary catheter to increase shear wave illumination of the prostate through mode conversion from longitudinal waves induced by the standard external MRE vibration source.Methods
This investigation was approved by our hospital’s IRB. 30 patients with biopsy-proven benign prostatic hyperplasia (BPH) were enrolled. 11 patients had a catheter (group 1) and 19 patients did not have a catheter (group 2). MRE was performed on a 3.0T scanner with a free-breathing, multi-slice, single-shot, flow-compensated, spin-echo EPI 2D-MRE sequence. The acquisition parameters were: vibration frequencies = 60, 90, and 120Hz, acquisition matrix = 80x80;TR/TE =1555.7-1667.2/48.0-56.3ms; scan time = 40 sec; 24-cm FOV; 20 3-mm axial slices with 1-mm gap. A rigid plastic passive driver (Resoundant Inc., Rochester, MN), normally used for liver MRE, was applied to the lower abdominal wall, partially overlapping the symphysis pubis. All patients from group 1 had conventional rubber urethral catheters in place at the time of examination. The MRE wave information was processed using the same stiffness-calculating algorithm that is used for liver MRE, which produces a “confidence map” indicating areas with relatively better wave information for analysis (on a scale of 0-1000 where 1000 represents noiseless data).The confidence map and anatomical images were used to select regions of interests(ROIs) in the central gland(CG) and the peripheral zone(PZ)of the prostate. The ROIs were drawn in the prostate gland avoiding areas with the prostatic catheter to measure the average confidence value, and were mapped to the elastograms (stiffness images) while avoiding the edges of the prostate and areas with wave interference and low wave SNR for the stiffness measurement. The mean prostate stiffness in kilopascals (kPa) was reported. The age, BMI, PSA, fPSA, prostate volume, the weighted average of the mean confidence value over the acquired slices, and the mean stiffness within the manually generated ROIs were compared at three different frequencies in the two groups. Statistical significance was defined as P<0.05.Results
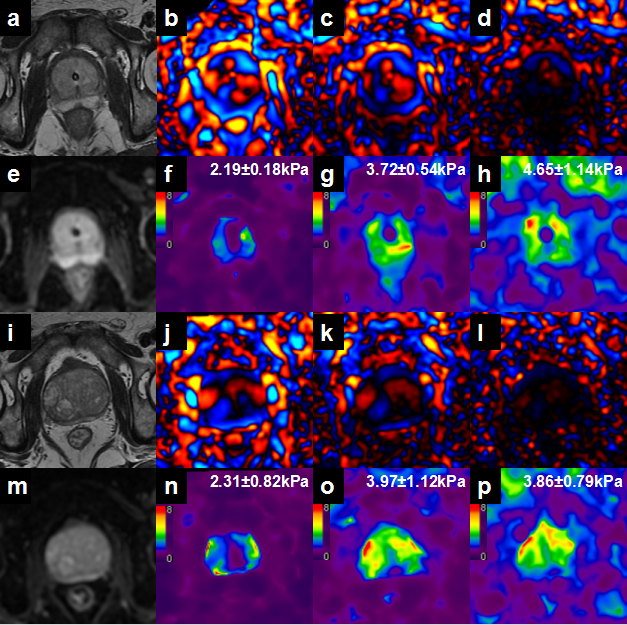
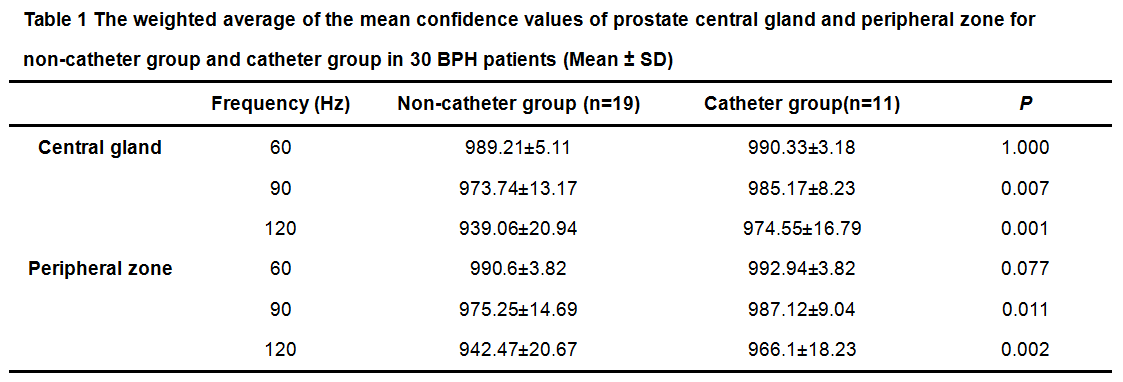
There was no statistically significant difference in age, BMI, PSA, fPSA, and prostate volume in the CG between the two groups, but the prostate volume in the PZ of the no-catheter group was higher than that in the catheter group(P=0.038). Waves were produced in the prostate gland in all patients at 60Hz and 90Hz, though the wave amplitude was very low near the urethra at 90Hz in both groups. There was only 1 case of failure in group1 at 120Hz (defined as visually undetectable wave amplitude in the prostate) (1/11, 9.09%) while there were 16 cases of failure in group 2 (16/19, 84.21%)(Figure 1). The weighted averages of the mean confidence values for 30 BPH patients with and without catheter were shown in Table 1; There was no statistically significant difference of the confidence and stiffness values measured in the CG and PZ using 60-Hz MRE. In patients with catheters at 90 and 120Hz, the confidence and stiffness values were greater than those values in patients without catheters(P= 0.002-0.011). For each group (with and without catheters), confidence values at 60 Hz were greater than those at 90 and 120 Hz (P<0.05).
Discussion
With an external driver, shear wave attenuation increases rapidly with frequency, limiting the maximum frequency for prostate MRE to about 60Hz. With a urinary catheter in place, MRE shear wave illumination of the prostate was significantly improved at higher frequencies (90 and 120 Hz). These results show that the presence of a conventional urinary catheter allows for more successful MRE exams up to 120 Hz, providing the potential for higher MRE spatial resolution and the evaluation of the frequency dispersion of tissue mechanical properties as a new biomarker for PCa.Conclusion
The presence of a simple urinary catheter improves the confidence and success rate of prostate MRE at higher vibration frequencies, providing new potential biomarkers for PCa and improved elastographic spatial resolution. Further development of this technique is warranted.Acknowledgements
No acknowledgement found.References
1. Renard-Penna R, Rouvière O, Puech P, et al. Current practice and access to prostate MR imaging in France.DiagnInterv Imaging. 2016 Jul 20. pii: S2211-5684(16)30145-0. doi: 10.1016/j.diii.2016.06.010. [Epub ahead of print].
2. Johnston E, Pye H, Bonet-Carne E,et al. INNOVATE: A prospective cohort study combining serum and urinary biomarkers with novel diffusion-weighted magnetic resonance imaging for the prediction and characterization of prostate cancer.BMC Cancer. 2016;16(1):816.
3. Priester A, Natarajan S, Khoshnoodi P, et al. Magnetic resonance imaging underestimation of prostate cancer geometry: use of patient specific molds to correlate images with whole mount pathology.J Urol. 2016, 30. pii: S0022-5347(16)30958-2. doi10.1016/j.juro.2016.07.084. [Epub ahead of print]
4. Weinreb JC, Barentsz JO, Choyke PL, et al. PI-RADS prostate imaging - reporting and data system: 2015, version 2. Eur Urol. 2016;69(1):16-40.
5. Pepin KM, Ehman RL, McGee KP. Magnetic resonance elastography (MRE) in cancer: technique, analysis, and applications. Prog Nucl Magn Reson Spectrosc.2015;90-91:32-48.
6. Arani A, Da Rosa M, Ramsay E, et al. Incorporating endorectal MR elastography into multi-parametric MRI for prostate cancer imaging: initial feasibility in volunteers. J Magn Reson Imaging. 2013;38(5):1251-1260.
7. Li S, Chen M, Wang W, et al. A feasibility study of MR elastography in the diagnosis of prostate cancer at 3.0T. ActaRadiol. 2011;52(3):354-358.8. Kemper J, Sinkus R, Lorenzen J, et al. MR elastography of the prostate: initial in-vivo application. Rofo. 2004;176(8):1094-1099.
Figures