4789
3T DCE-MRI Performance in Prostate Cancer Detection: Correlation of Different Kinetic Parameters in the Transition and Peripheral Zone Stratified by Gleason Score and Scanner B1+ field HeterogeneityNazanin H Asvadi1, Kyung Hyun Sung2, Pooria Khoshnoodi3, Pornphan Wibulpolprasert4, Tristan Grogan5, Anthony Sisk6, Robert Reiter7, and Steven Raman8
1Radiology, David Geffen School of Medicine at UCLA, Los Angeles, CA, United States, 2Department of Radiological Sciences, Bioengineering, and Biomedical Physics IDP, UCLA, Los Angeles, CA, United States, 3David Geffen School of Medicine at UCLA, Los Angeles, CA, United States, 4Radiology, Ramathibodi Hospital, Bangkok, Thailand, 5Division of General Internal Medicine and Health Services Research, UCLA, Los Angeles, CA, United States, 6Pathology, David Geffen School of Medicine at UCLA, Los Angeles, CA, United States, 7Urology, David Geffen School of Medicine, Los Angeles, CA, United States, 8Radiology, David Geffen School of Medicine, Los Angeles, CA, United States
Synopsis
To correlate 3T dynamic contrast-enhanced MRI (DCE-MRI) kinetic parameters in prostate cancer (PCa) in the transition zone (TZ) and peripheral zone (PZ) confirmed by
INTRODUCTION AND OBJECTIVES
To correlate 3T dynamic contrast-enhanced MRI (DCE-MRI) kinetic parameters in prostate cancer (PCa) in the transition zone and peripheral zone confirmed by whole mount histopathology (WMHP) stratified by Gleason Scores and inter-scanner B1+ field variation.METHODS
A HIPAA-compliant, IRB-approved study of 385 consecutive men who underwent prostate multi-parametric MRI (mp-MRI) prior to robotic prostatectomy from October 2010 to September 2016 was performed. Clinical mp-MRI and pathologic features were obtained. Genitourinary (GU) radiologists and GU pathologists reviewed each case and matched all lesions on WMHP with regions of interest (ROIs) concordant for size and location on MRI. Quantitative and semi-quantitative CE parameters for each ROI, including Ktrans (influx volume transfer coefficient), kep (efflux reflux rate constant) and iAUC (initial area under the curve), were evaluated by detection of low-GS (GS < 6) and high-GS (GS > 6), and TZ & PZ in two different 3T scanners (Trio (A) and Skyra (B), (Siemens Healthcare, Erlangen, Germany). Of 385 total ROIs on mp-MRI, 220/385 (57.1%) and 165/385 (42.8%) were performed on the scanner A & B, respectively. An average apparent diffusion coefficient (ADC) value was used as a comparison. Kinetic parameters were compared between low and high GS PCa using two sample t-tests. Statistical analyses were performed using SPSS V23 (Armonk, NY). P-values <0.05 were considered statistically significant.RESULTS
On both 3T scanners, there was a consistent difference in ADC values (1025.7 vs. 864.0) in the TZ PCa, & kep (0.46 vs. 1.42), iAUC (4.74 vs. 8.30) and ADC values (1123.3 vs. 941.5) in PZ PCa between low and high grade lesions (p value <.05). On scanner A, low and high grade PCa had significant difference in Ktrans (0.56 vs 0.22), kep (0.93 vs 0.22) and ADC (1060.1 vs 875.2) in the TZ, & Ktrans (0.11 vs 0.26), kep (0.16 vs 0.60) and ADC (1121.3 vs 951.3) in the PZ (p <.05). On scanner B, low and high grade PCa lesions had significant difference in kep (0.70 vs. 1.11) and ADC (991.5 vs. 857.1) in the TZ, & iAUC (7.23 vs. 9.70) and ADC (1129.8 vs. 933.9) in the PZ (p value <.05).CONCLUSIONS
This study demonstrates that clinically relevant heterogeneity between kinetic parameters in low and high grade PCa in the TZ & PZ exists. This may be explained by variability of transmit RF (B1+) field variation between different scanners (inter-scanner B1+ variation) [1] and the need for correction of B1+ inhomogeneity based on the scanner for improved DCE-MRI parameters.Acknowledgements
No acknowledgement found.References
[1] Rangwala NA, Dregely I, Wu HH, Sung K. Optimization and evaluation of reference region variable flip angle (RR-VFA) B1+ and T1 Mapping in the Prostate at 3T. J Magn Reson Imaging. 2016.Figures
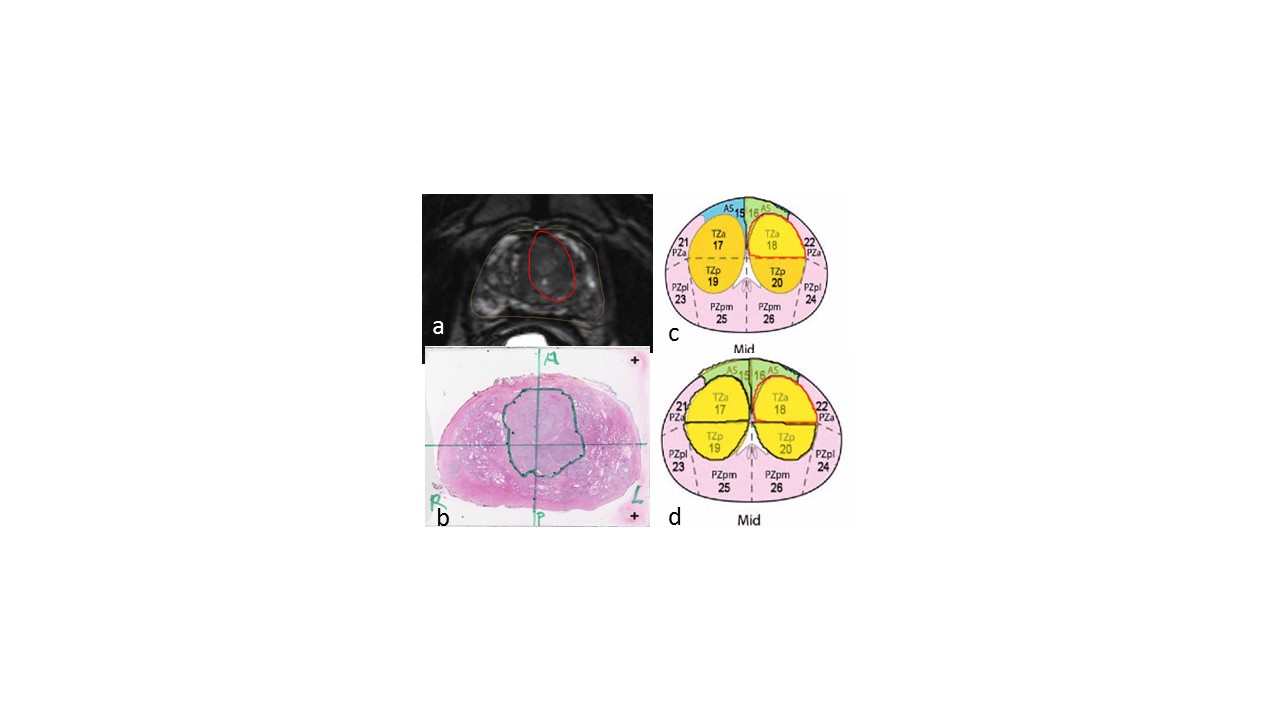
Transition zone lesion contoured on
MRI (a) and WMHP (b), with radiology and pathology sector mapping (c & d)