4788
Prostate Cancer Diffusion Signal Analysis: Combination of Multiple Fit Parameters Improves Tissue Discrimination1Radiology, Brigham and Women's Hospital, Harvard Medical School, Boston, MA, United States, 2Radiology, Sahlgrenska Academy, Gothenburg University, Gothenburg, Sweden, 3Department of Radiology and Nuclear Medcine, Radbound University Medical Center, Netherlands, 4Radiology, Children's Hospital, Harvard Medical School, Boston, MA, United States
Synopsis
Diffusion signals over an extended b-factor range 0-3500 s/mm2 were measured with an endorectal coil at 3 Tesla in 56 prostate cancer patients. For each pixel, signal decay fits were computed assuming biexponential, kurtosis, stretched exponential and gamma distribution diffusion signal models. The potential of individual parameters and linear parameter combinations to differentiate normal from cancerous tissue was evaluated with ROC analysis. For the kurtosis and stretched exponential models, single parameters yield the highest AUCs, whereas for the biexponential and gamma distribution models, only combinations of parameters produce the comparably high AUCs.
INTRODUCTION:
Conventional diffusion imaging with (monoexponential) ADC quantification plays a major role in multi-parametric protocols for detection and characterization of clinically significant (Gleason>7) prostate cancer1. High b-factor diffusion measurements in the prostate reveal a clear departure from a simple monoexponential signal decay2. The value of an extended measurement range for improved lesion characterization remains to be evaluated. Different models have been proposed to describe the observed diffusion signal decay over an extended b-factor range. The purpose of the present study was to evaluate the separation of normal and cancerous tissue in the prostate with parameter maps obtained with biexponential2, kurtosis3, stretched exponential4 and gamma distribution5 model analysis. Since each model results in two or more parameters, the performance of linear parameter combinations was also evaluated.METHODS:
In 56 prostate cancer patients, multi-parametric MRI was performed at 3 Tesla with an endorectal coil. In addition to the standard protocol, diffusion-weighted image data along 3 diffusion encoding directions with 15 b-factors ranging from b=0 to 3,500 s/mm2 was obtained at 4.4x4.4 mm in-plane resolution, 5 mm slice thickness and 100 ms echo time. For each pixel, the geometric mean signal decay was fitted with a non-linear least-square algorithm for four different models: 1) A biexponential model $$$S(b)=S_0[(1-f_{slow})e^{-bD_{fast}}+f_{slow}e^{-bD_{slow}}]$$$, 2) a kurtosis model $$$S(b)=S_0e^{-bADC_K+b^2ADC_K^2K/6}$$$, 3) a stretched exponential model $$$S(b)=S_0e^{-(bDDC)^{\alpha}}$$$ and 4) a gamma distribution model $$$S(b)=S_0/(1+\theta b)^k$$$. Based on the clinical report of the multi-parametric exam, a radiologist indicated the position of each index lesion on the axial T2-weighted slice, where it had the largest cross-sectional expansion. Normal appearing PZ and TZ tissue regions were also identified in all cases. Corresponding regions of interest (ROIs) of the index lesion and normal appearing PZ and TZ tissue were outlined on the b=0 image. Average parameter values were then computed for each respective zone. To evaluate the potential of each parameter for discriminating cancerous from normal tissue receiver operating characteristic (ROC) curves were obtained for each parameter and respective area under the curve (AUC) was calculated. Youden’s index was used to determine optimal cut-off values. Furthermore, it was investigated whether the performance could be improved by combining two parameters $$$p_1$$$ and $$$p_2$$$ of one model. For the stretched exponential6 and gamma distribution model, the mode (peak-value) of the respective diffusion coefficient distribution was used as a combination parameter. Moreover, a a distribution-free rank-based approach7 for optimizing the area under the ROC curve was used to compute the linear combination factor $$$r$$$. The cut-off value $$$y_0$$$ for the optimal discriminator line $$$p_1+rp_2=y_0$$$ was also determined with Youden’s index.
RESULTS:
An example of the observed signal decays and associated fits is presented in Fig. 1. The radiologist identified 41 index lesions that appeared suspicious for tumor. Of these, 28 were located in the PZ and 13 in the TZ. Maximum AUCs ranged from 0.92 to 0.95 for tumors in the PZ and from 0.95 to 0.97 for the tumors in TZ (see Table 1). For the kurtosis and stretched exponential models, single parameters yield the highest AUCs, whereas for the biexponential and gamma distribution models, parameters combinations produce the highest AUCs. Actual TZ data points with optimized separation lines for the linear combinations are shown for the biexponential (Fig. 2), gamma distribution (Fig. 3) and kurtosis model (Fig. 4).
DISCUSSION:
For the kurtosis and stretched exponential model, a single parameter results in the highest AUC, whereas the biexponential and gamma distribution model require linear parameter combinations to achieve similarly high AUCs. Evidently, the linear parameter combination brings fully back the diagnostic sensitivity that the individual parameters of the biexponential and gamma distribution models lack, even though they produce fits with distinctly lower residuals. The absence of improvement for linear combinations with the kurtosis model is explained by the very high normalized covariance of the parameters (see Fig. 2). The stretched exponential and gamma distribution mode, which has an appealing intuitive physical meaning, appears to result in high AUCs. However, given a rather long computation time, it is less practical to compute the stretched exponential mode for individual pixels. The current study has some limitations. The ROIs were based on conspicuity of the prostate tissue on multi-parametric MRI and were not based on whole-mount histopathology of prostatectomy samples. Therefore, there might be a bias towards lesions that are well delineated on conventional ADC maps.CONCLUSION:
All evaluated models are equally well capable of discriminating tumor from normal prostate tissue, but some models require linear parameter combination to achieve full diagnostic performance.Acknowledgements
This study was supported in part by NIH grants R01 CA160902, R01 CA111288,P41 EB015898, U01 CA151261, as well as ALFGBG-374871.References
1. Hegde JV, Mulkern RV, Panych LP et al.Multiparametric MRI of prostate cancer: An update on state-of-the-art techniques and theirperformance in detecting and localizing prostate cancer. J. Magn. Reson. Imaging 2013;37:1035–1054.
2. Mulkern RV, Barnes AS, Haker SJ et al. Biexponential characterization of prostate tissue water diffusion decay curves over an extended b-factor range. Magn Reson Imaging 2006;24:563–568.
3. Jensen JH, Helpern JA, Ramani A et al. Diffusional kurtosis imaging: the quantification of non-gaussian water diffusion by means of magnetic resonance imaging. Magn Reson Med. 2005;53:1432–1440.7.
4. Bennett KM, Schmainda KM, Bennett RT et al. Characterization of continuously distributed cortical water diffusion rates with a stretched-exponential model. Magn.Reson. Med. 2003;50:727–734.8.
5. Oshio K, Shinmoto H, Mulkern RV. Interpretation of diffusion MR imaging data using a gamma distribution Model. Magn. Reson. Med. Sci. 2014;13:191–195.
6. Johnston DC. Stretched exponential relaxation arising from a continuous sum of exponential decays. Phys. Rev. B 2006;74:184430.
7. Pepe MS, Thompson ML. Combining diagnostic test results to increase accuracy. Biostat. Oxf.Engl. 2000;1:123–140.
8. Hanley JA, McNeil BJ.The meaning and use of the area under a receiver operating characteristic (ROC) curve. Radiology. 1982 Apr;143(1):29-36.
Figures
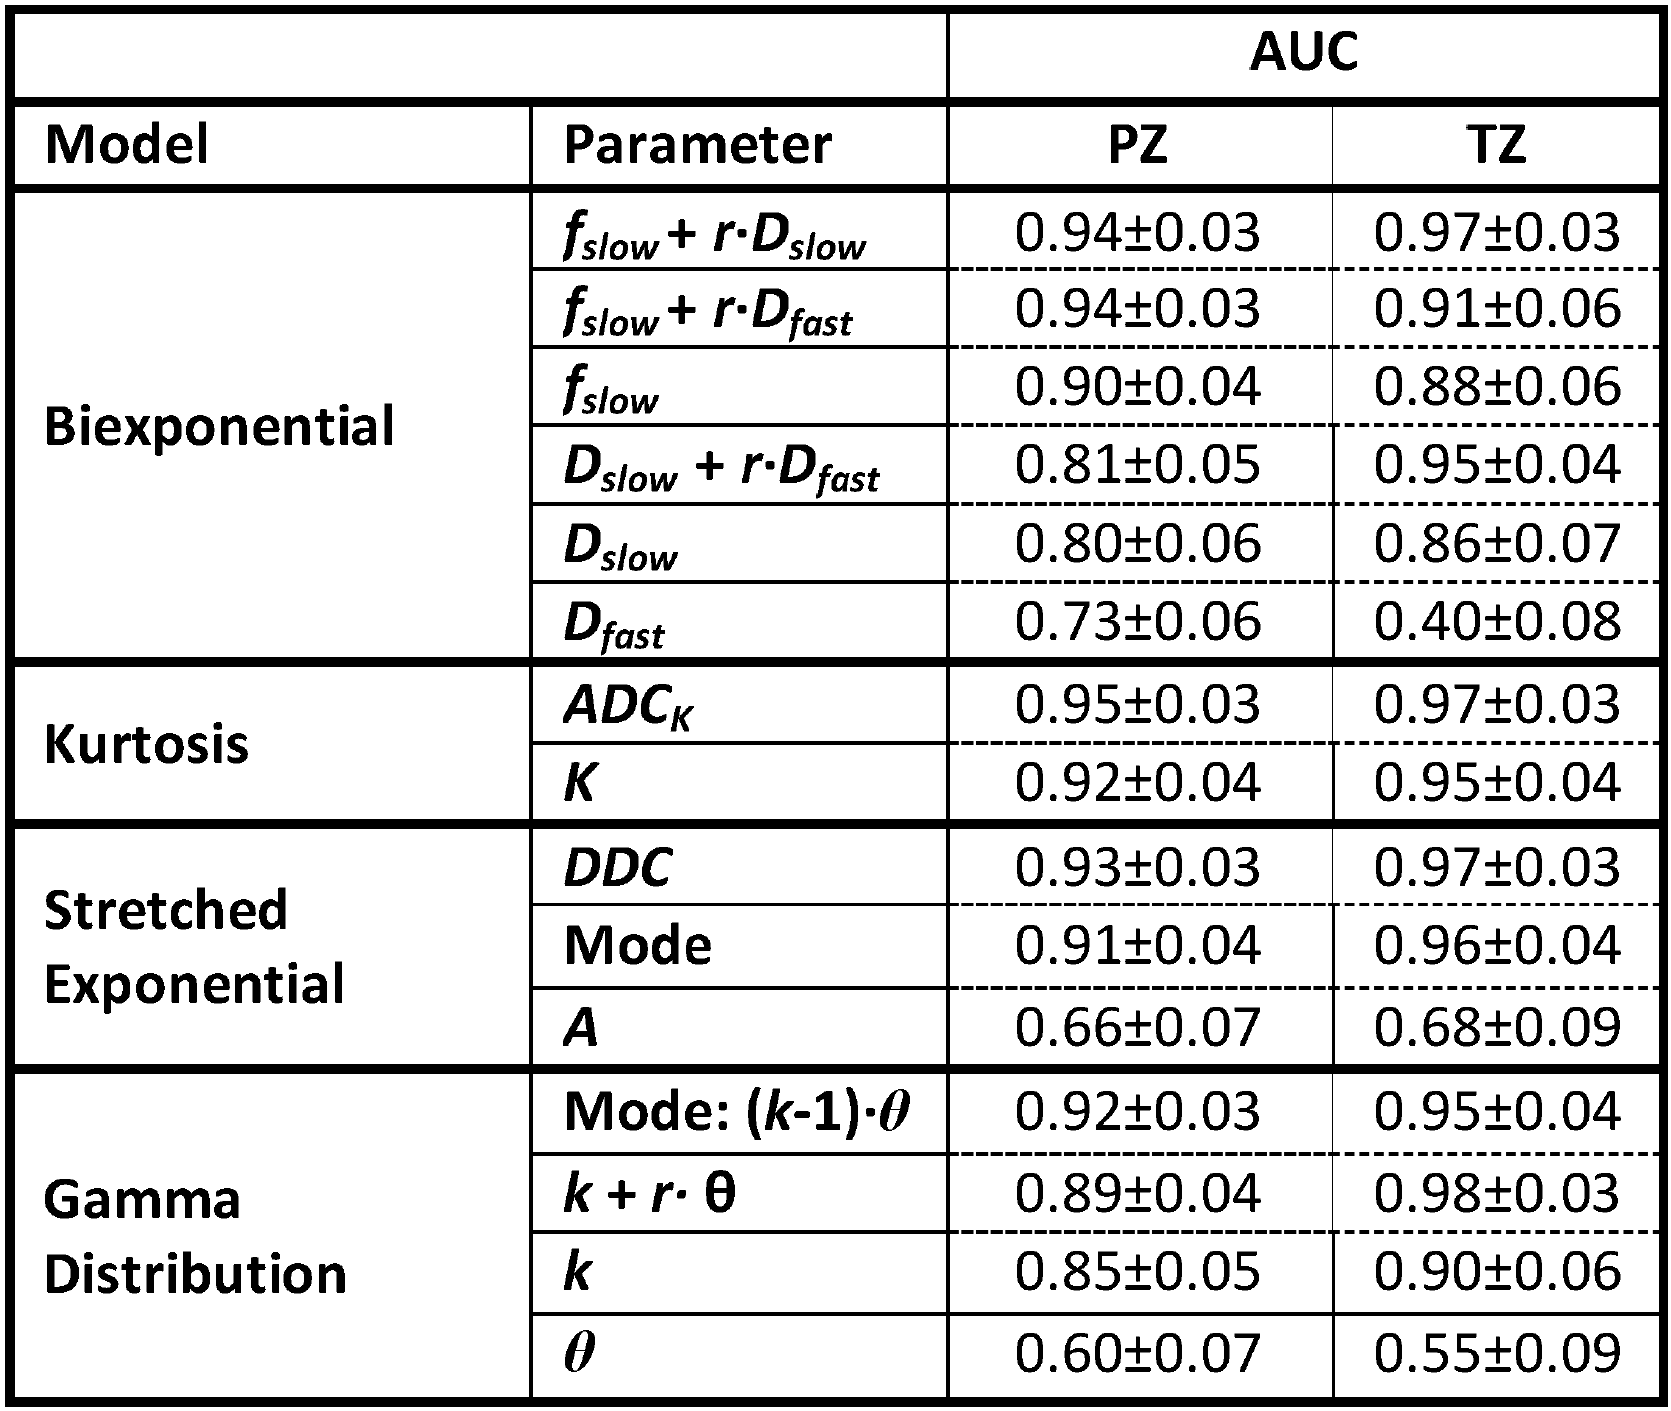
Table 1: AUC of the ROC curves for discriminating normal (PZ: N=56; TZ: N=56) and and tumor tissue (PZ: N=28; TZ: N=13) for each prostatic zone and model parameter, including combined model parameters. AUC standard deviation was calculated according Hanley and McNeil8.