4786
Preliminary application of magnetization transfer imaging and amide proton transfer imaging of prostate cancer at 3.0 tesla1Tongji Medical College, Huazhong University of Science & Technology, Wuhan, People's Republic of China, 2GE Healthcare, Guangzhou, People's Republic of China
Synopsis
Magnetization transfer (MT) imaging and amide proton transfer (APT) imaging have reported many promising results. However, little is known about their usefulness for prostate cancer (PCa). In this study, MT-APT imaging were performed for 39 patients with pathological proven PCa. The feasibility of MT imaging and APT imaging for PCa detection was assessed, and their differential diagnostic values for PCa were compared. The results revealed that MTR(16.5 ppm) increased in cancerous tissues compared with normal PZs, and MT imaging outperformed APT imaging for PCa diagnosis. MT imaging showed promising role in the diagnosis of PCa.
Introduction
Magnetization transfer (MT) imaging and amide proton transfer (APT) imaging have reported many promising results (1-2). However, few studies had reported APT imaging and/or MT imaging in prostate. The diagnostic performances of APT in prostate cancer (PCa) were also controversial (3-4). Moreover, comparison of the diagnostic value of MT imaging and APT imaging remains unavailable. The aims of the present study were to assess the feasibility of MT imaging and APT imaging for PCa detection at 3.0 tesla, and to compare their differential diagnostic value for PCa.Methods
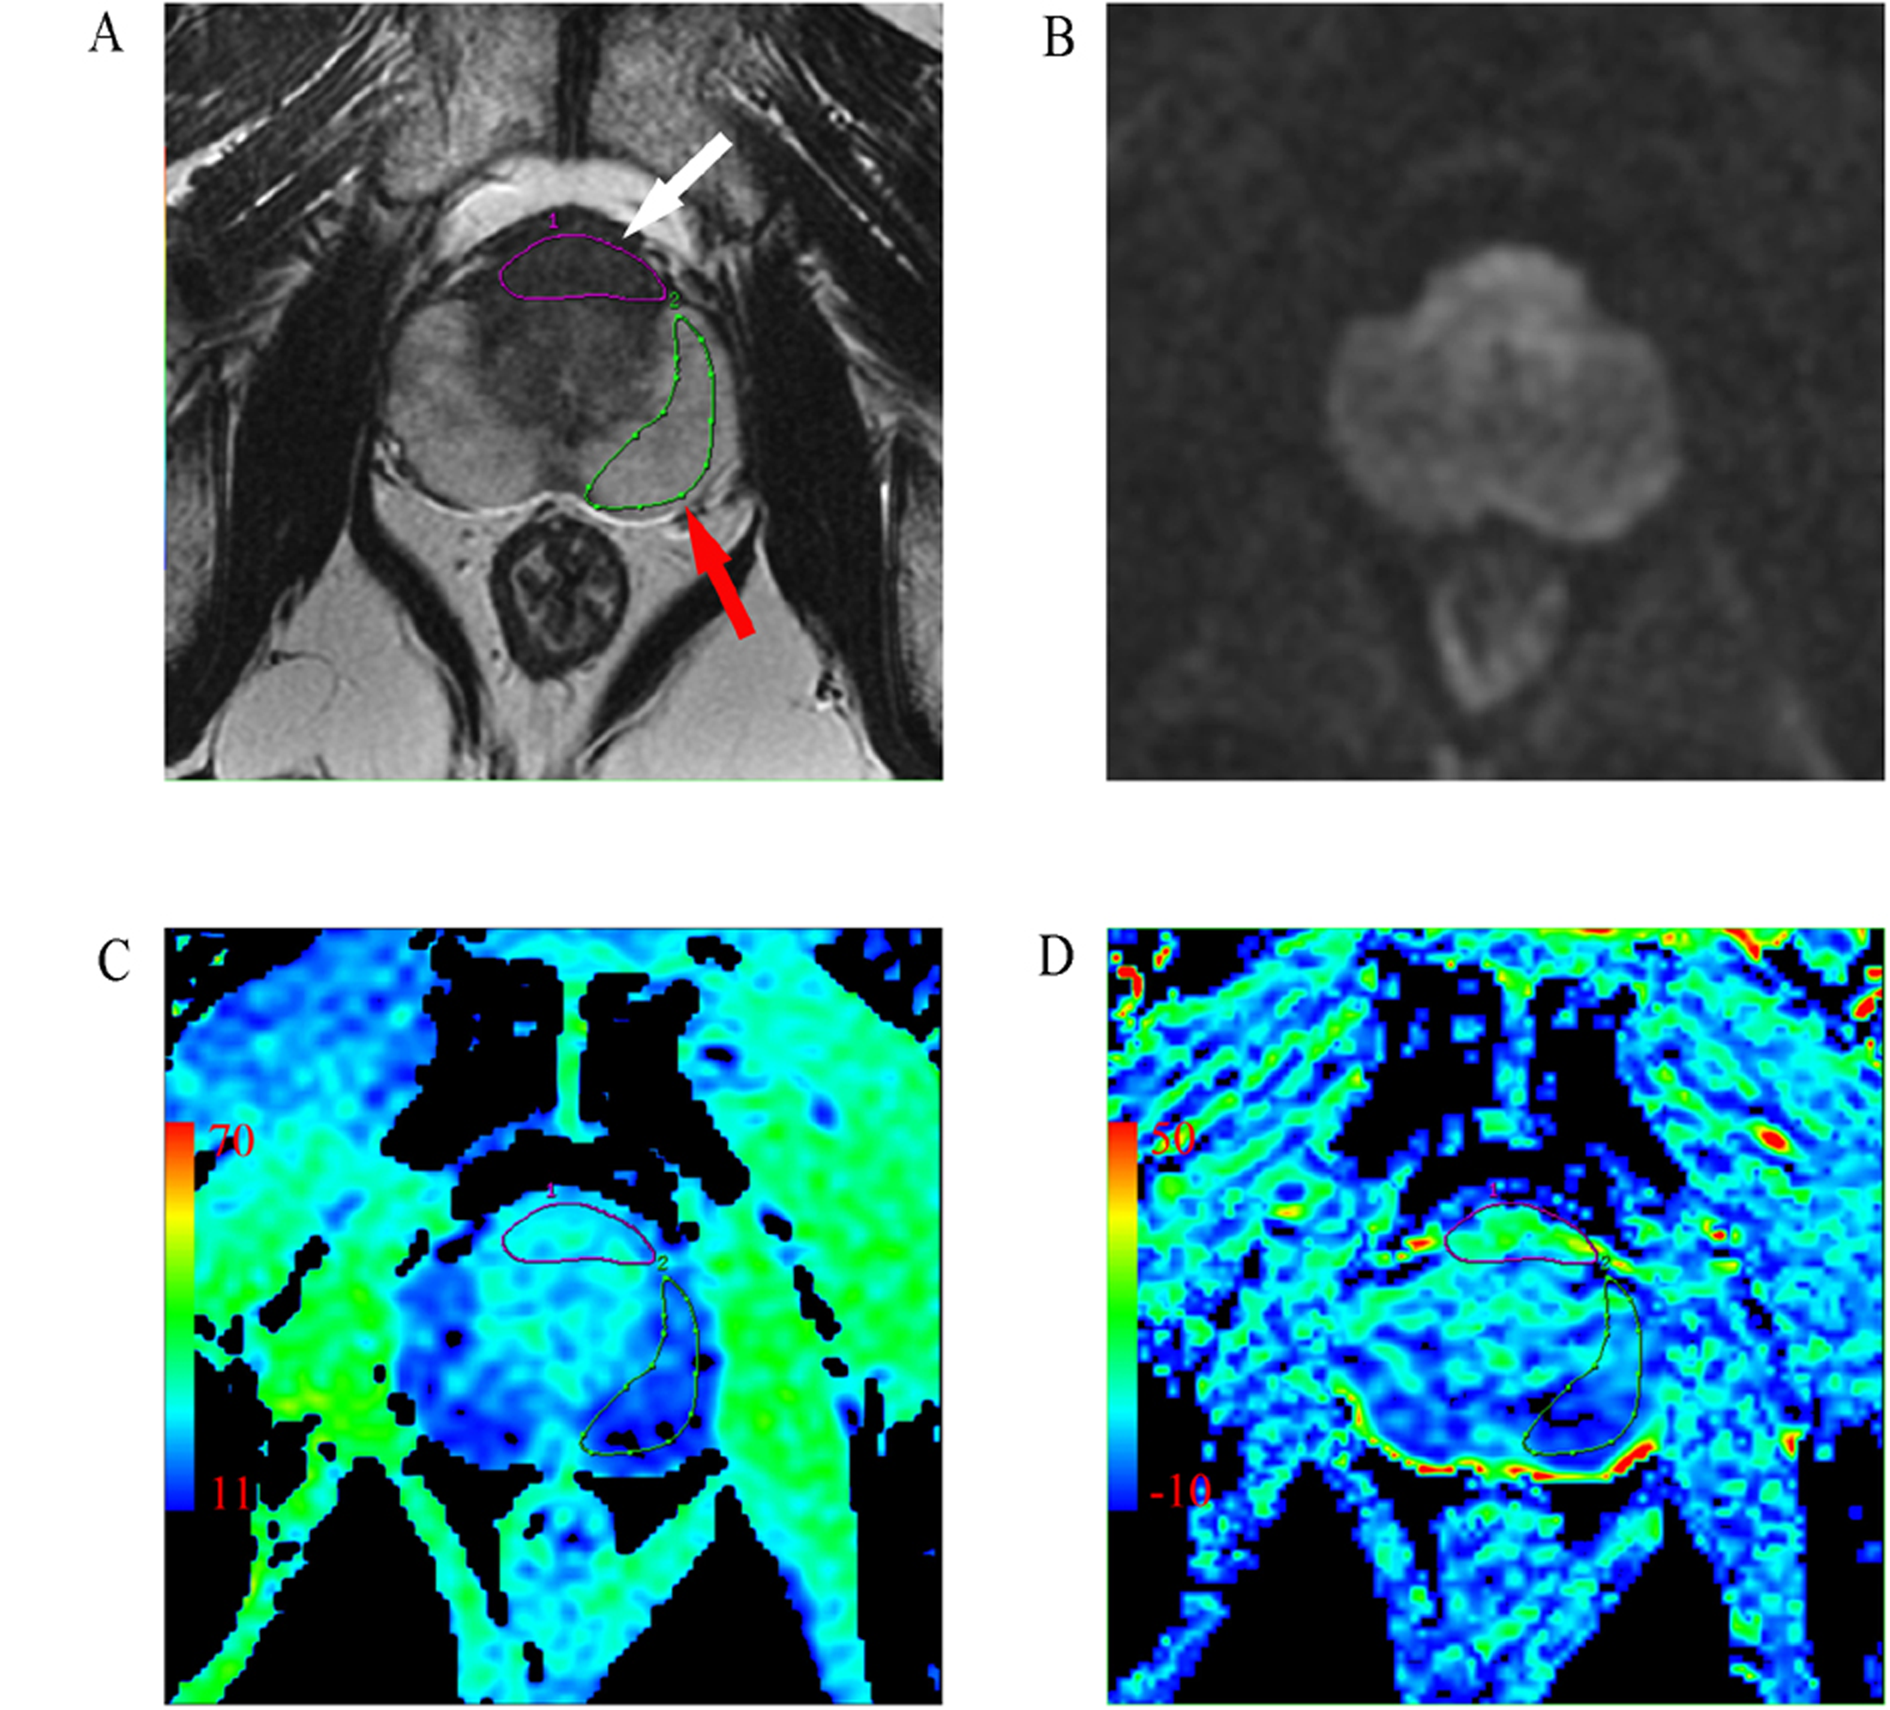
Thirty-nine patients with proven PCa who had undergone multiparametric prostate MRI and MT-APT imaging were included. MT-APT imaging was acquired using a single-shot echo-planar imaging on a single-slice. The saturation prepulse was composed of a train of 4 pulses, each with a pulse length of 400 ms and saturation amplitude of 2 uT. An unsaturated image was acquired for the signal normalization. Magnetization transfer spectra with 33 different frequency offsets were acquired: 0, ±0.25, ±0.5, ±0.75, ±1, ±1.5, ±2, ±2.5, ±3, ±3.25, ±3.5, ±3.75, ±4, ±4.5, ±5, ±6, 15.6. MT imaging and APT imaging were quantified by MTR(15.6 ppm) and MTRasym(3.5 ppm), respectively (5-6). MTR (16.5 ppm) and MTRasym (3.5 ppm) were evaluated at the cancerous tissues and normal peripheral zones (PZs). T2WI and DWI images were used to determine the range of focus (Figure. 1). The MTR(16.5 ppm) and MTRasym(3.5 ppm) maps were calculated according to the formula: MTR(16.5ppm) = [S0-Ssat(+16.5ppm)]/S0; MTRasym(3.5ppm)=[ Ssat(-3.5ppm) -Ssat(+3.5ppm)]/S0. Where Ssat and S0 are the water signal intensities measured with and without the saturation prepulse, respectively.Results
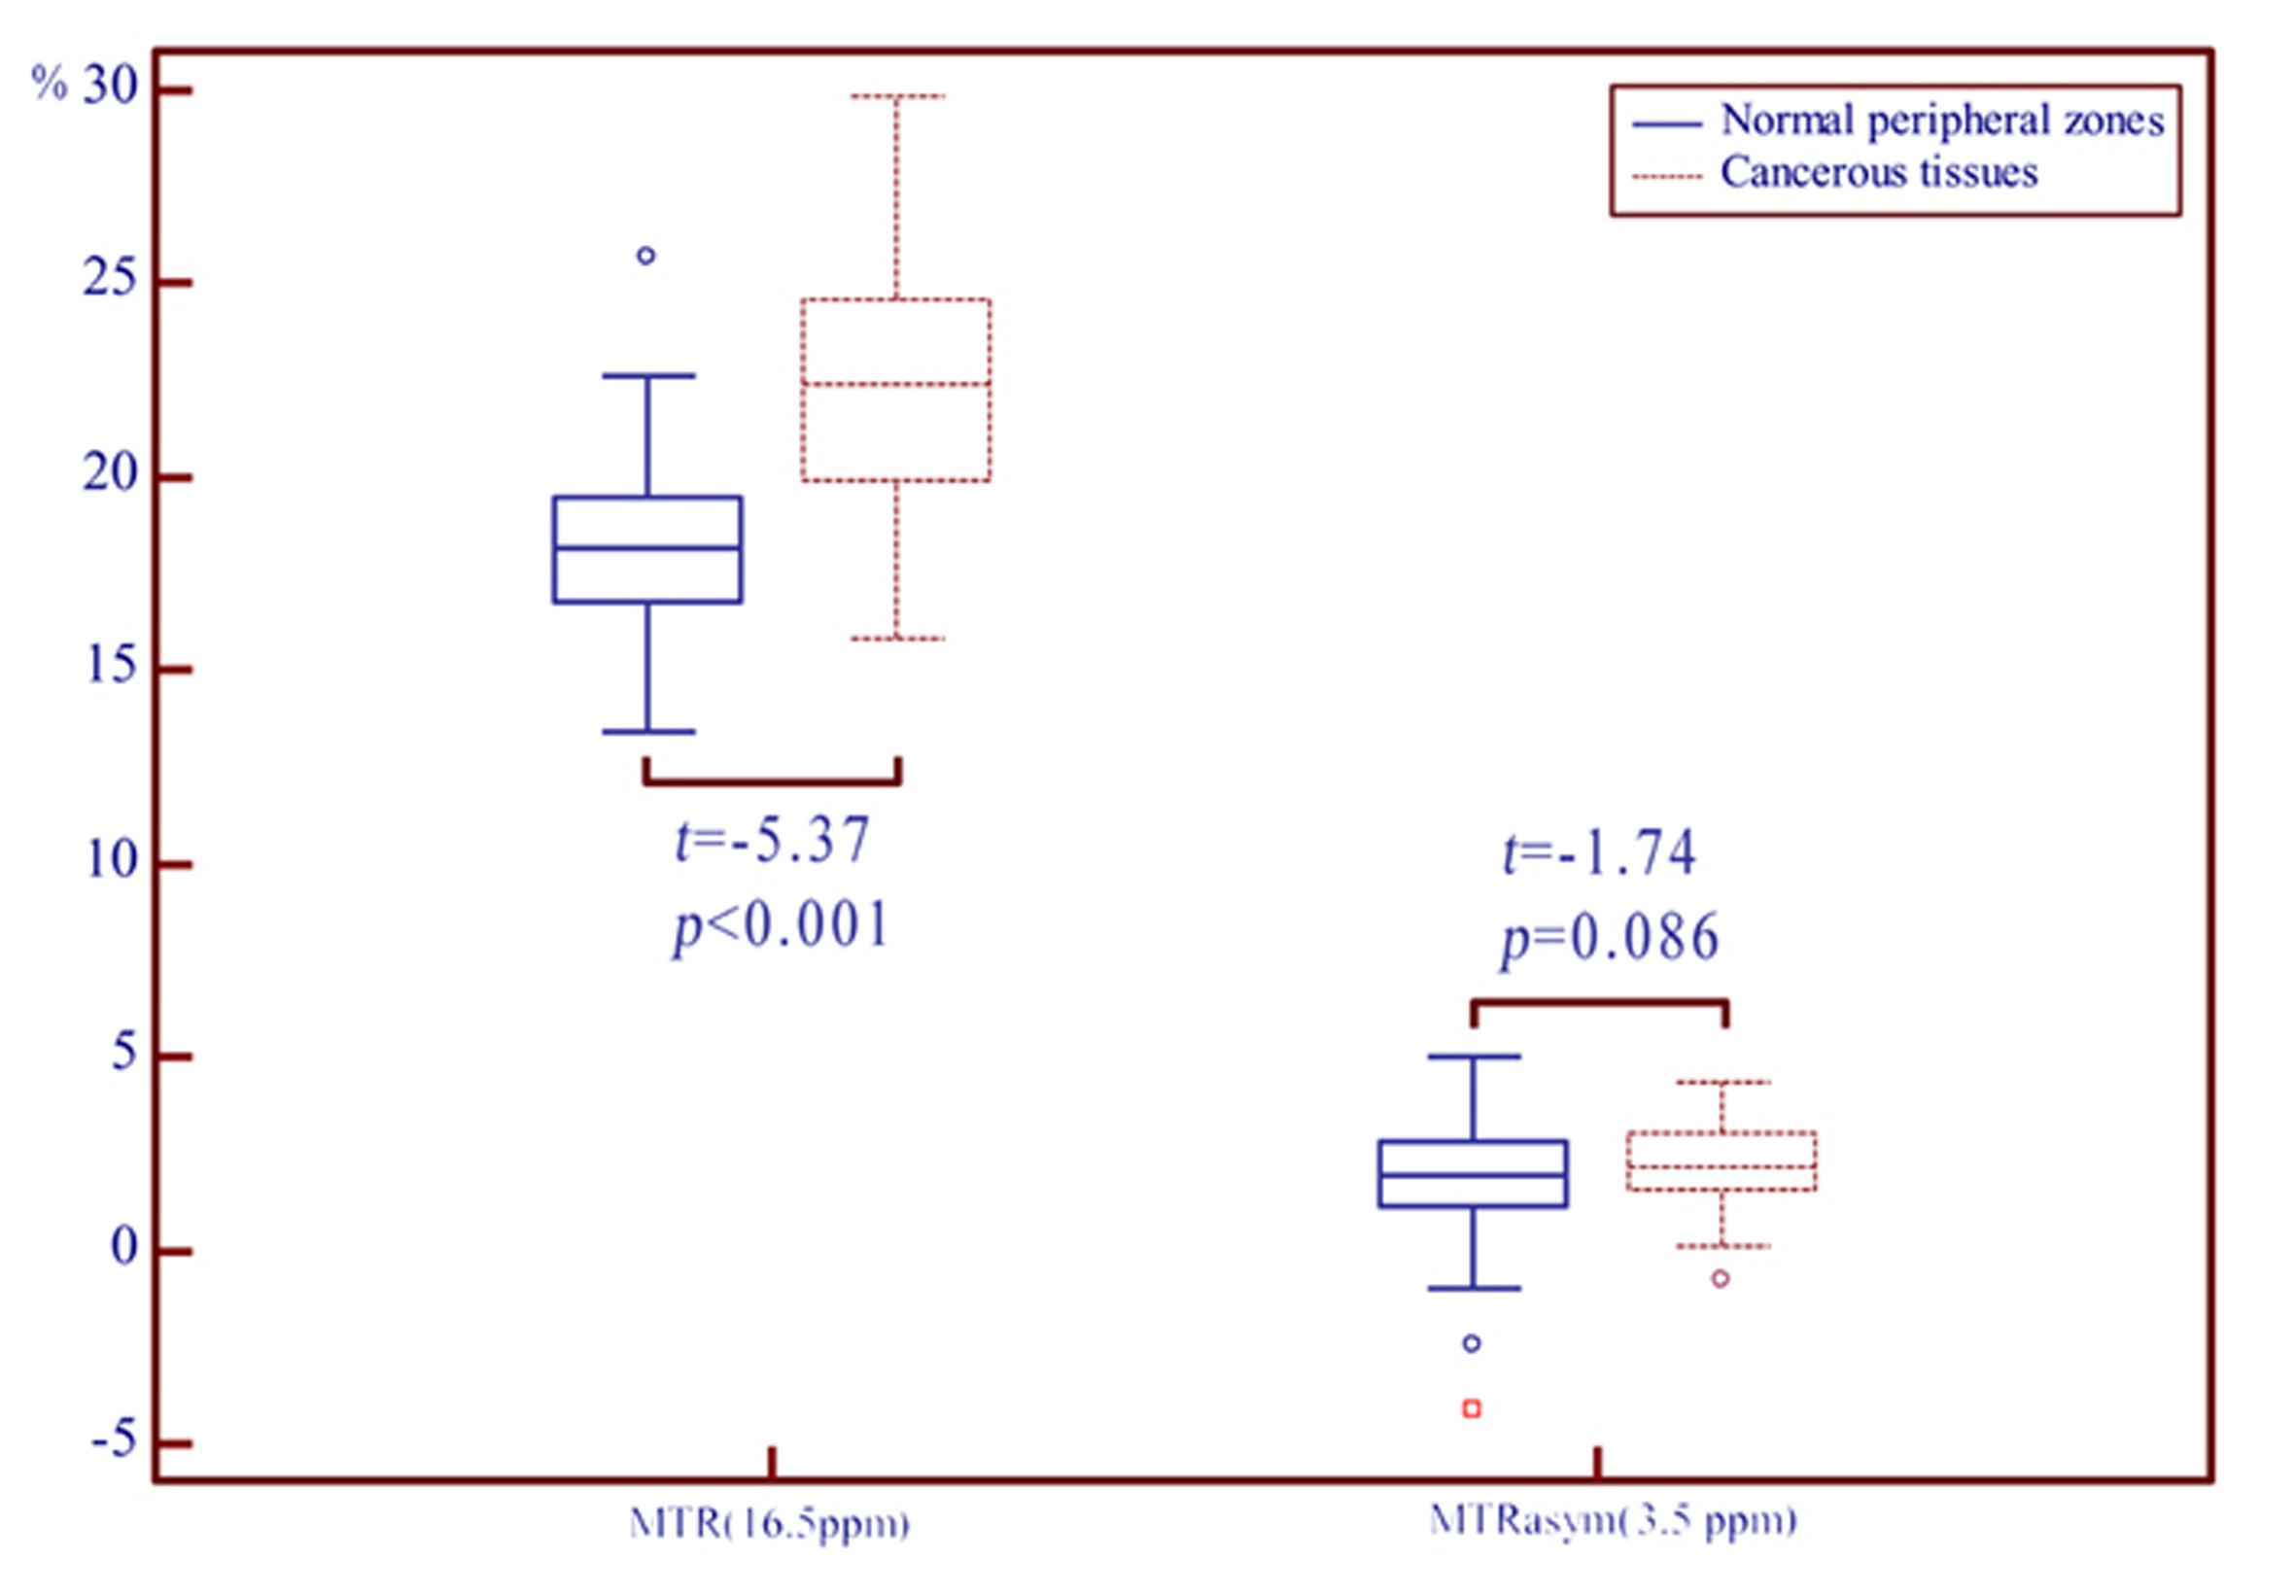
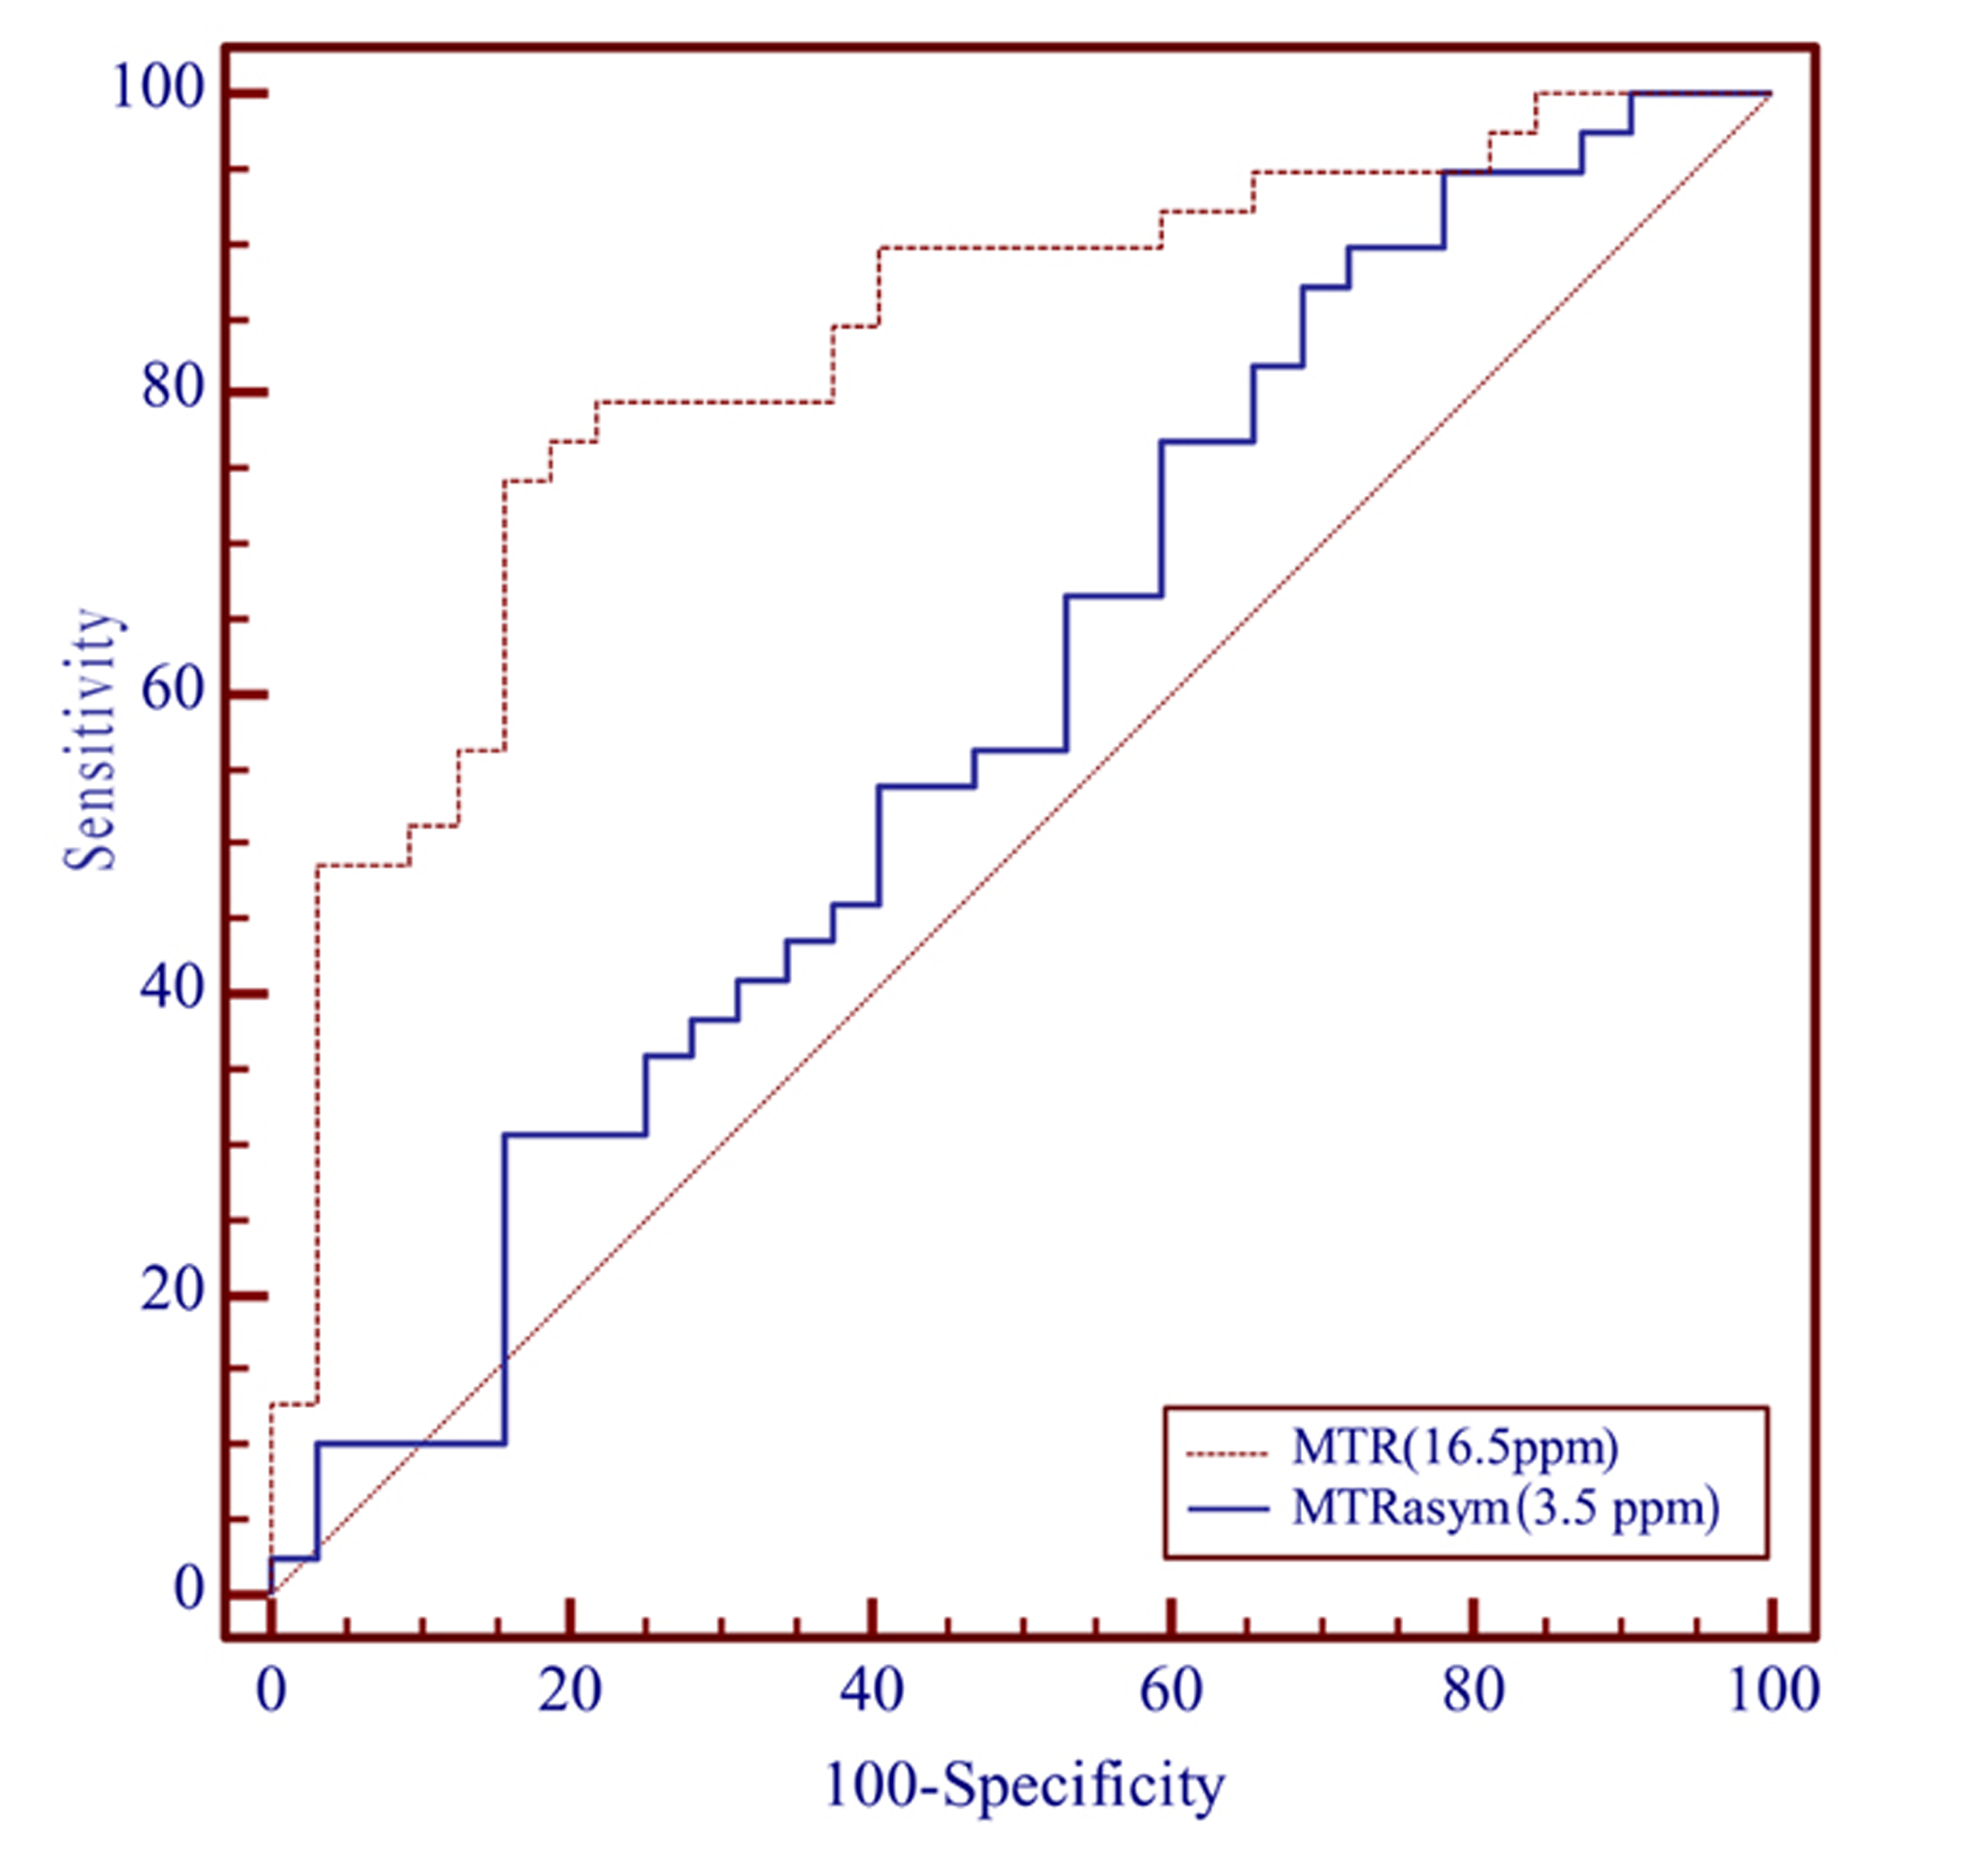
Figure. 2 shows the MTRasym(3.5 ppm) and MTR(15.6 ppm) in cancerous tissues and normal PZs. MTR (16.5 ppm) in cancerous tissues was (22.22 ± 3.25)%, significantly higher than normal PZs (18.39 ± 2.64)% (t = -5.37, p < 0.001). MTRasym(3.5 ppm) in cancerous tissues and normal PZs were (2.32 ± 1.28)%, (1.68 ± 1.81)%, respectively. But no significant statistical difference was found (t = -1.74, p = 0.086). Figure. 3 shows the diagnostic performance of MTRasym(3.5 ppm) and MTR(16.5 ppm) as determined by the receiver operating characteristic curve analyses. The area under the curve (AUC) of MTR(16.5 ppm) and MTRasym(3.5 ppm) in differentiating cancerous tissues and normal PZs were 0.83 and 0.59, respectively. The AUC of MTR(16.5 ppm) was significantly higher than MTRasym(3.5 ppm) (Z = -2.98, p = 0.003). The cut-off value of 20.09% for MTR(16.5 ppm) had 74.36% sensitivity and 84.37% specificity. The cut-off value of 1.31% for MTRasym(3.5 ppm) showed 87.18% sensitivity and 31.25% specificity.Discussion
This preliminary study evaluated the feasibility of MT imaging and APT imaging in differentiating PCa and normal PZs. Our results revealed that MTR(16.5 ppm) increased in cancerous tissues compared with normal PZs, and MT imaging outperformed APT imaging for PCa diagnosis. The contrast of MT imaging mainly depending on the fraction of large macromolecules in tissue. The cell membrane proteins and phospholipids mainly contribute to the MT signal. The glandular structure of prostate is disrupted and replaced with proliferating malignant cells in cancer pathogenesis, leading to higher MTR(15.6 ppm) in the malignant regions. In our study, the MTR(15.6 ppm) value in PCa was significantly higher than that in normal PZs, which implied a great mount of macromolecules in tumors. Chemical exchange saturation transfer (CEST) imaging is a variant of MT imaging. APT imaging is the most widely used CEST imaging specifically to amide protons of mobile tissue proteins and peptides. Different to some previous studies, our results reached no significant difference of MTRasym(3.5 ppm) between cancerous tissues and normal PZs. The main reasons may be as follows. The APT signals depend mainly on the intracellular mobile proteins and peptides. The prostate tissue secrete prostatic fluid, and the prostatic fluid contains mobile proteins and peptide (7-8). In cancerous tissues, the proliferating malignant cells with large content intracellular mobile proteins and peptides would produce high APT signal. On the contrary, the disruption of normal glandular structure of prostate in cancerous tissues would reduce the prostate excretive mobile proteins and peptide, which might cause the decrease of APT signal. The two opposite aspects lead to an overlap between PCa and normal tissues. Differ to APT imaging, the MT signal mainly determined by the cell membrane proteins and phospholipids. The prostatic fluid in glandular cavity produce less effect on MT signal.Conclusion
This study revealed the promising role of MT imaging in the diagnosis of PCa. However, the diagnostic value of APT imaging in PCa remains to be evaluated.Acknowledgements
References
1. Zhang H, Kang H, Zhao X, et al. Amide Proton Transfer (APT) MR imaging and Magnetization Transfer (MT) MR imaging of pediatric brain development. European radiology 2016.
2. Ohno Y, Yui M, Koyama H, et al. Chemical Exchange Saturation Transfer MR Imaging: Preliminary Results for Differentiation of Malignant and Benign Thoracic Lesions. Radiology 2016;279(2):578-589.
3. Jia G, Abaza R, Williams JD, et al. Amide proton transfer MR imaging of prostate cancer: a preliminary study. Journal of magnetic resonance imaging : JMRI 2011;33(3):647-654.
4. Takayama Y, Nishie A, Sugimoto M, et al. Amide proton transfer (APT) magnetic resonance imaging of prostate cancer: comparison with Gleason scores. Magma 2016;29(4):671-679.
5. Jiang S, Yu H, Wang X, et al. Molecular MRI differentiation between primary central nervous system lymphomas and high-grade gliomas using endogenous protein-based amide proton transfer MR imaging at 3 Tesla. European radiology 2016;26(1):64-71.
6. Zhou J, Lal B, Wilson DA, Laterra J, van Zijl PC. Amide proton transfer (APT) contrast for imaging of brain tumors. Magnetic resonance in medicine : official journal of the Society of Magnetic Resonance in Medicine / Society of Magnetic Resonance in Medicine 2003;50(6):1120-1126.
7. Costello LC, Franklin RB. Prostatic fluid electrolyte composition for the screening of prostate cancer: a potential solution to a major problem. Prostate cancer and prostatic diseases 2009;12(1):17-24.
8. Wang XZ, Wang B, Gao ZQ, et al. Diffusion-weighted imaging of prostate cancer: correlation between apparent diffusion coefficient values and tumor proliferation. Journal of magnetic resonance imaging : JMRI 2009;29(6):1360-1366.
Figures