4785
Lower Normalised T2 Signal Intensity is Associated with Higher Intratumoural Heterogeneity: A Radiogenomic Study in High-Risk Prostate Cancer1Centre for Medical Imaging, University College London, London, United Kingdom, 2Translational Cancer Therapeutics Laboratory, University College London, London, United Kingdom, 3Translational Cancer Therapeutics Laboratory, Francis Crick Institute, London, United Kingdom, 4Division of Surgery and Interventional Science, University College London, London, United Kingdom, 5Centre for Medical Image Computing, University College London, London, United Kingdom, 6Centre for Evolution and Cancer, The Institute of Cancer Research, 7Cancer Immunology Unit, University College London, 8Department of Pathology, University College London Hospital, University Street, United Kingdom, 9Department of Bioinformatics and Biostatistics, University College London, 10Definiens AG, 11Urology, Guy's and St. Thomas' NHS Trust, 12Treatment Resistance Laboratory, The Institute of Cancer Research, 13Centre for Biological Sequence 47 Analysis, Technical University of Denmark
Synopsis
Intratumoural heterogeneity (ITH) has been shown to predict overall survival in prostate cancer, and non-invasive biomarkers that can measure this genetic diversity would be welcome. In this study, we correlated imaging metrics derived from multiparametric prostate MRI with genomic heterogeneity indices and showed that low values of normalised T2 signal intensity within tumours are associated with a higher degree of mutational ITH. Our study shows the potential to use diagnostic imaging as a surrogate for genomic ITH in order to risk stratify patient for guiding management decisions.
PURPOSE
Intratumoral heterogeneity (ITH) is well recognized in prostate cancer and has been shown to predict overall survival1. However, comprehensive measurement of mutational ITH requires multiple invasive biopsies, tissue processing and DNA sequencing for each sample. Quantitative multiparametric prostate MRI (mp-MRI) could represent a valuable method to quickly and non-invasively estimate ITH.
We seek to determine whether there is a relationship between reproducible quantitative mp-MRI parameters and genomic heterogeneity in the largest multiregional sequencing analysis in high-risk prostate cancer to date.
METHODS
Study design
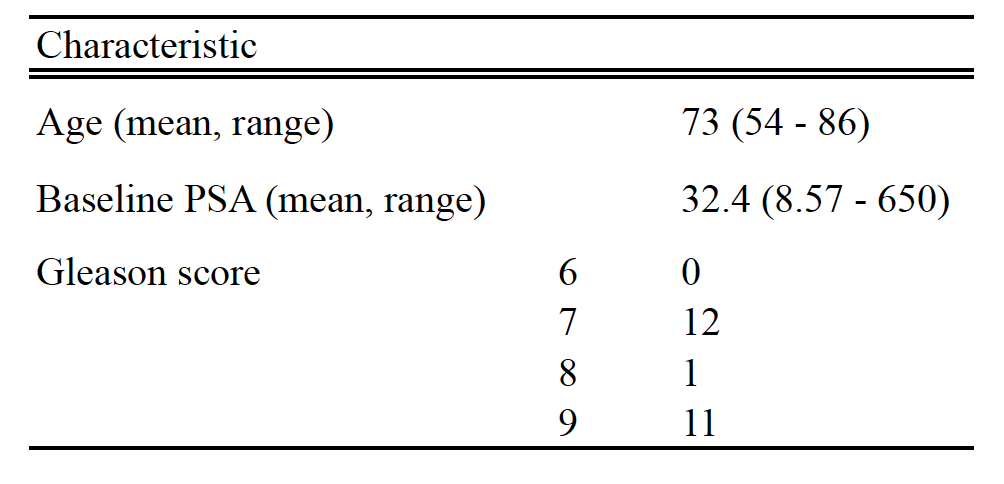
49 men with elevated PSA levels and suspected prostate cancer on MRI (PI-RADS® ≥4) with a lesion diameter of >1cm underwent MRI guided multiregional transperineal template biopsy. 25 patients had sufficient tumor content for sequencing data. One patient was excluded from the analysis due a histologically confirmed neuroendocrine tumor giving unique imaging appearances. Patient demographics are shown in table 1.
Phylogenetic trees were constructed and the proportion of somatic single nucleotide variation (SNV) mutations between sampled tumor regions calculated, as an indicator of ITH.
Only reliable imaging metrics were included in the analysis in order to minimize the ‘curse of dimensionality’ arising from multiple comparisons. Median apparent diffusion coefficient (ADC) values and normalized median T2 signal intensity (T2nSI) were therefore selected, as dynamic contrast enhanced (DCE) metrics and texture features of standard deviation, entropy, skewness and kurtosis derived from imaging histograms were found to demonstrate insufficient reproducibility in an initial 14 patient scan-rescan study and their biophysical basis is poorly understood.
Image acquisition
mp-MRI was performed on a range of 5 machines at 1.5 and 3 Tesla (T) with 2 manufacturers (Philips, Best, the Netherlands and Siemens, Erlangen, Germany), using pelvic phased array coils. Multiparametric MRI comprised axial and coronal T2 turbo spin echo (TSE) imaging, supplemented with diffusion-weighted imaging at 4 b-values (0,150, 500 and 1000) from which an ADC map was calculated. A separate high b-value acquisition was also carried out for improved contrast-to-noise ratio for lesion detection purposes (b=1400s/mm2) at 1.5T and b2000s/mm2 at 3T). A DCE acquisition was subsequently performed using spoiled gradient echo with fat saturation and a 12 second time resolution. All acquisitions were compliant with European guidelines3.
Image analysis
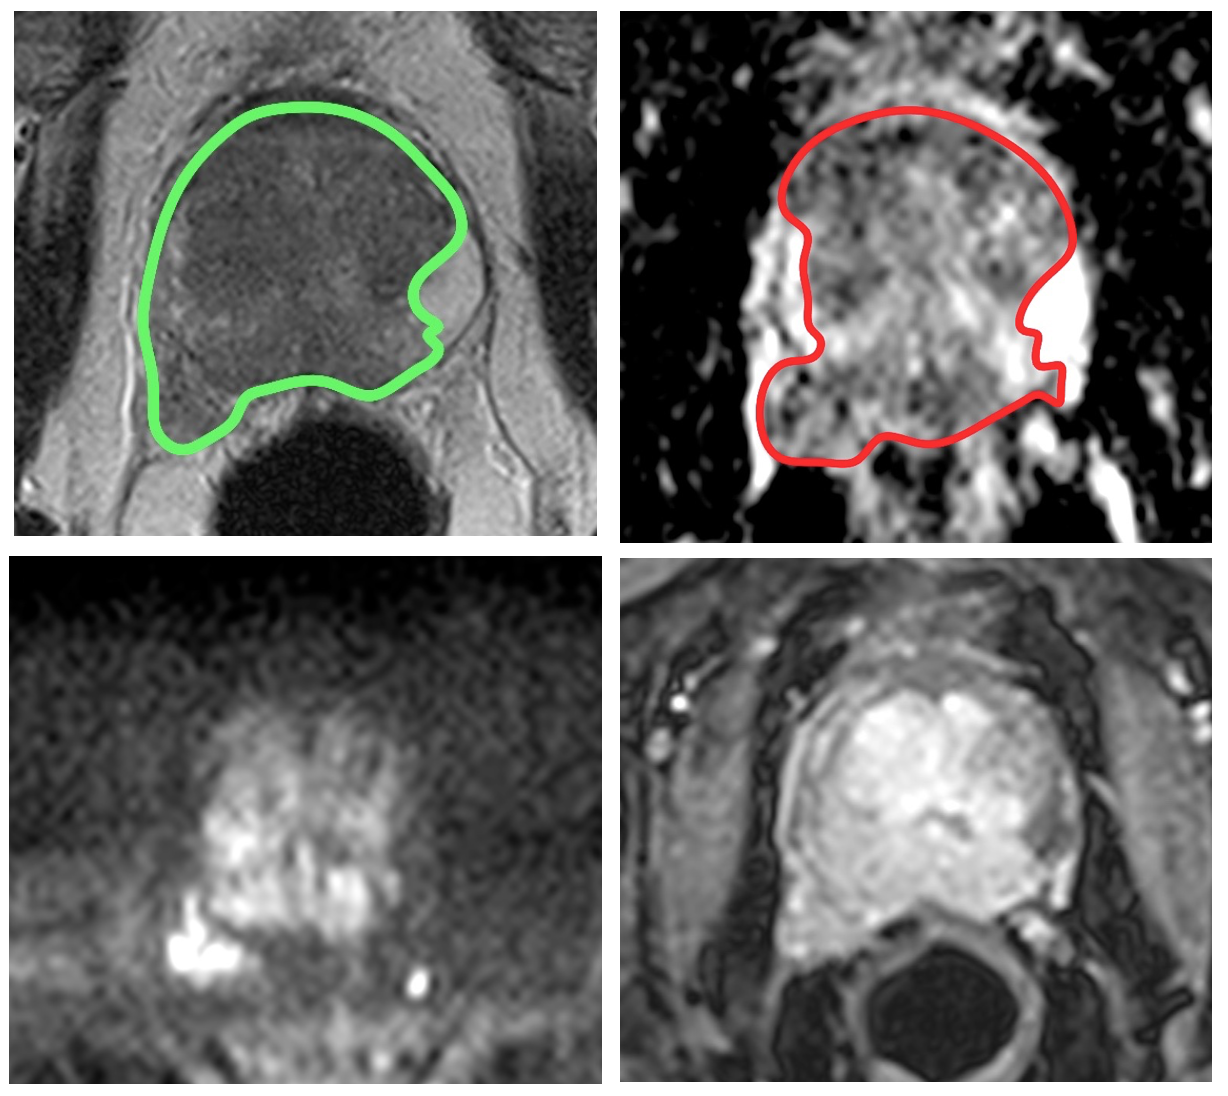
MR datasets were analyzed using Osirix Version 7.0 (Bernex, Switzerland). A board certified Radiologist manually contoured the entire tumor volume on T2 and ADC images, using all sequences for further guidance. A largest possible region of interest (ROI) was placed on a single slice of the bladder urine for normalization purposes. T2nSI was calculated by dividing the median signal intensity of the lesion by that of the bladder. A typical example of lesion contouring is shown in figure 1.
Statistical analysis
Data were analyzed using GraphPad Prism version 6 (San Diego, California, USA). Pearson’s product moment correlation coefficient was performed. Data demonstrated linearity, normality and homoscedasticity.
RESULTS
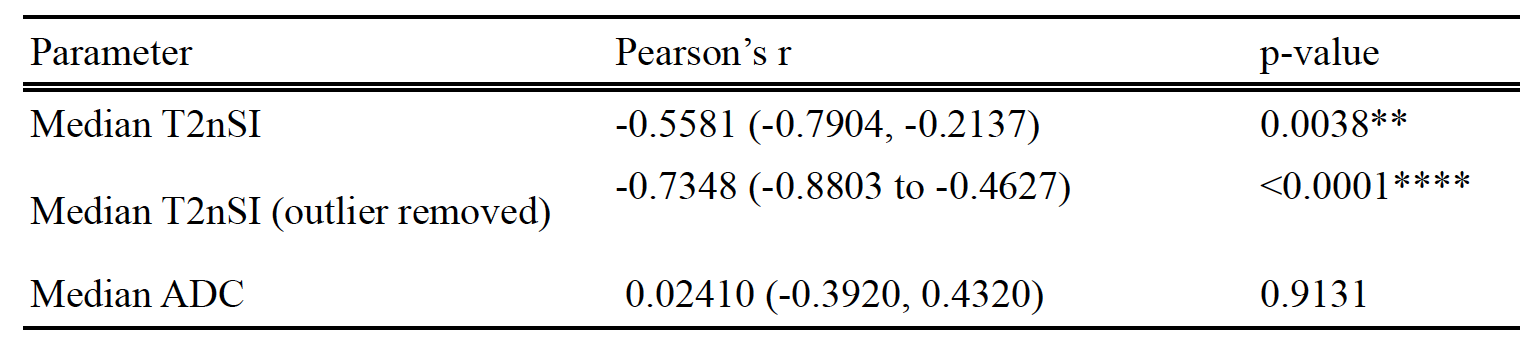
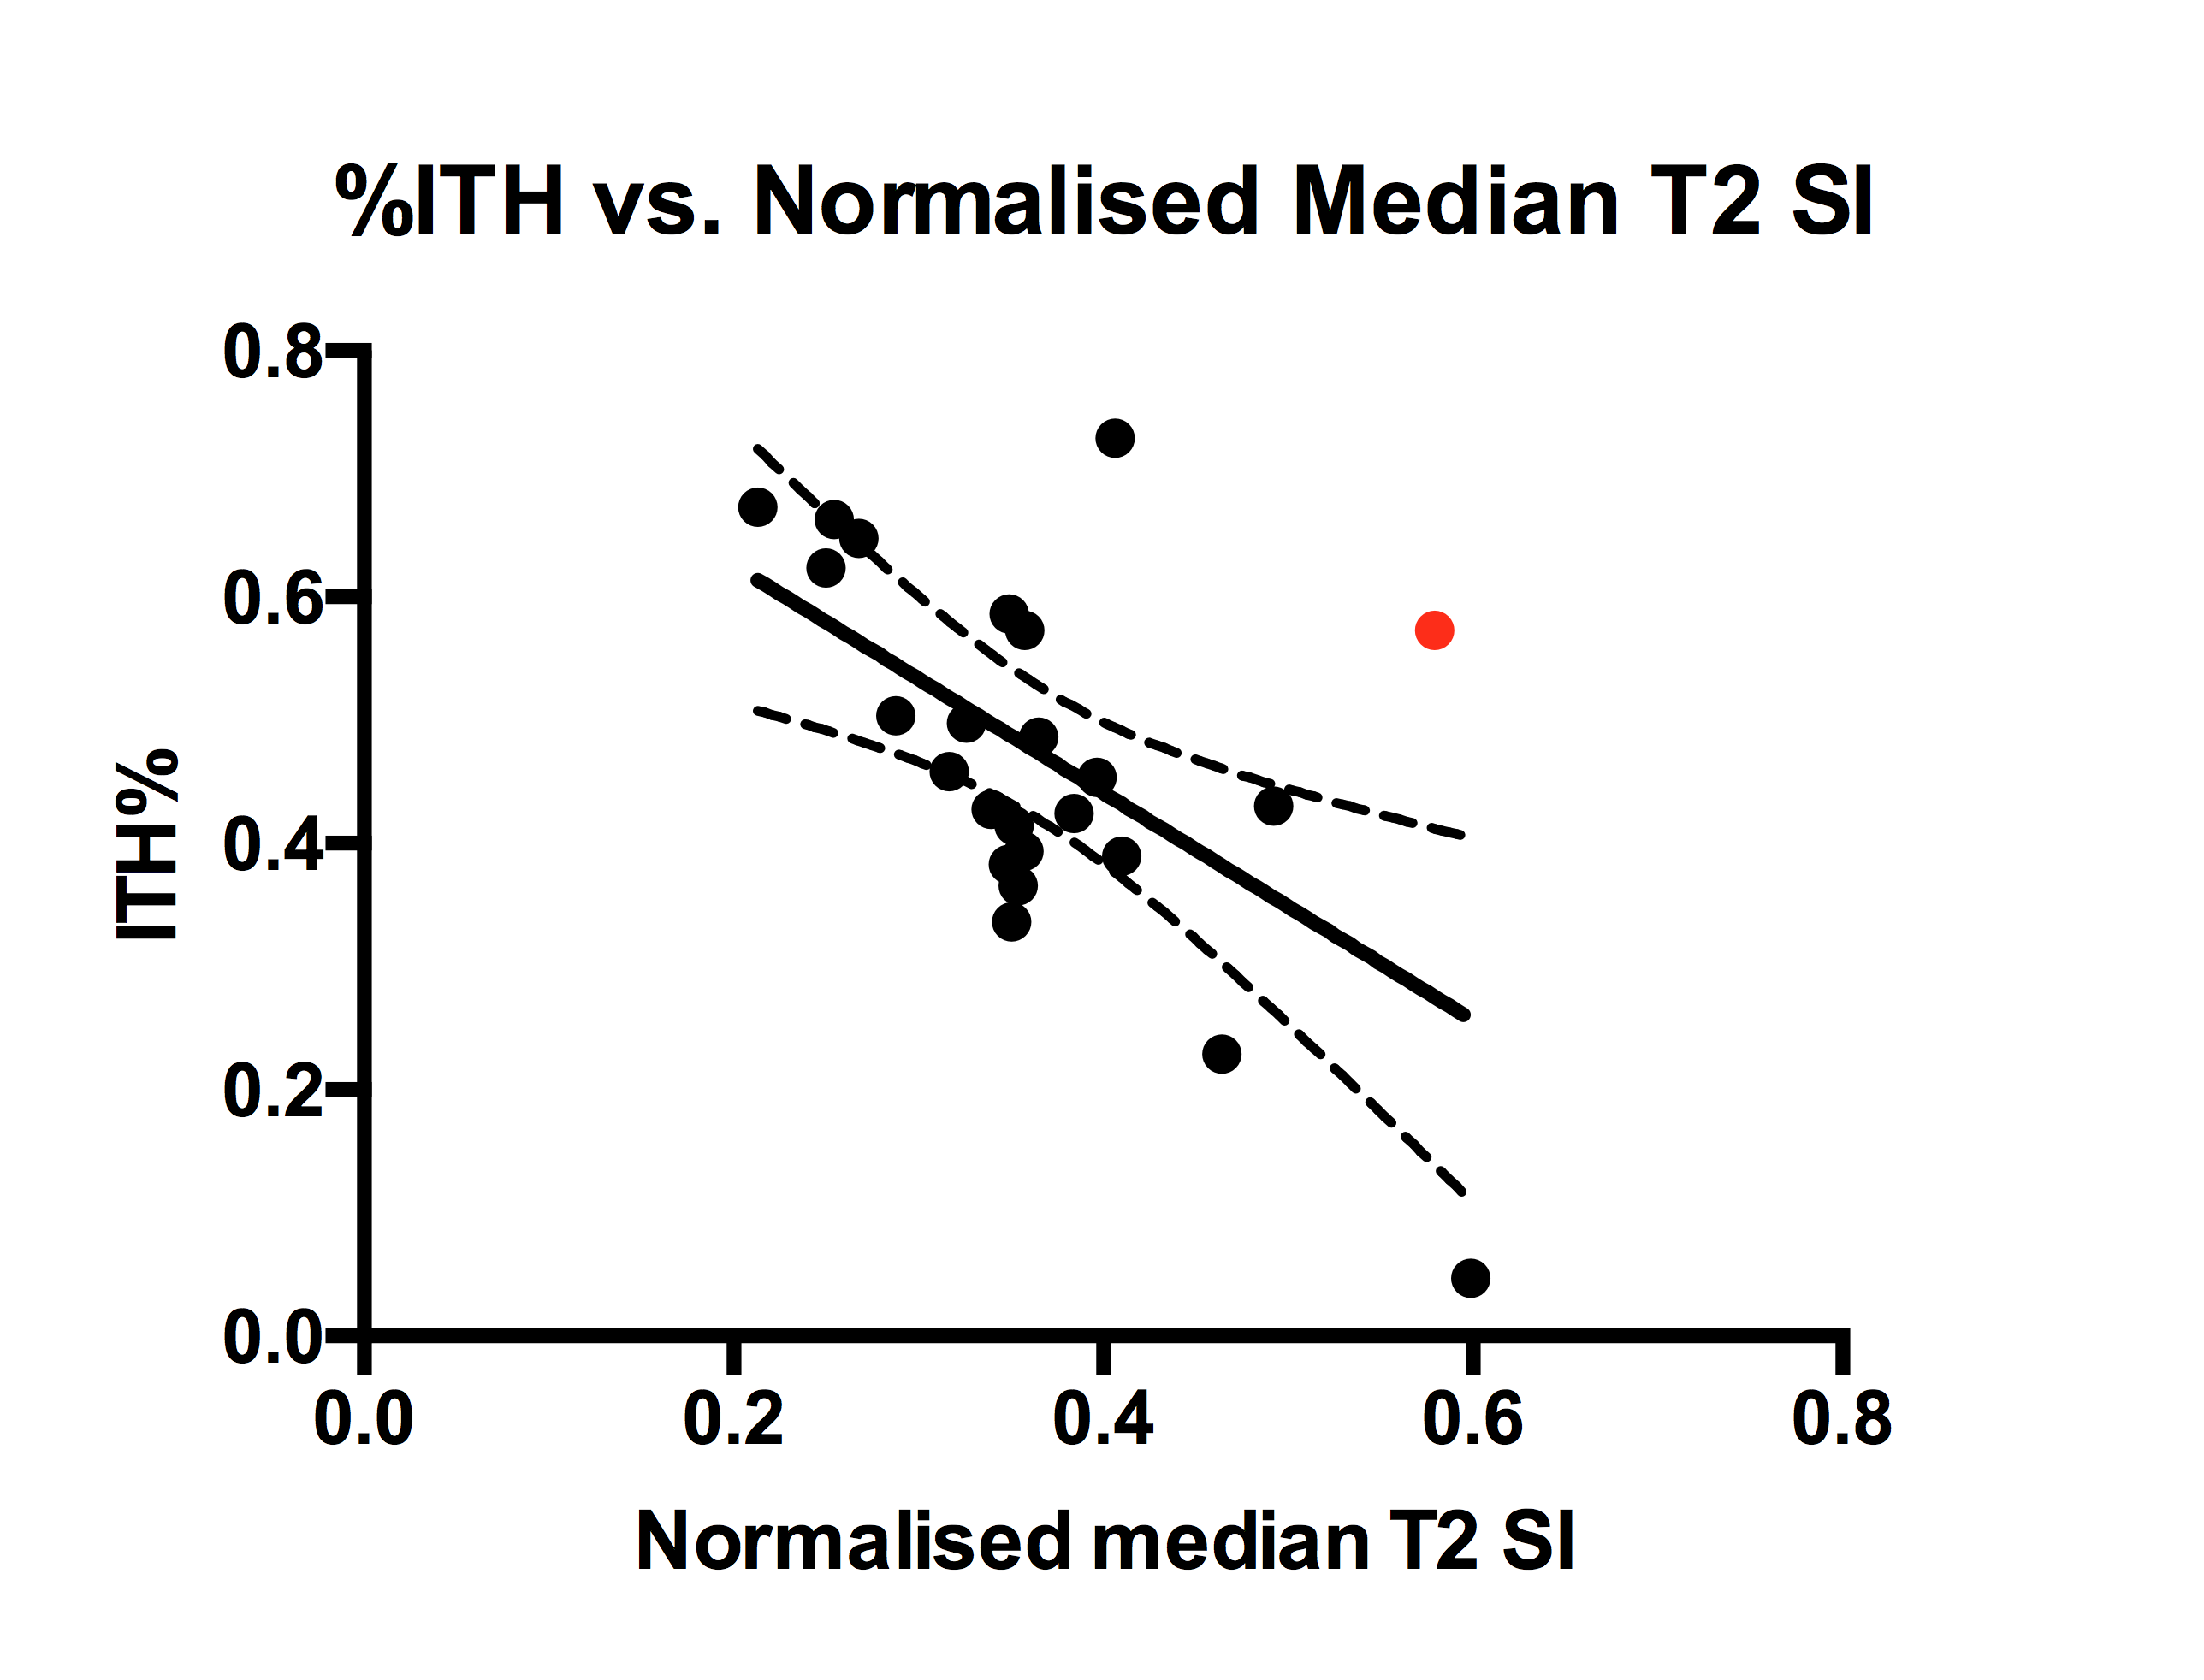
The association between %ITH and imaging metrics are presented in table 2 and figure 2. No association was found between ADC, T2nSI and Gleason grade.DISCUSSION
For the first time, we have demonstrated a relationship between a robust imaging metric and prostate cancer genomic heterogeneity: genetically diverse tumors tend to demonstrate lower T2nSI, with apparent independence from Gleason score.
The reason for decreased T2 relaxation times encountered in genetically heterogeneous tumors is uncertain, and presents an opportunity for further work. However, possible biophysical explanations could arise from changes in water compartmentalization (extracellular, cytoplasmic or nuclear), regional macromolecules, cell density, blood vessels, hemoglobin content and pH 4–6.
The outlier illustrated in the scatterplot could be explained by a T4 tumor that was invading into the bladder, possibly increasing tumour water content and thereby increasing T2 relaxation times.
Further work could include investigating whether T2 measurements can be improved with multiecho parametric maps rather than normalized T2 signal intensity, and the benefit of multiexponential fitting the decay processes could be considered.
CONCLUSIONS
Our study suggests that T2nSI may have value in predicting % mutational ITH in prostate cancer. Normalized T2 values may contribute as a non-invasive rapidly acquired surrogate assessment of mutational ITH to potentially guided decisions regarding patient management.
Larger prospective studies should be conducted to confirm this association and evaluate the prognostic ability of this the T2nSI metric.
Acknowledgements
A grant from the UCLH Biomedical Research Centre supports EJ and SP's work on this topic.References
1 Morris LGT, Riaz N, Desrichard A, et al. Pan-cancer analysis of intratumor heterogeneity as a prognostic determinant of survival. Oncotarget. 2016; 7: 10051–63.
2 Kirkham a PS, Haslam P, Keanie JY, et al. Prostate MRI: who, when, and how? Report from a UK consensus meeting. Clin Radiol 2013; 68: 1016–23.
3 Barentsz JO, Richenberg J, Clements R, et al. ESUR prostate MR guidelines 2012. Eur Radiol 2012; 22: 746–57.
4 Gibbs P, Liney GP, Pickles MD et al.. Correlation of ADC and T2 measurements with cell density in prostate cancer at 3.0 Tesla. Invest Radiol 2009; 44: 572–6.
5 Langer DL, van der Kwast TH, Evans AJ, et al. Prostate tissue composition and MR measurements: investigating the relationships between ADC, T2, K(trans), v(e), and corresponding histologic features. Radiology. 2010; 255: 485–94.
6 Schilling AM, Blankenburg FB, Bernarding J, et al. Intracerebral pH affects the T2 relaxation time of brain tissue. Neuroradiology 2002; 44: 968–72.
Figures