4784
Improving the Reproducibility of Quantitative Imaging Metrics for Multicentre Multiparametric Prostate MRI Trials1Centre for Medical Imaging, University College London, London, United Kingdom, 2Centre for Medical Image Computing, University College London, London, United Kingdom
Synopsis
Whilst multi-scanner studies provide the most robust evidence for quantitative imaging trials, they tend to be limited by poor reproducibility of scans performed on different scanners. In this study, 14 patients underwent paired multiparametric prostate MRI within 3 months of each other. We found that normalisation of T2 signal to the bladder improved the reproducibility of both peripheral zone and transition zone metrics considerably when compared with the current convention of using obturator internus. Whilst ADC also met sufficient levels of reproducibility, semiquantiative and quantitative DCE analysis and histographic features failed to do so.
PURPOSE:
The multi-scanner reproducibility of quantitative MRI-derived metrics remains undetermined in the human prostate. This is something of a shortcoming, as multicentre studies provide the most robust level of evidence of clinical efficacy in Radiology research, and are often the only practical way of achieving statistical power. However, such studies are prone to lower levels of reproducibility as manufacturers, acquisition parameters, hardware and software often vary between centres1. Simple methods to improve the reproducibility of MRI metrics would therefore be welcome.
We seek to determine the reproducibility of quantitative multiparametric prostate MRI metrics, and consider whether they can be improved by very simple means; namely normalization to different anatomical structures or by using metrics that are independent on overall image scaling.
METHODS:
14 men with a median age of 60.7 years (IQR 66.5 – 78.2) undergoing repeat mp-MRI examinations within 3 months or less were identified from an existing database.
Multiparametric Prostate Magnetic Resonance Imaging
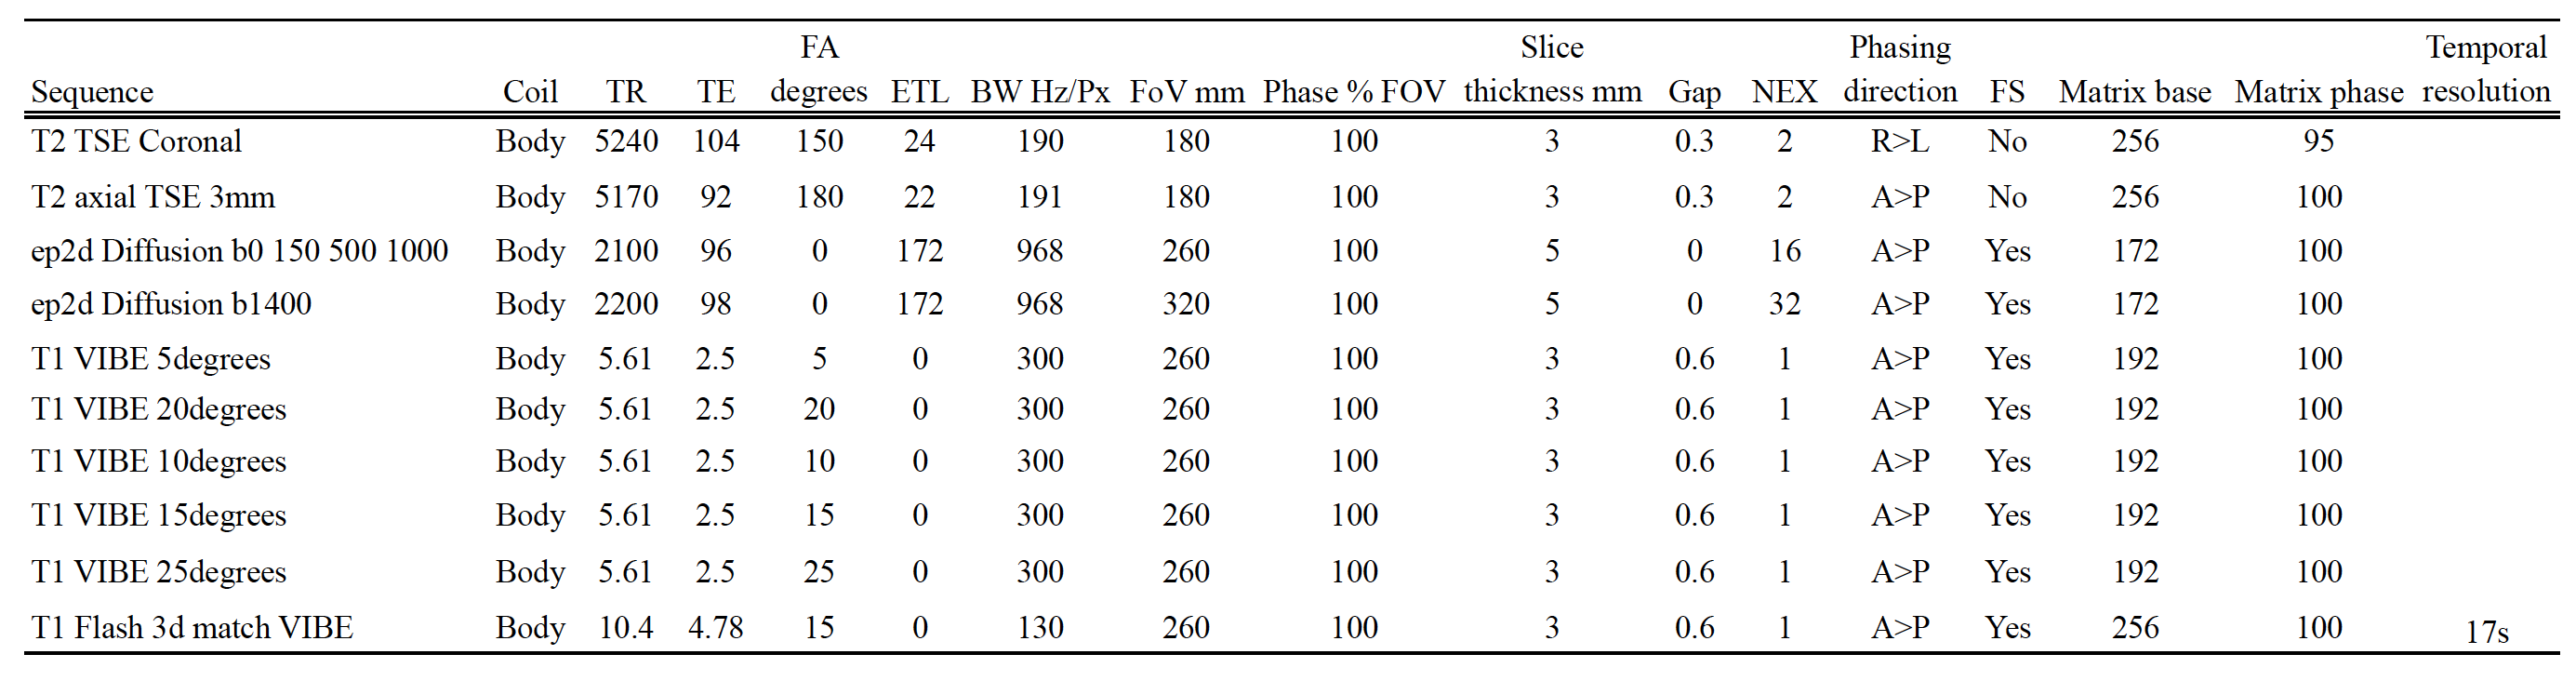
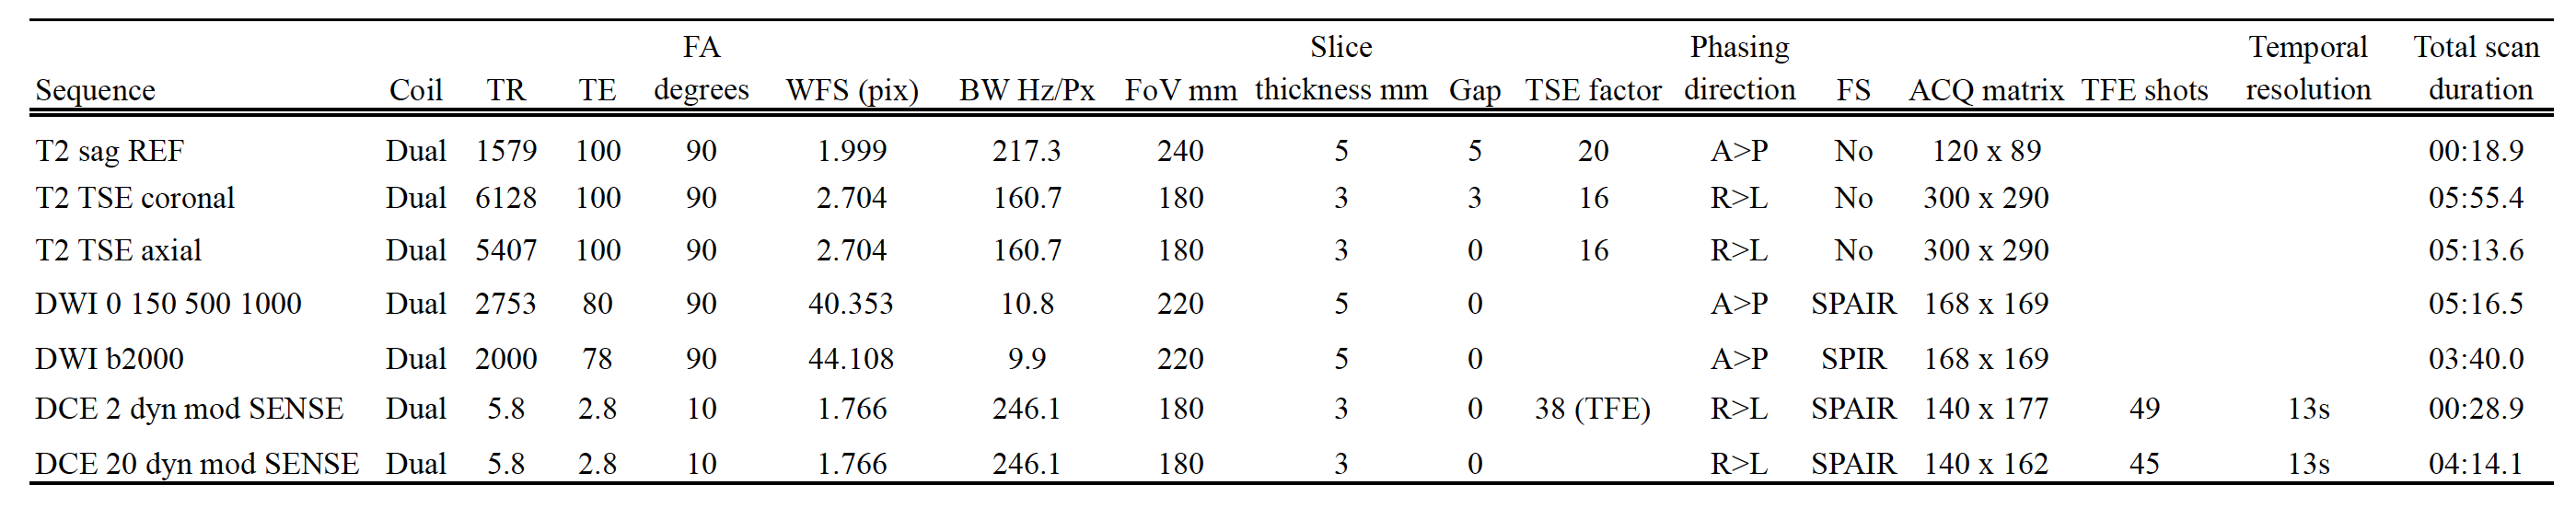
All patients underwent ‘Scan 1’ on one of 3 possible 1.5T scanners, each with the same scanning protocol (Avanto, Siemens, Germany), followed by ‘Scan 2’ on one of 2 possible 3T scanners, each with the same scanning protocol (Achieva or Ingenia, Philips, NL). Acquisition protocols were compliant with European Society of Urogenital Radiology guidelines2 and are shown in tables 1 and 2.
Quantitative imaging parameter extraction
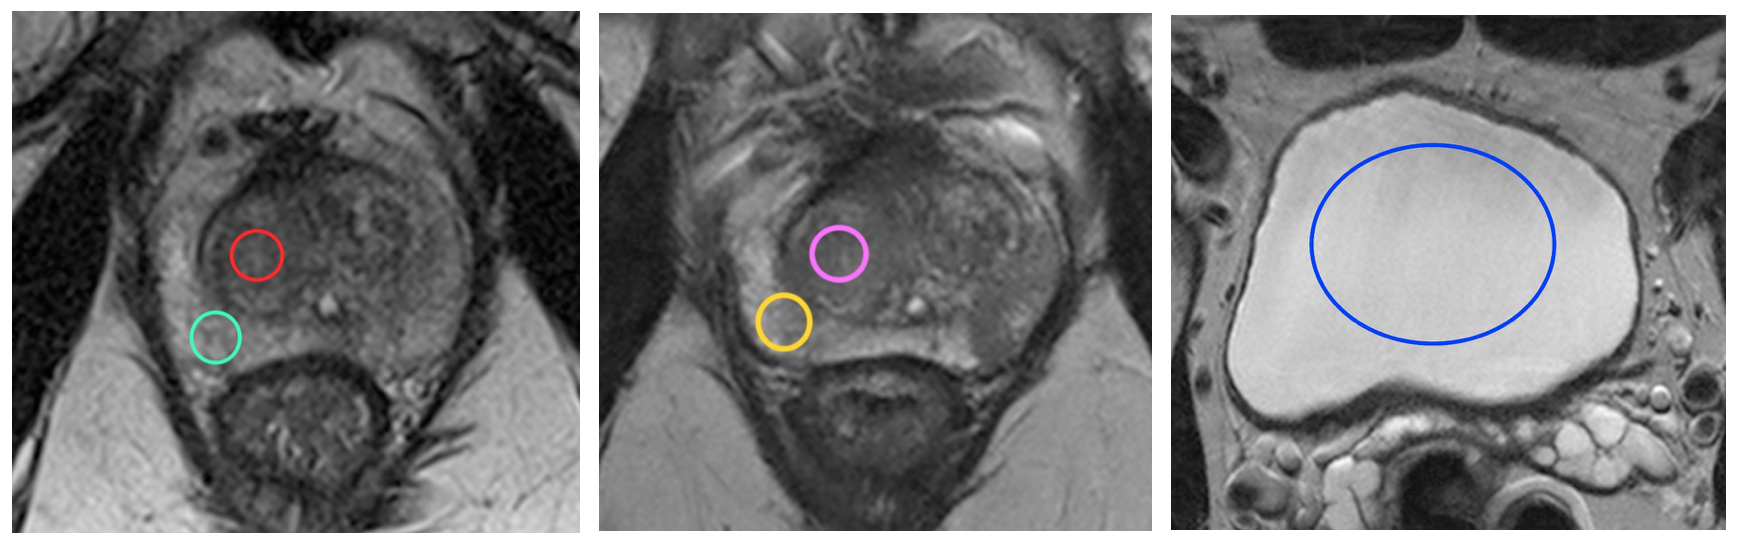
Datasets were analysed by a board certified radiologist using a standard 40mm2 region of interest (ROI) placed on the normal transition zone (TZ) and peripheral zone (PZ) for scan 1, and then copied onto scan 2, with subsequent manual refinement if necessary. A typical example of imaging parameter extraction is shown in figure 1.
Median T2 signal intensities (SI) were normalized to the largest possible ROI placed on i) the obturator internus muscle (OI) ii) the bladder urine signal. ADC values were i) measured directly and ii) normalized to the bladder urine signal (the OI has too low a signal-to-noise ratio on ADC maps). DCE metrics were calculated by dividing the early-enhanced (EE) image (defined as the second image following prostatic contrast enhancement) to the pre-contrast prostate. DCE curve parameters3 and extended ‘Tofts’ analysis4 of DCE images were extracted using in-house software, as were values for the standard deviation, entropy, skewness and kurtosis of ROI histograms5. The effect of normalization on histographic metrics was also considered using the mean signal intensity of the bladder for T2 and ADC metrics, and the normal precontrast prostate for EE DCE.
Normalised metrics were calculated by dividing the signal intensity of the prostate metric by the mean signal intensity of the normalization region.
Statistical methods
Lin’s concordance correlation coefficients were calculated in order to assess scan-rescan reproducibility6.
RESULTS:
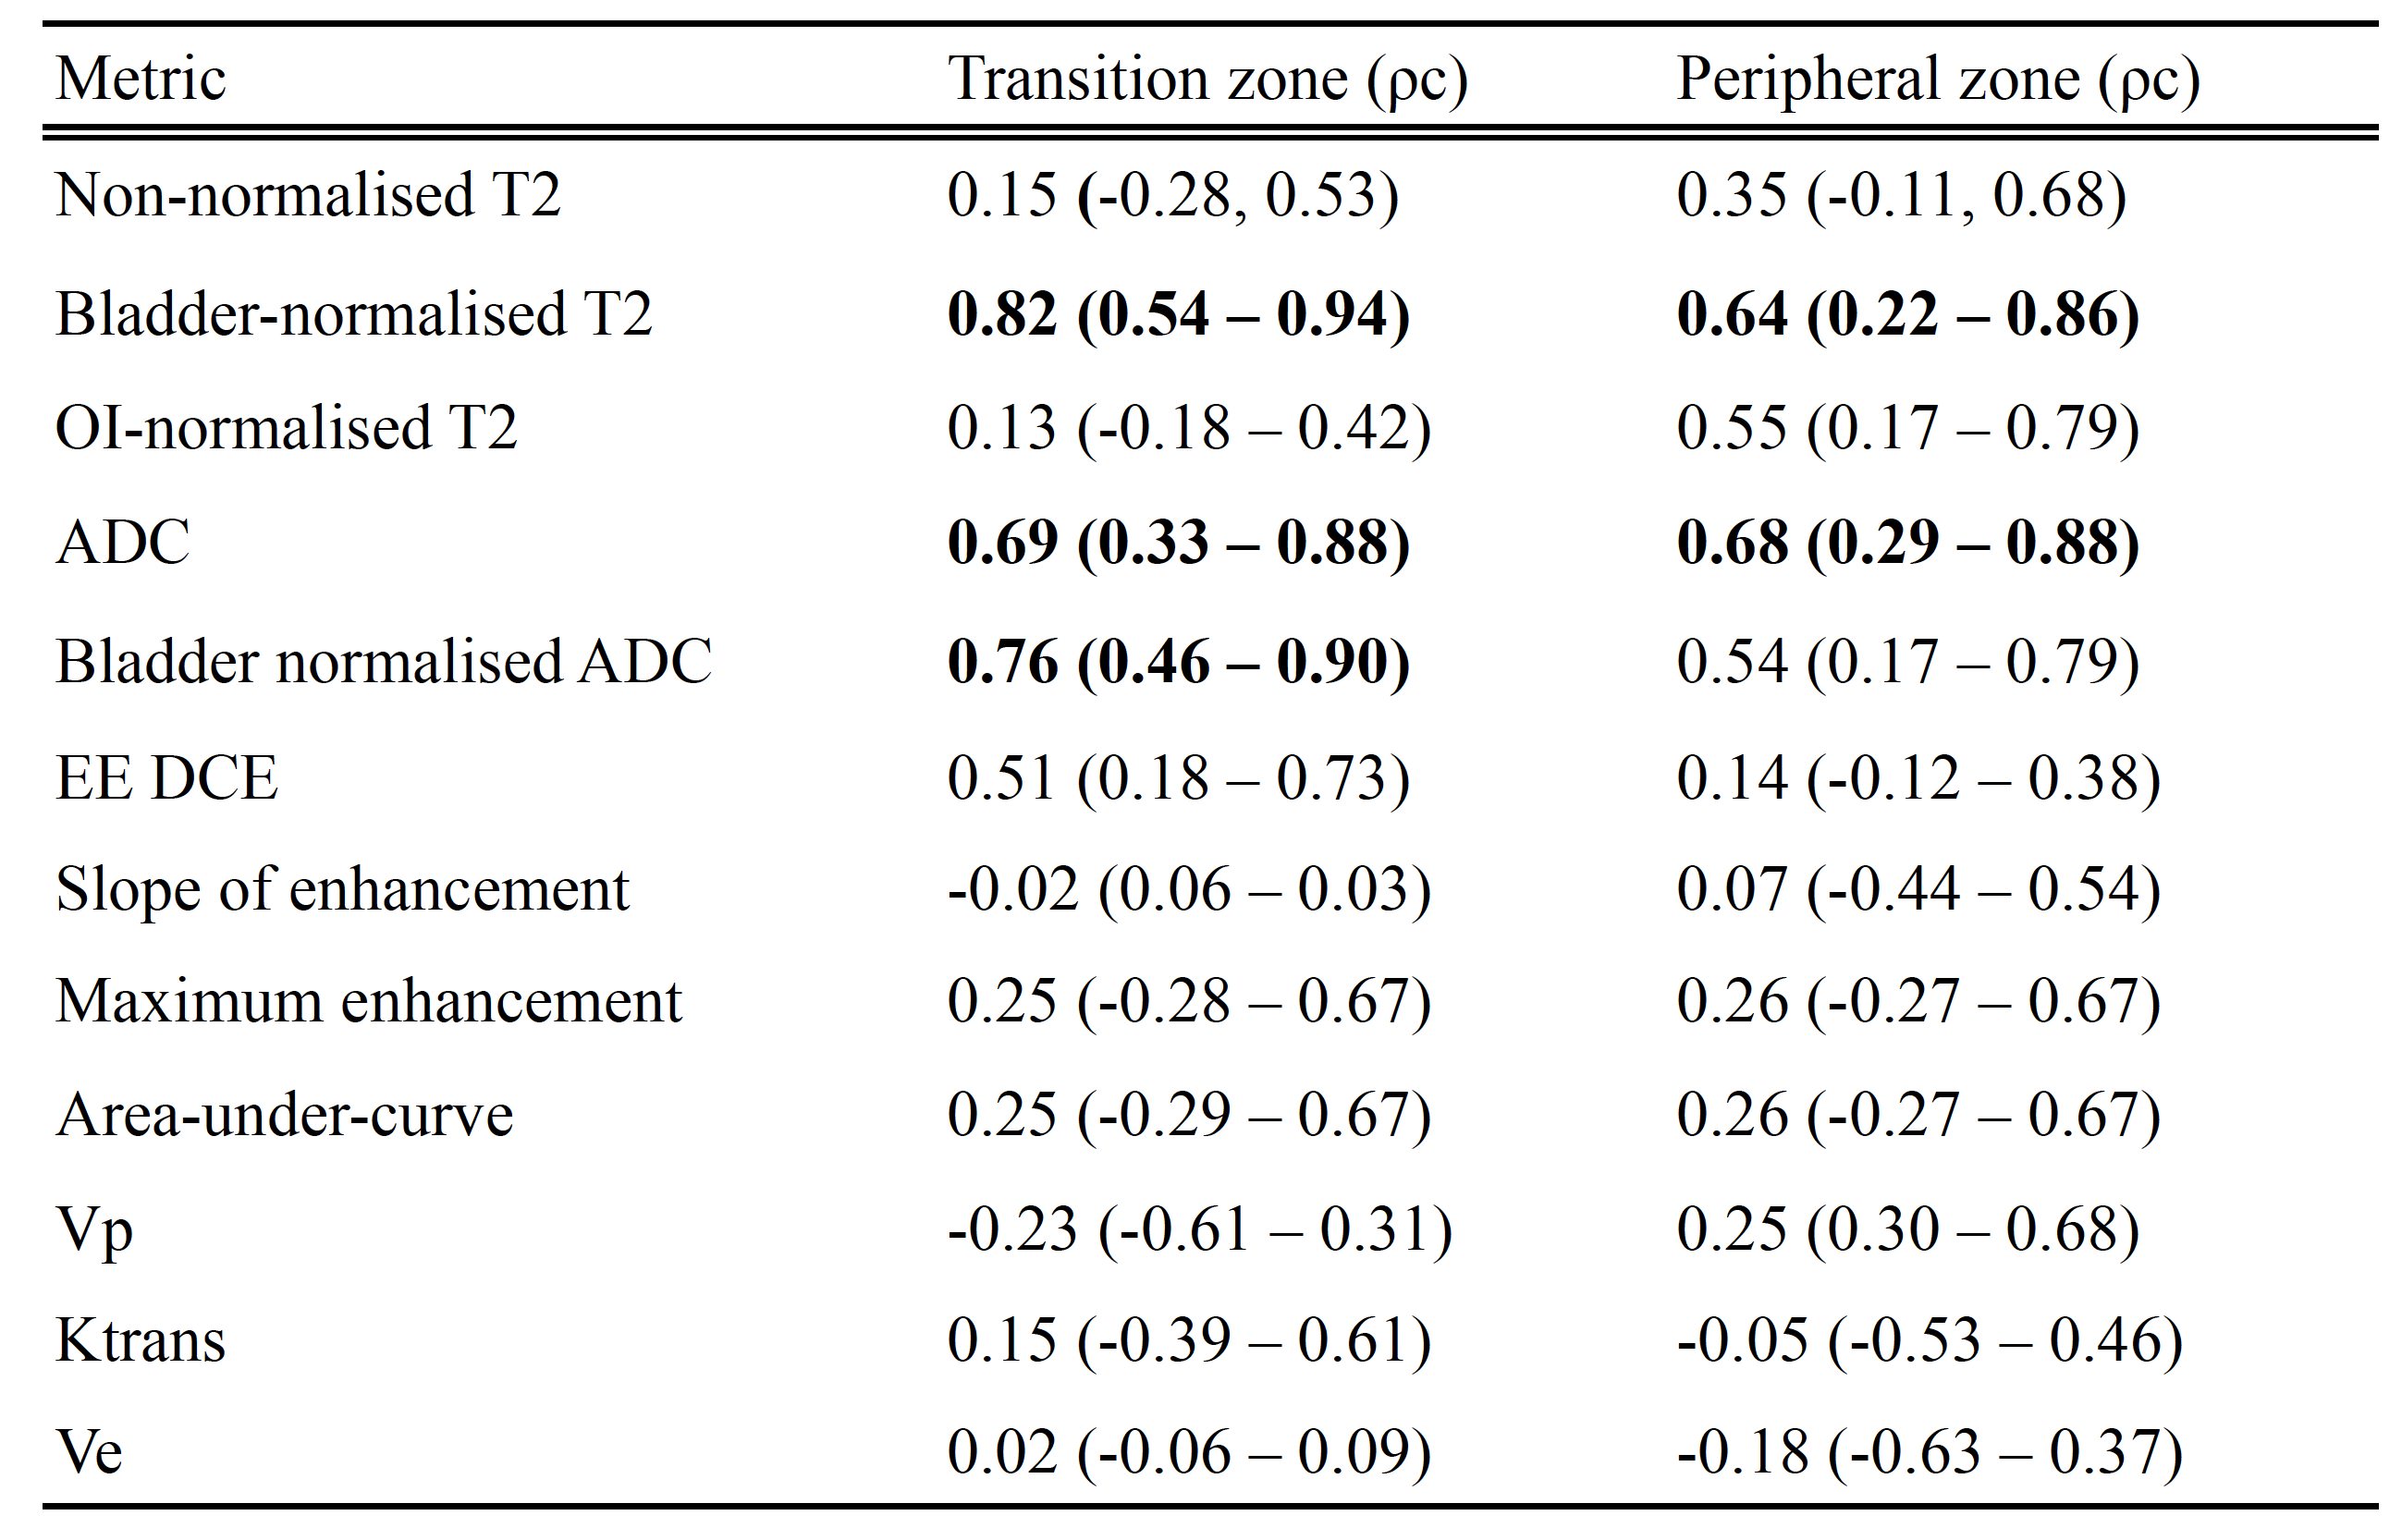
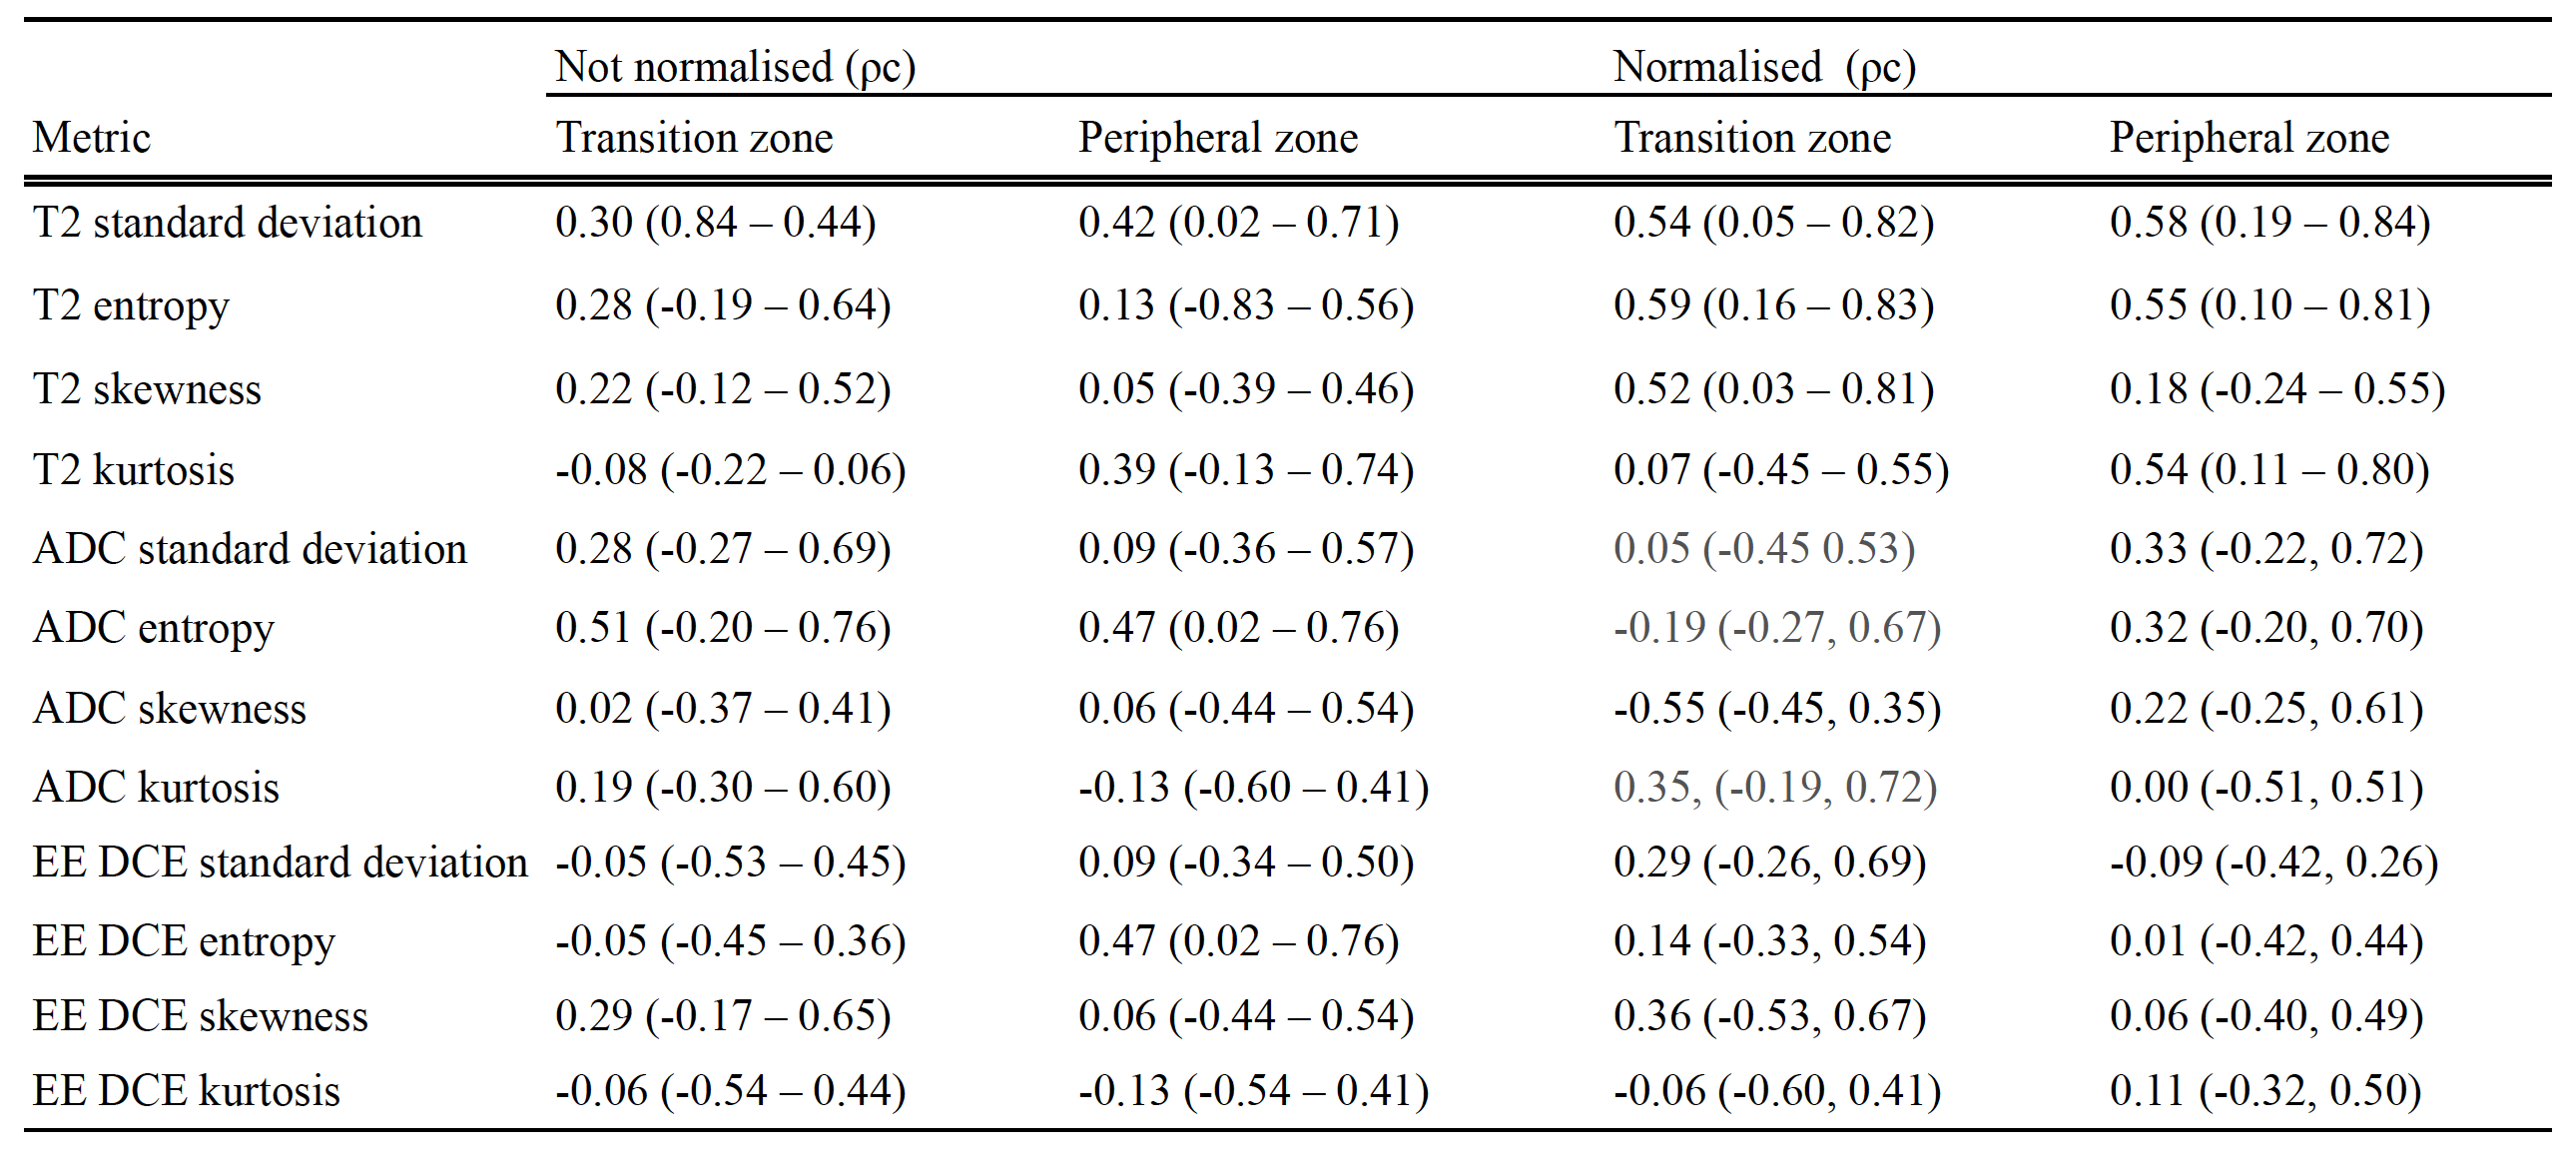
Lin’s concordance
correlation coefficients (ρc) are provided in table 3 for mean values, and table 4 for histographic features. Metrics meeting substantial agreement of
0.60 or higher were considered sufficiently reproducible7 and are shown in bold.
DISCUSSION:
To our knowledge, this is the first study to report the scan-rescan reproducibility of quantitative multiparametric prostate MRI metrics. We have shown that to compare T2 signal intensity between scanners, a normalization region must be selected and normalization to the bladder urine signal is vastly preferable to OI, as has tended to be the convention in studies to date8–10. The reason for this is likely to be related to the higher signal-to-noise ratio of the bladder and the more consistent nature of urine signal.
ADC was marginally less reproducible than bladder-normalized T2 signal, but is still sufficiently reproducible, and we were unable to definitively confirm whether normalizing ADC to the bladder (to obviate scaling factors) is beneficial.
Overall, the reproducibility of DCE metrics was poor, but best for normalized EE DCE. This is perhaps unsurprising given the variable nature of contrast bolus timings, cardiac output, compromise with clinically desired spatial resolution, coverage and fat saturation whereby it is not possible to achieve a short enough temporal resolution for accurate full DCE fitting. Our results also suggest that histographic features are not sufficiently reproducible to be considered useful metrics in multicentre trials (without strict standardisation of imaging protocols), despite improvement with normalisation in some cases.
CONCLUSION:
We report for the first time the reproducibility of quantitative imaging parameters in the normal human prostate.
T2 is the most reproducible metric, and should be normalized to the bladder rather than the OI muscle; a finding that could have considerable impact for multi-scanner prostate imaging trials in the future.
If DCE analysis is to be performed, its reproducibility should be optimized by careful standardization of protocols.
Acknowledgements
A grant from the UCLH Biomedical Research Centre supports the work of EJ and SP on this topic.References
1 Tofts PS, Collins DJ. Multicentre imaging measurements for oncology and in the brain. Br J Radiol 2011; 84. DOI:10.1259/bjr/74316620.
2 Barentsz JO, Richenberg J, Clements R, et al. ESUR prostate MR guidelines 2012. Eur Radiol 2012; 22: 746–57.
3 Zelhof B, Lowry M, Rodrigues G, Kraus S, Turnbull L. Description of magnetic resonance imaging-derived enhancement variables in pathologically confirmed prostate cancer and normal peripheral zone regions. BJU Int 2009; 104: 621–7.
4 Tofts PS. Modeling tracer kinetics in dynamic Gd-DTPA MR imaging. J Magn Reson Imaging; 7: 91–101.
5 Just N. Improving tumour heterogeneity MRI assessment with histograms. Br J Cancer 2014; 111: 2205–13.
6 Sullivan DC, Obuchowski NA, Kessler LG, et al. Metrology Standards for Quantitative Imaging. 2015; 277: 813–25.
7 Landis JR, Koch GG. The measurement of observer agreement for categorical data. Biometrics 1977; 33: 159–74.
8 Dinh AH, Souchon R, Melodelima C. Characterization of prostate cancer using T2 mapping at 3 T?: A multi-scanner study. Diagn Interv Imaging 2014. DOI:10.1016/j.diii.2014.11.016.
9 Engelhard K, Hollenbach HP, Deimling M, Kreckel M, Riedl C. Combination of signal intensity measurements of lesions in the peripheral zone of prostate with MRI and serum PSA level for differentiating benign disease from prostate cancer. Eur Radiol 2000;10: 1947–53.
10 Dikaios N, Alkalbani J, Sidhu HS, et al. Logistic regression model for diagnosis of transition zone prostate cancer on multi-parametric MRI. Eur Radiol 2014; published online Sept 17. DOI:10.1007/s00330-014-3386-4.
Figures