4783
Single Slice vs. Volumetric Analysis of Multiparametric Prostate MRI Metrics1Centre for Medical Imaging, University College London, London, United Kingdom, 2Radiology, University College London Hospitals, London, United Kingdom, 3Centre for Medical Image Computing, University College London, London, United Kingdom
Synopsis
Despite consensus guidelines advising volumetric analysis of tumours over single slice region-of-interest analysis, there is little data in the literature to support this recommendation. In this study we compare the reproducibility between each of these two methods in 20 patients with prostate cancer and also determine the intraobserver repeatability of each method. We show high levels of agreement and intraobserver repeatability in both of these methods. This study suggests that region-of-interest analysis is a perfectly acceptable analytical method and may have higher intraoberver repeatability than volumetric analysis, and could expedite the analysis of multiparametric prostate MRI datasets in clinical trials.
PURPOSE:
Consensus statements have recommended multislice volumetric of interest (VOI) analysis of entire lesions over single slice, region-of-interest (ROI) analysis1. Consequently, software has been developed to facilitate volumetric analysis as it can be time consuming or impractical with most clinical reporting systems. However, there is absence of data to support the use of either method in the multiparametric prostate literature.
In this study, we seek to investigate whether i) the quantitative values extracted using both methods are comparable, and ii) assess their intra-observer repeatability for each component of multiparametric prostate MRI; namely T2-weighted, apparent diffusion coefficient (ADC) and dynamic contrast enhanced (DCE) imaging.
METHODS:
Patient demographics
20 patients, with a median age of 62.9 years (IQR 59.6 – 69.1) were identified from an existing trial database. 11 had peripheral zone (PZ) tumours and 9 had transition zone (TZ) tumours, as confirmed by targeted biopsy following MRI. Only one lesion per patient was included in the analysis, which were scored Likert 4 or 5. Tumours > 0.5cc and present on at least 3 contiguous ADC slices were selected (Median 2.1cm3, IQR 0.8 – 3.0). 4 tumours were Gleason 3+3, 14 were Gleason 3+4 and 2 were Gleason 4+4.
Acquisition protocol
MRI was performed with a 3T scanner (Achieva, Philips Healthcare, Netherlands) using a pelvic phased-array coil. The mp-MRI included axial and coronal small field of view T2- weighted imaging; and was supplemented by axial diffusion weighted imaging (DWI) and dynamic contrast enhanced (DCE) imaging, compliant with both European Society of Urogenital Radiology2 and UK3 guidelines. Full MRI parameters are provided in table 1.
Image analysis
A board certified radiologist extracted quantitative MRI parameters for each lesion using open source Osirix software (Bernex, Switzerland) to contour single tumour slices, and MIM (Cleveland, USA) proprietorial software to contour the entire tumour volume. MIM software uses semiautomatic rigid translational co-registration of T2-weighted, apparent diffusion coefficient (ADC) and dynamic contrast enhanced images, which can be manually refined if required. Contours are placed on all registered sequences contemporaneously, unlike Osirix where separate placement of ROIs is necessitated. An example workflow from MIM is shown in figure 1.
In each case, the radiologist was aware of the location of the index lesion, using diagrams produced from the MRI reporting proforma. Contouring was performed within a period of 1 week between single slice and volumetric measurements to gauge intermethod agreement. The analysis was then repeated following a washout period of 3 months to evaluate intraobserver repeatability.
The mean signal intensity of each ROI/VOI on T2W, ADC and DCE images at all time points was recorded. The early-enhanced (EE) DCE metric was defined as the second image following enhancement of the lesion, and was normalized to the precontrast ROI/VOI.
Statistical analysis
Intermethod comparison: Paired t-tests were performed to assess constant differences. Lin’s concordance correlation coefficient (ρc) and Bland-Altman (B-A) analysis were performed to assess agreement.
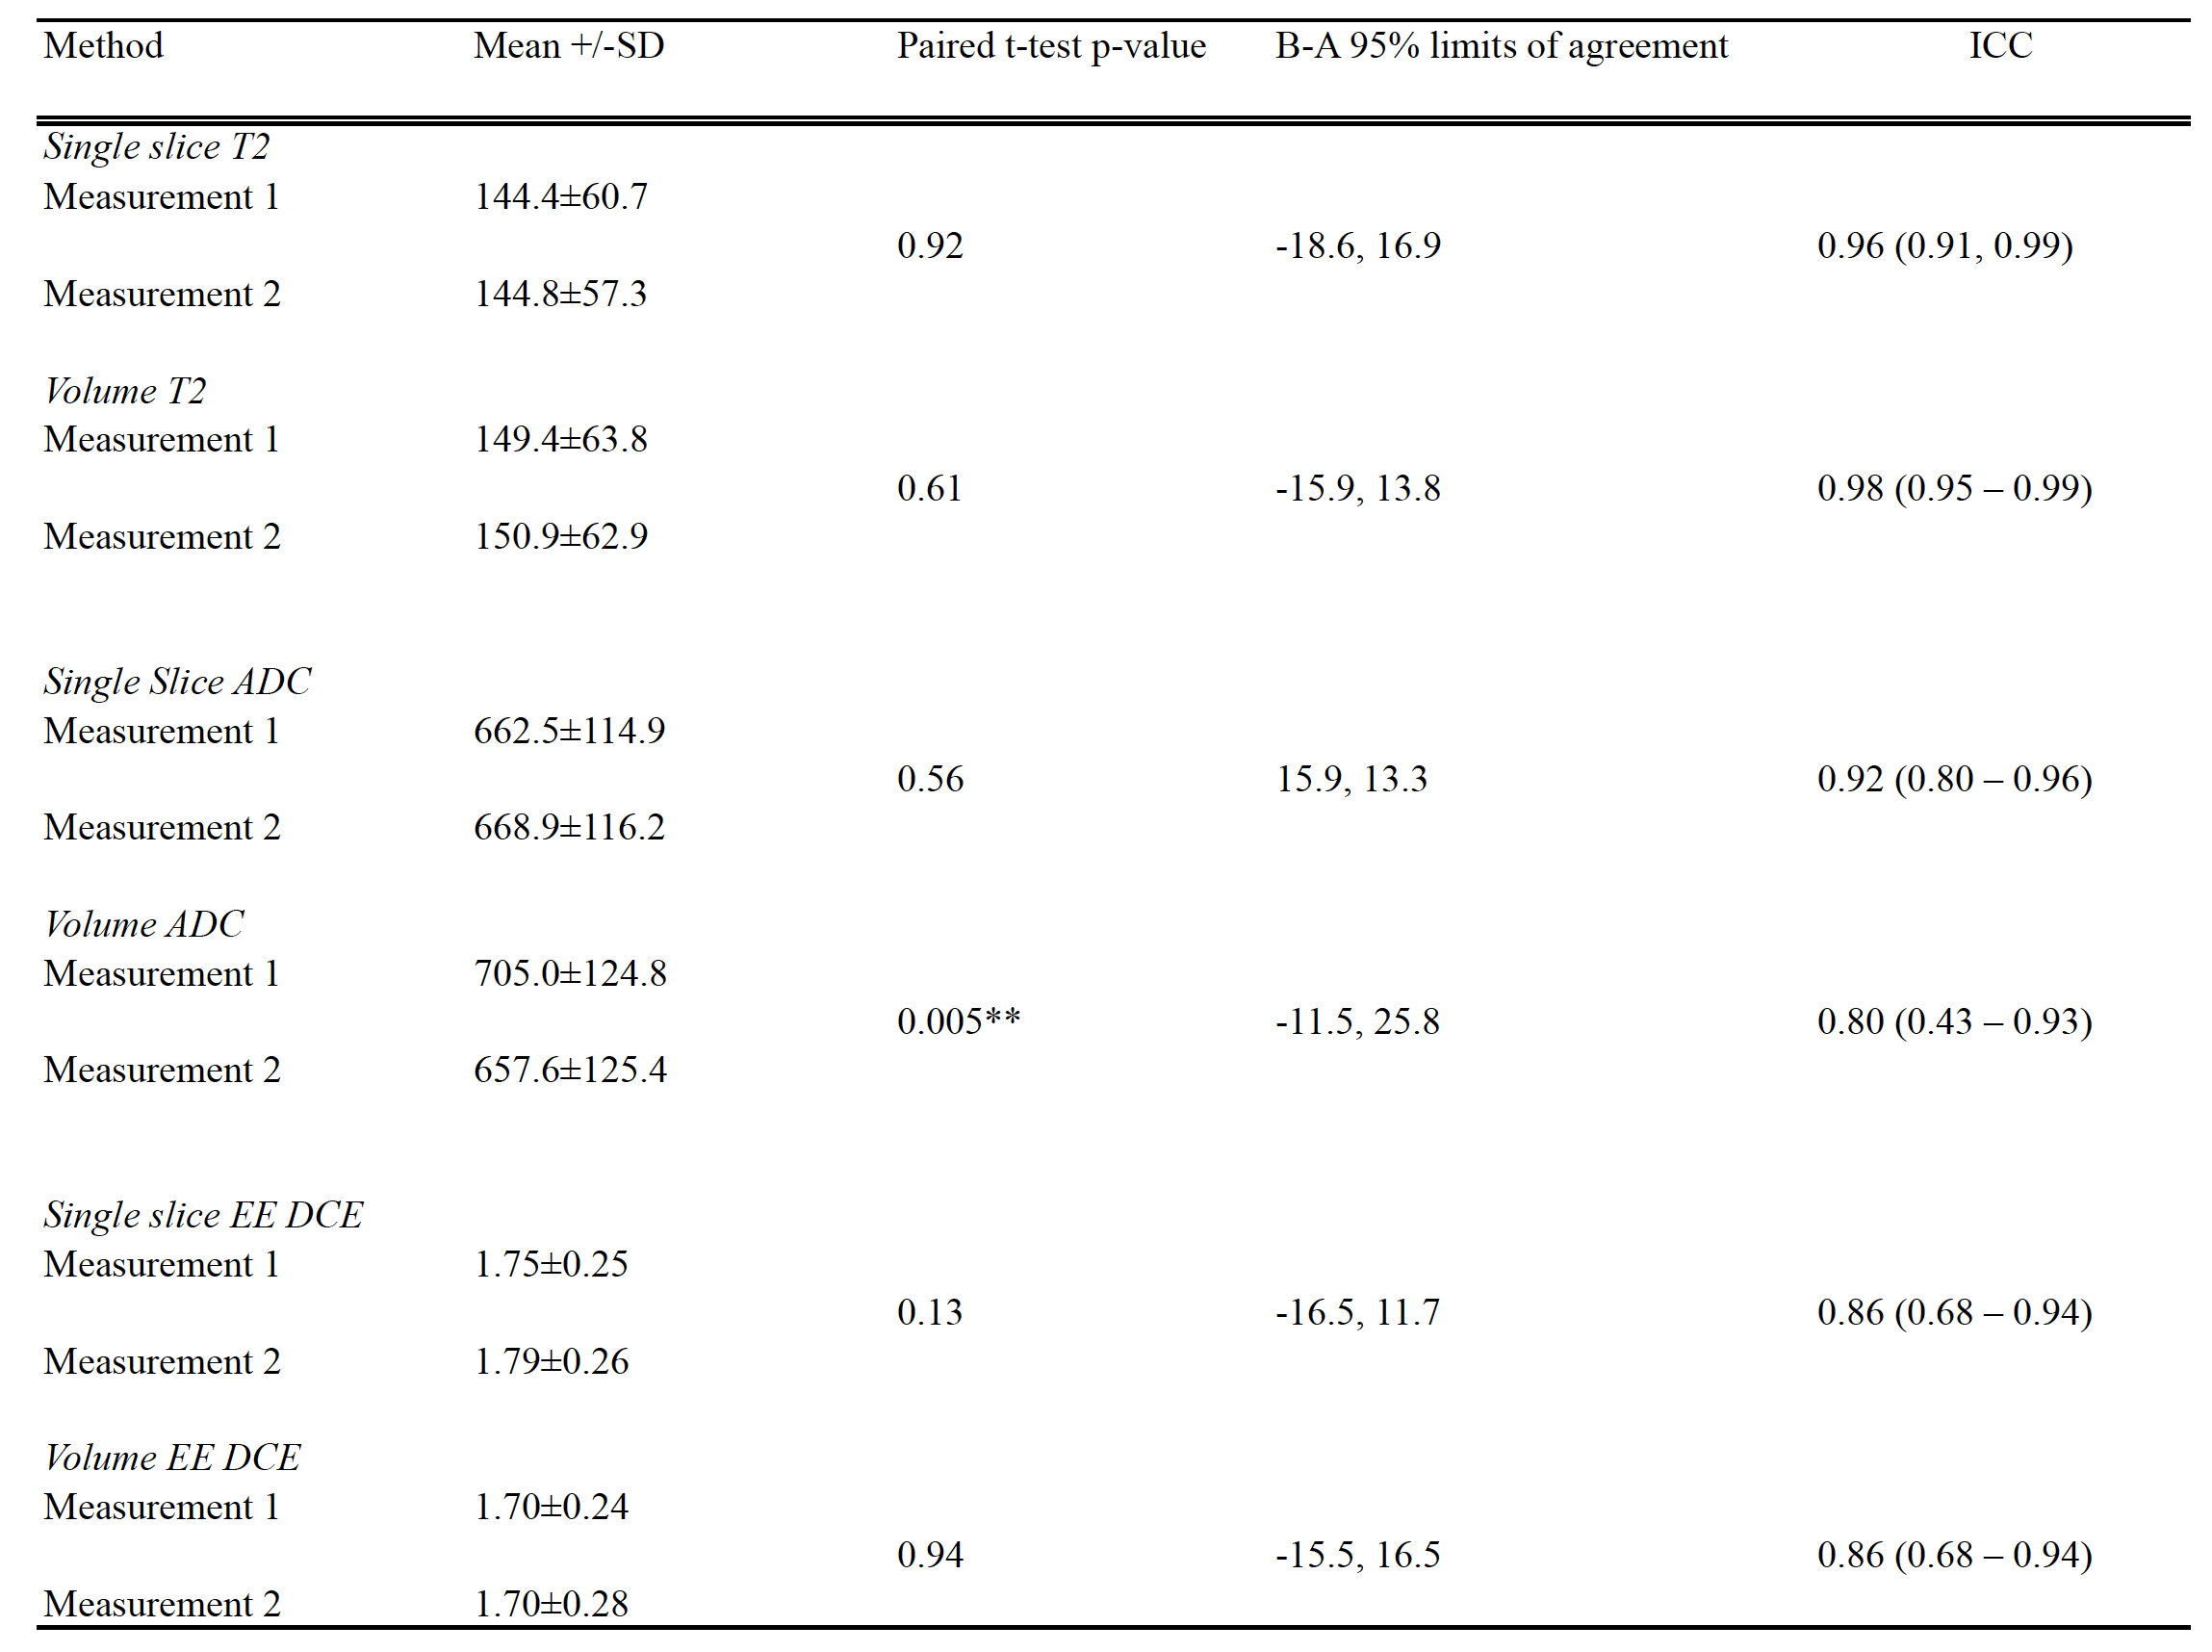
Intraobserver agreement: Paired t-tests, Intraclass Correlation coefficient (ICC) (3,1 with absolute agreement) and B-A analyses were performed.
RESULTS:
Intermethod agreement results are presented in table 2 and figure 2 and intraobserver repeatability results in table 3.
DISCUSSION:
Our study shows that single slice and volumetric analysis of prostate cancer have high levels of agreement for all components of the mp-MRI, with highest concordance for T2-weighted imaging. ADC and DCE have lower levels of agreement, which could be due to smaller numbers of pixels per lesion giving rise to greater potential variability. Volumetric analysis had slightly lower intra-observer repeatability, which could be due to nature of the software used in this study, which uses image registration to make the process of lesion analysis quicker, but could also be expected to introduce more variability. Further work could include the volumetric analysis of tumours without image registration, studying interobserver reproducibility with a greater number of lesions with varying sizes.CONCLUSION:
We show – for the first time - that both that both single slice and volumetric analysis of prostate are valid means of extracting quantitative imaging metrics in multiparametric prostate MRI. The findings of this study suggest that results from studies analysed using a single-slice method are likely to be valid, image analysis in prostate MRI trials can be potentially expedited and the need for proprietorial software could be avoided.Acknowledgements
A grant from the UCLH Biomedical Research Centre supports EJ and SP's work on this topic.References
1 Padhani AR, Liu G, Koh DM, et al. Diffusion-weighted magnetic resonance imaging as a cancer biomarker: consensus and recommendations. Neoplasia 2009; 11: 102–25.
2 Barentsz JO, Richenberg J, Clements R, et al. ESUR prostate MR guidelines 2012. Eur Radiol 2012; 22: 746–57.
3 Kirkham a PS, Haslam P, Keanie JY, et al. Prostate MRI: who, when, and how? Report from a UK consensus meeting. Clin Radiol 2013; 68: 1016–23.
Figures
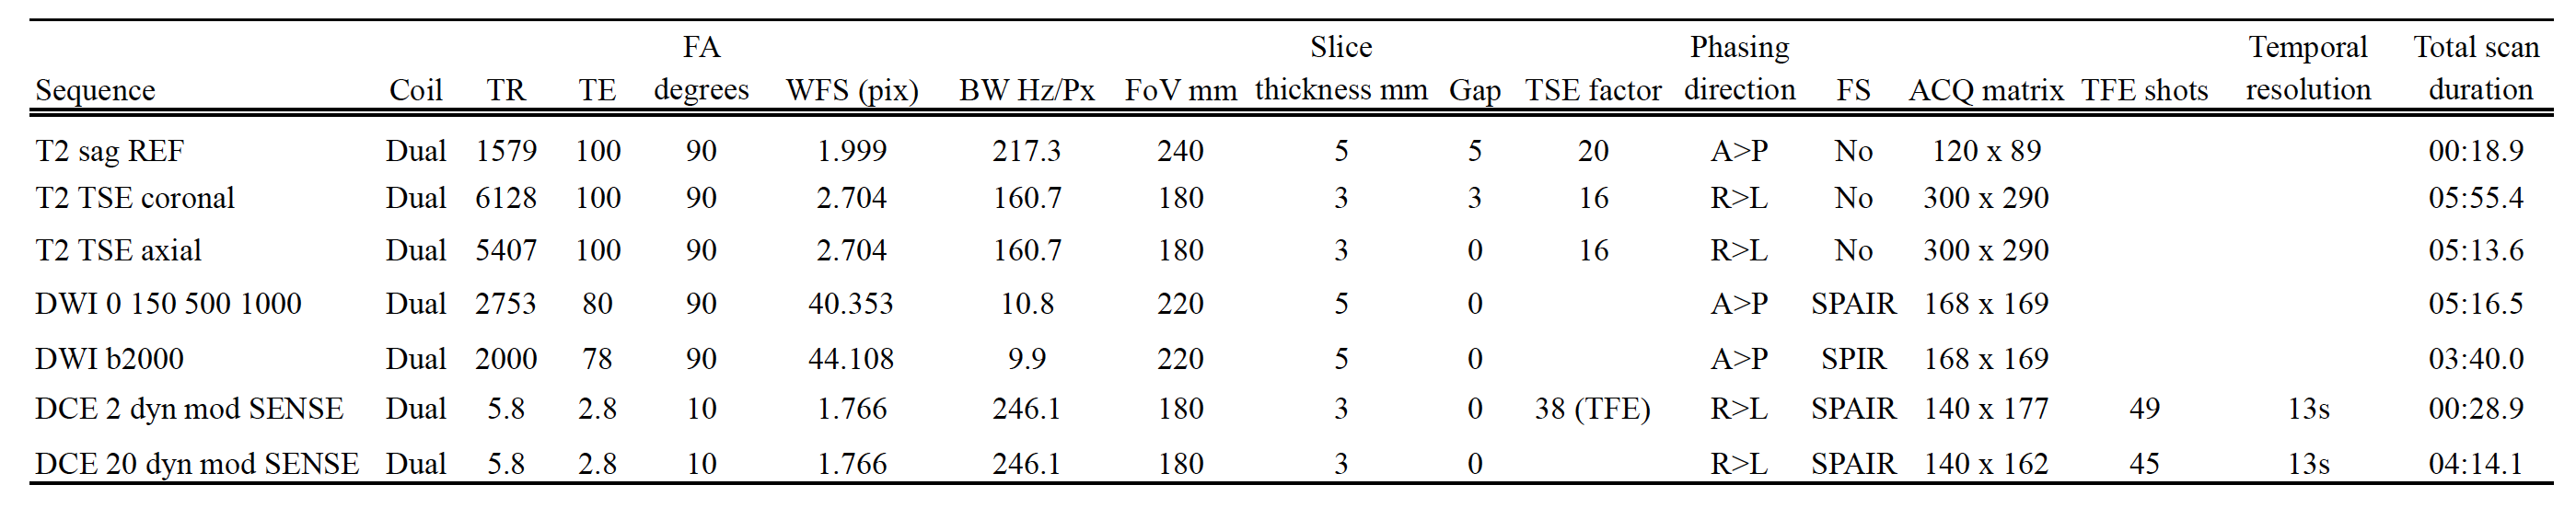
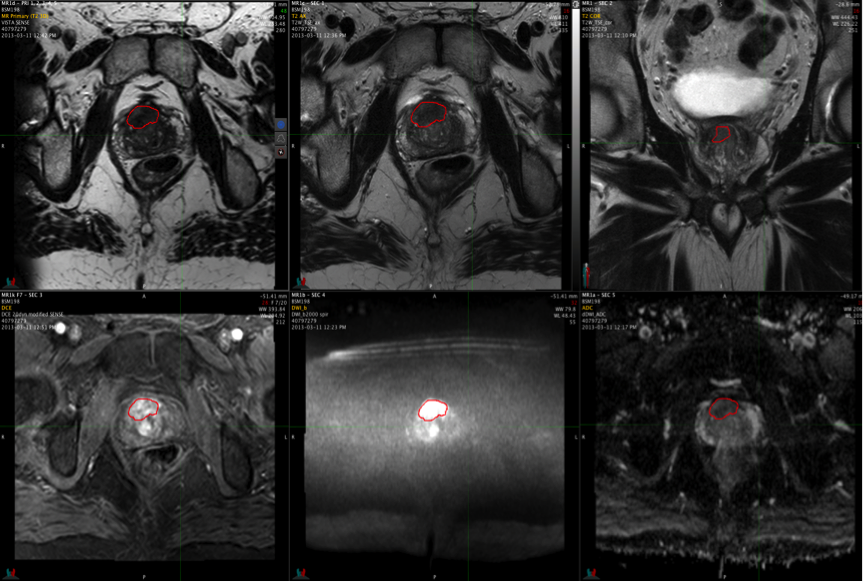
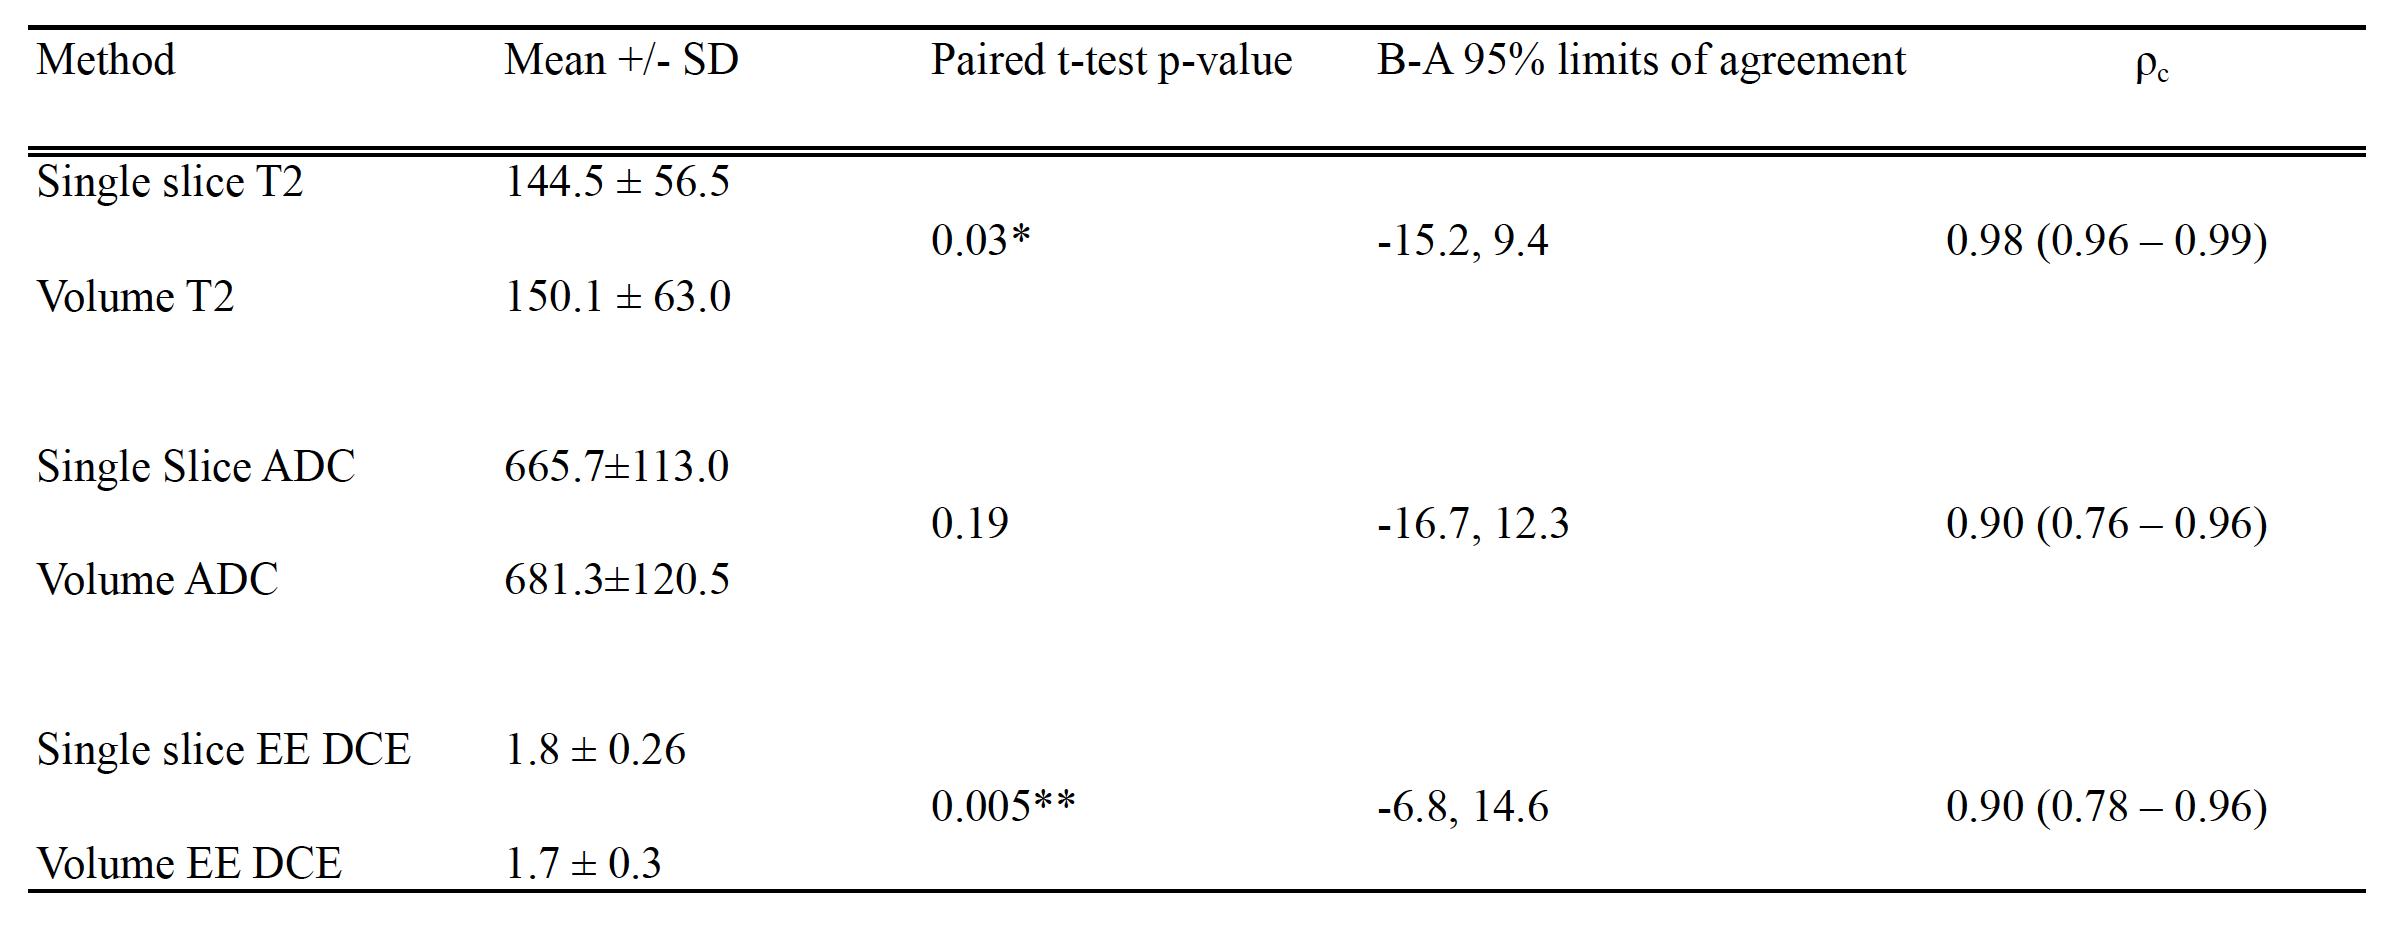
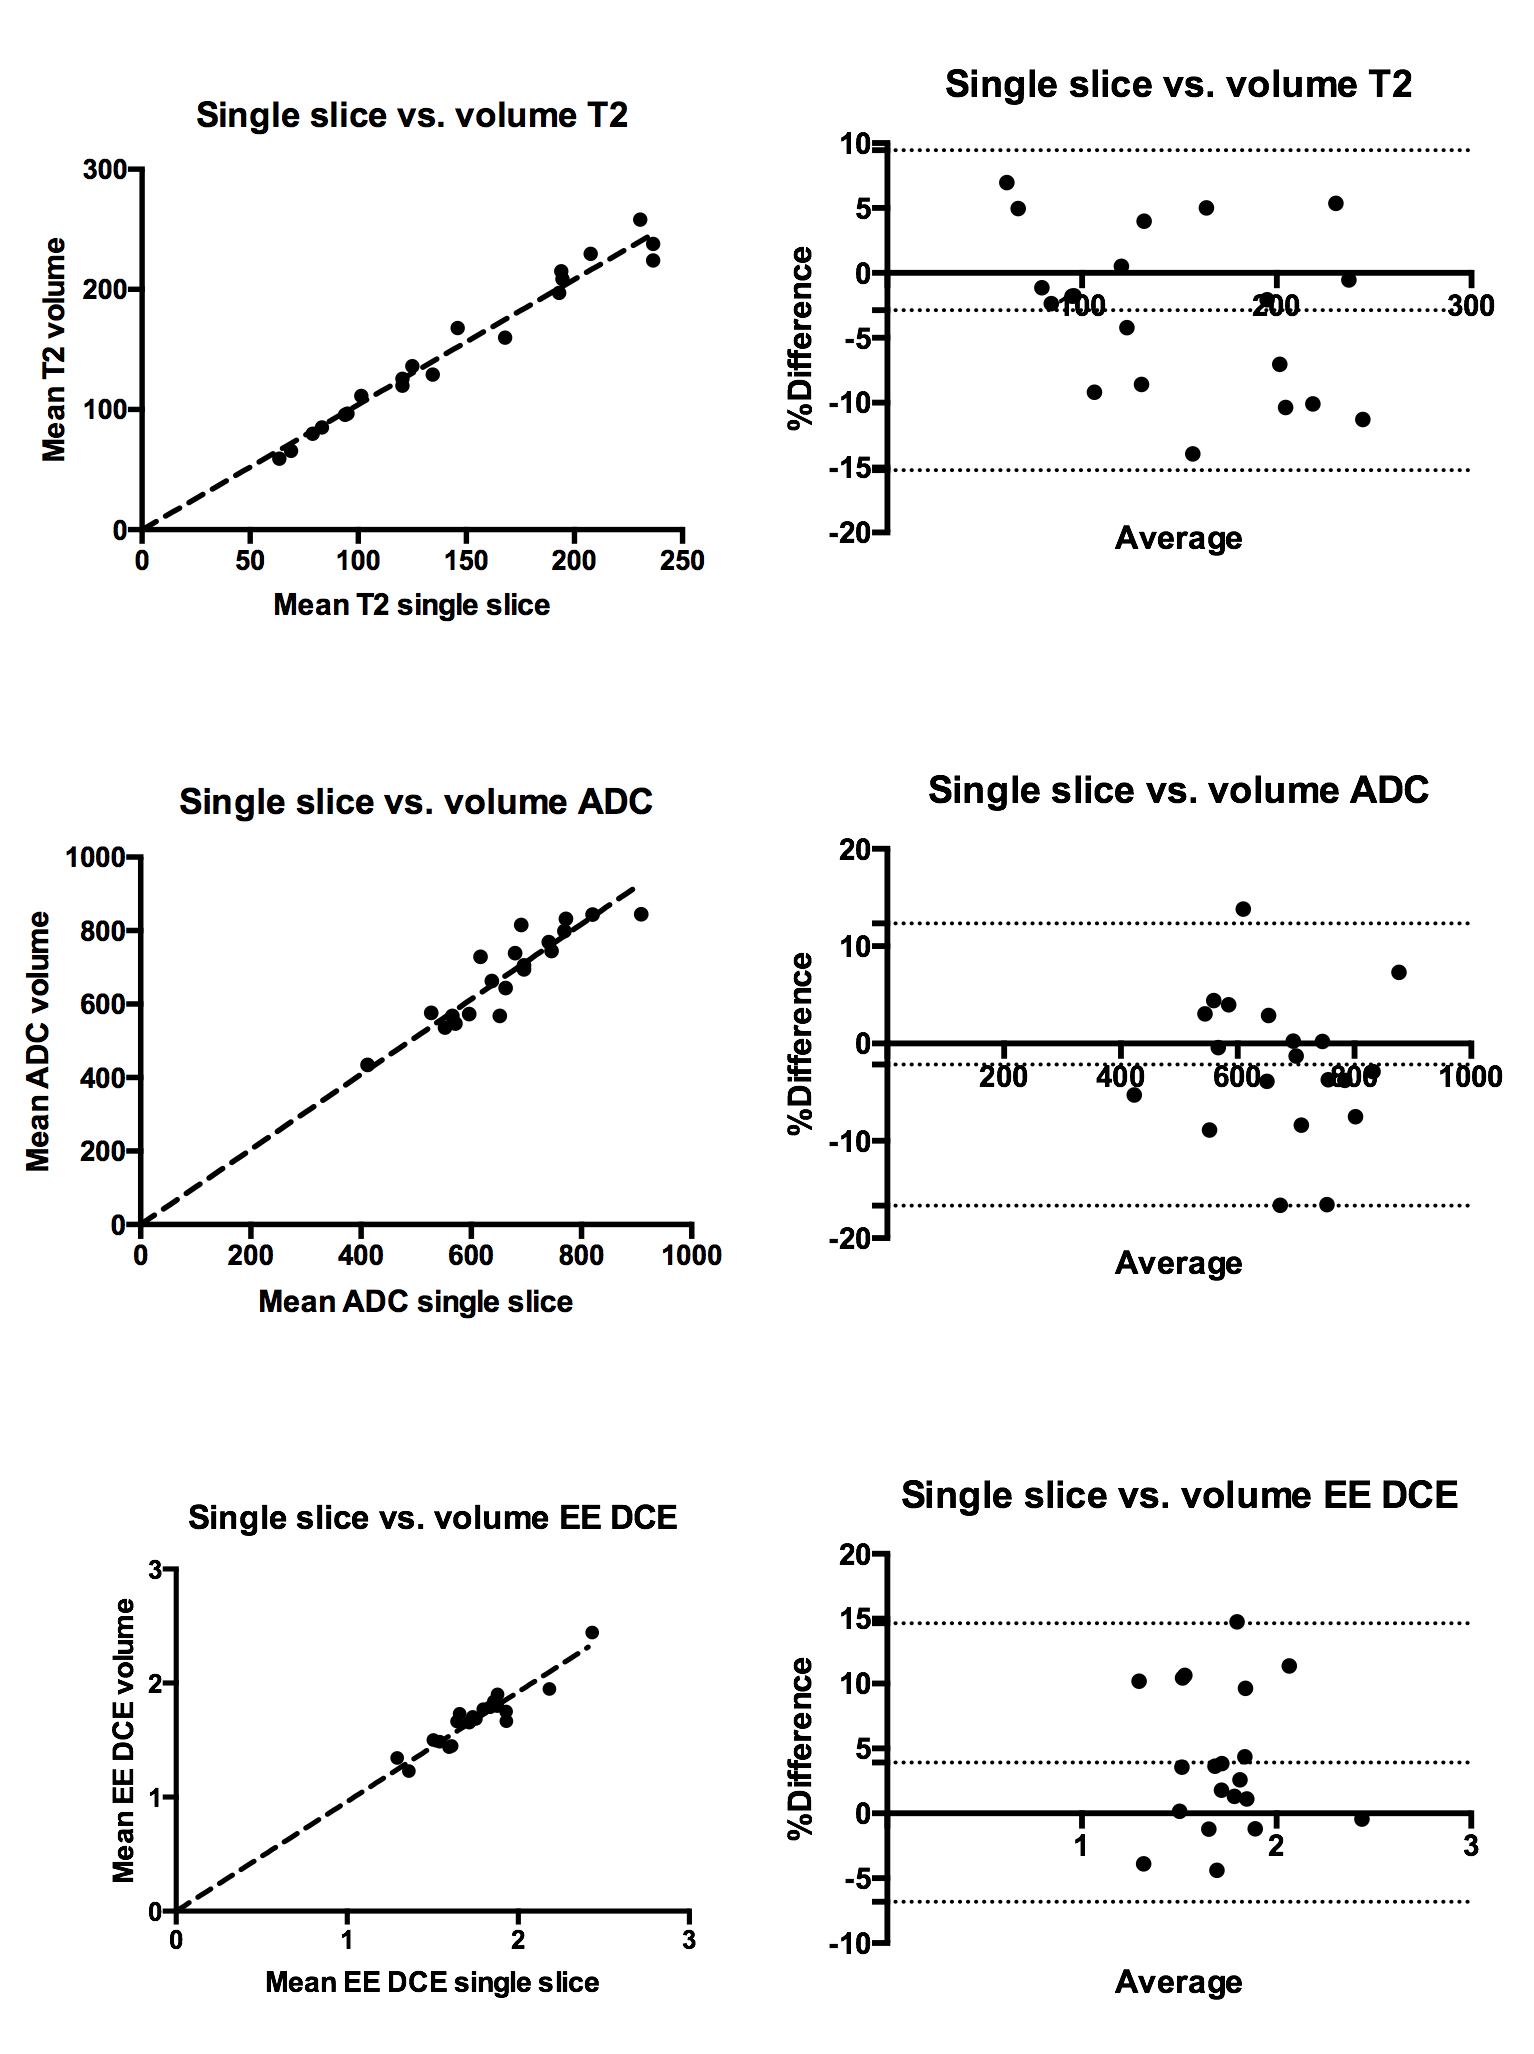
Figure 2. Graphical representation of intermethod reproducibility.
Left column: plots of concordance. Right column: Bland-Altman plots.