4781
DWI of prostate cancer beyond ADC: correlation with histopathology1Translational and Molecular Imaging Institute, Icahn School of Medicine at Mount Sinai, New York, NY, United States, 2Department of Urology, Icahn School of Medicine at Mount Sinai, New York, NY, United States, 3Department of Pathology, Icahn School of Medicine at Mount Sinai, New York, NY, United States
Synopsis
In this study, we correlated advanced DWI [diffusion kurtosis imaging (DKI), stretched-exponential (SE) DWI and diffusion tensor imaging DTI)] parameters with fractional tissue fractions of nuclei, cytoplasm, cells, stroma and lumen and the nuclear-cytoplasmic ratio in prostate cancer (PCa) lesions. We found that all assessed diffusion methods showed significant correlations with cytoplasmic, cellular and/or stromal tissue fractions. Specifically, DKI seems promising for characterization of PCa tissue composition, since multiple significant correlations between histology parameters and both ADCDKI and kurtosis parameter K were observed.
Purpose
There has been recent interest in assessing quantitative DWI parameters beyond ADC in prostate cancer (PCa). Fractional anisotropy (FA) values from diffusion tensor imaging (DTI) measurements have shown to be positively correlated with Gleason score1. Technical advancements have enabled DWI with high b-values (>1000 s/mm2), which allows for modeling of non-Gaussian diffusion behavior using diffusion kurtosis imaging (DKI) or stretched-exponential (SE) models2,3. The goal of this study was to correlate advanced DWI parameters in PCa with tissue composition measurements from histopathology.Methods
MRI acquisition and analysis
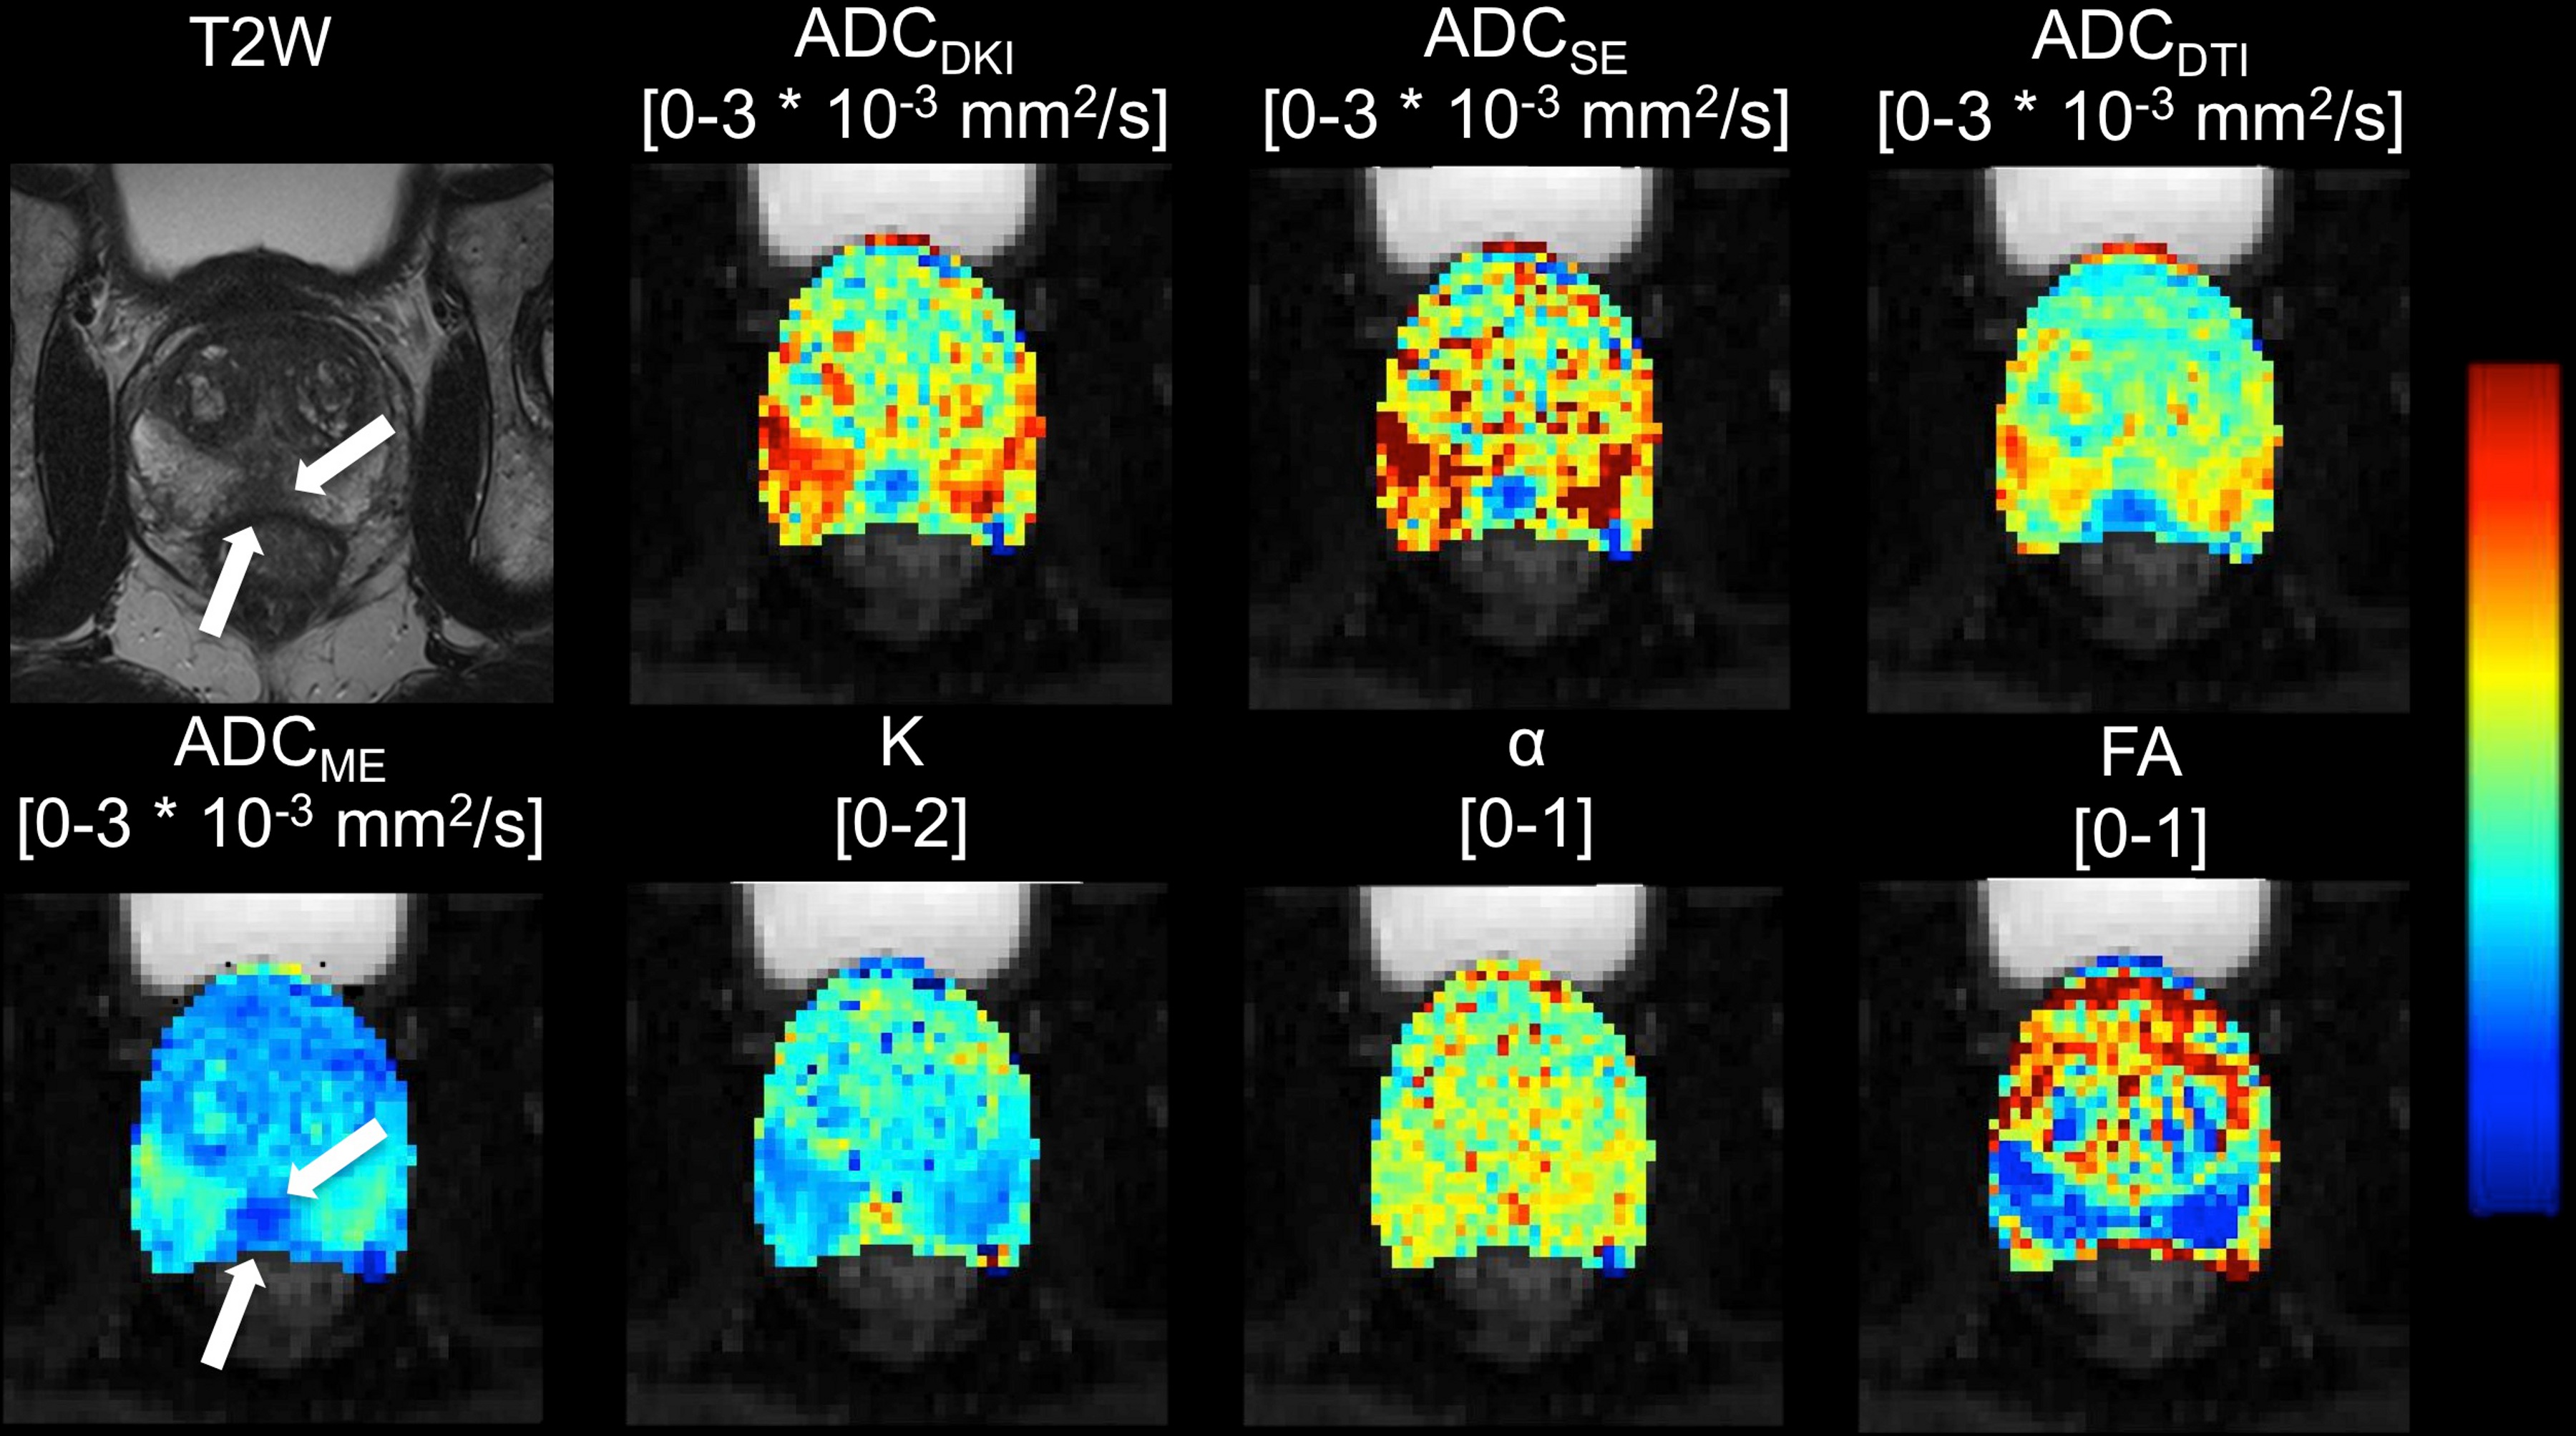
24 patients (mean age 63 y, range 53 – 76 y) with PCa who underwent prostate MRI including high b-value DWI and DTI at 3.0T (Siemens Skyra) before undergoing prostatectomy (within 2 – 102 days) were included in this prospective IRB-approved study. Trace-weighted DWI was performed using axial SS-EPI DWI with b-values 50, 1000, 1600 and 2000 s/mm2 (TR/TE 8700/72 ms, matrix 114x114, FOV 250x250 mm2, slice thickness 3 mm, 39 slices). DTI was performed using SS-EPI with 6 different diffusion directions and b 100 and 600 s/mm2 (TR/TE 4500/60 ms, matrix 114x114, FOV 250x250 mm2, slice thickness 4 mm, 30 slices). DKI [ADCDKI and kurtosis parameter K] and SE [ADCSE and anomalous exponent α] parameter maps were constructed from the high b-value DWI data. A monoexponential fit was performed to determine ADCME (conventional ADC). DTI (ADCDTI and FA) parameter maps were generated by the scanner. Regions of interest were drawn in healthy peripheral zone (PZ) tissue and in the index PCa lesion.
Histopathology
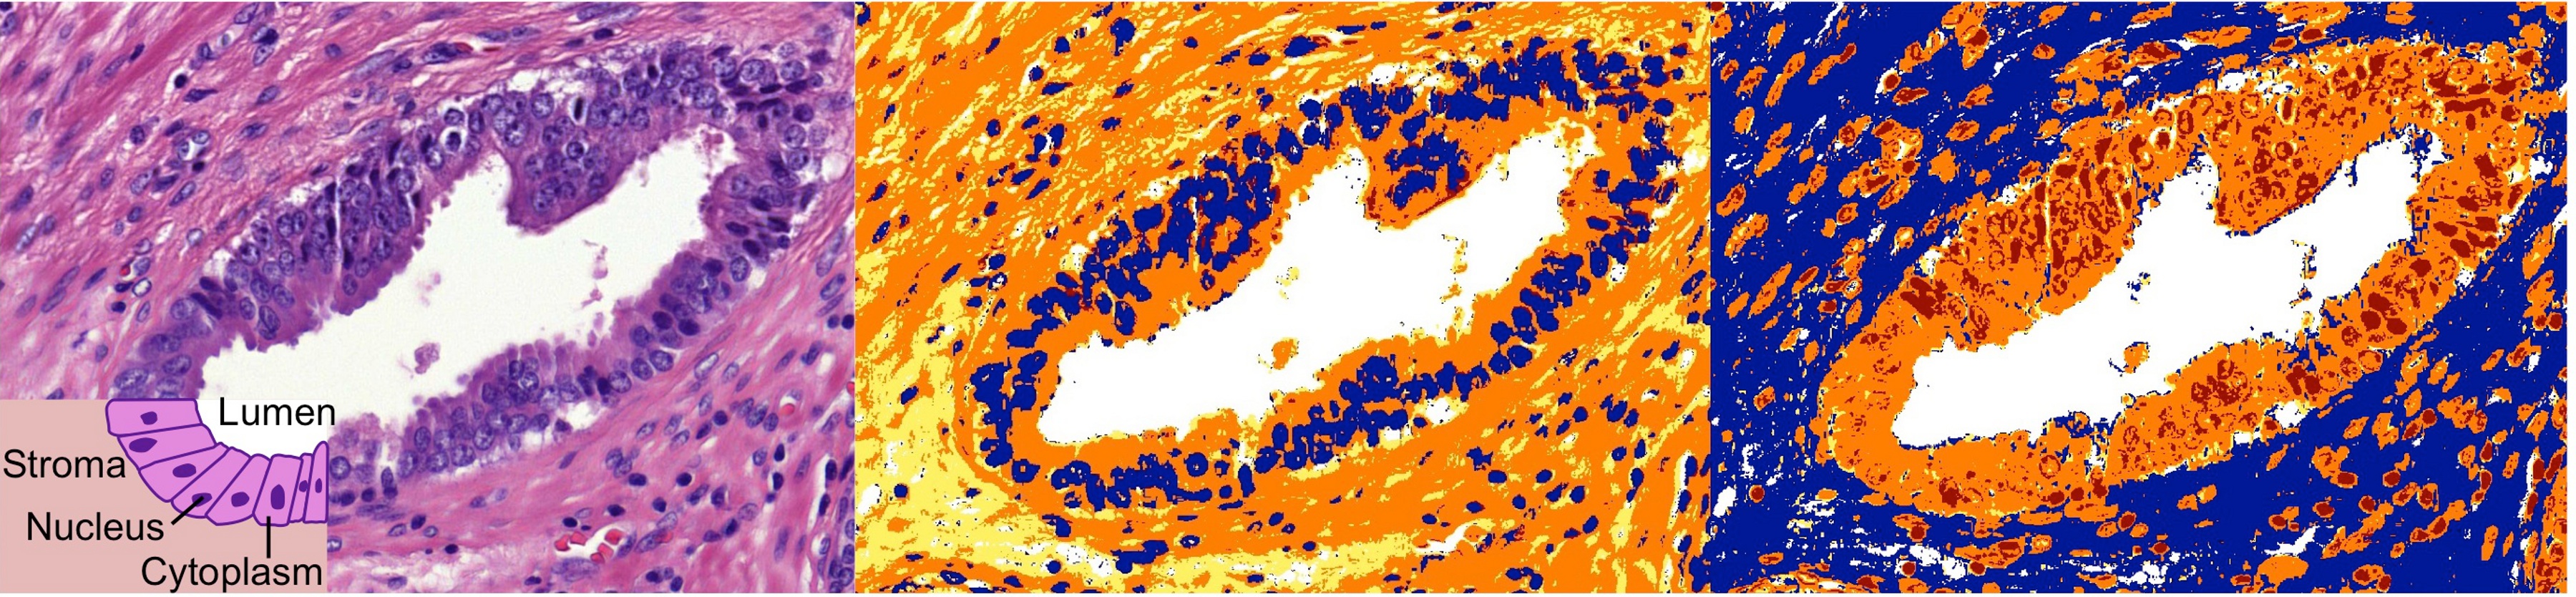
For each index PCa lesion, an H&E-stained section was available. Using semi-automated segmentation (Positive Pixel Count in ImageScope; Aperio Technologies)4, nuclear, cytoplasmic, cellular (nucleus + cytoplasm), stromal and luminal tumor tissue fractions and nuclear-cytoplasmic ratios (N/C=nuclear/cytoplasmic fraction) were derived (Figure 1). Gleason score (GS) and pathology stage were retrieved from the pathology report.
Statistics
Differences in diffusion parameters between PZ and PCa lesions were tested using Wilcoxon signed-rank tests. Differences in DWI parameters between GS≤7 and GS>7 and between pathology stage pT2 and pT3 were tested using Mann-Whitney U tests. Spearman correlation analysis was performed to assess the correlation between PCa diffusion parameter values and histological measurements. In addition, correlation between histology and combinations of parameters was assessed using multiple linear regression.
Results
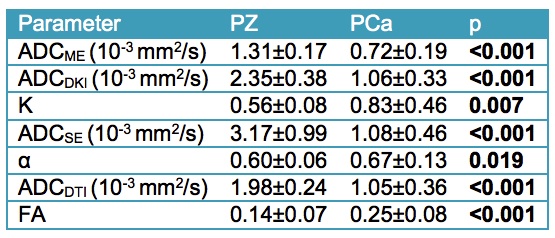
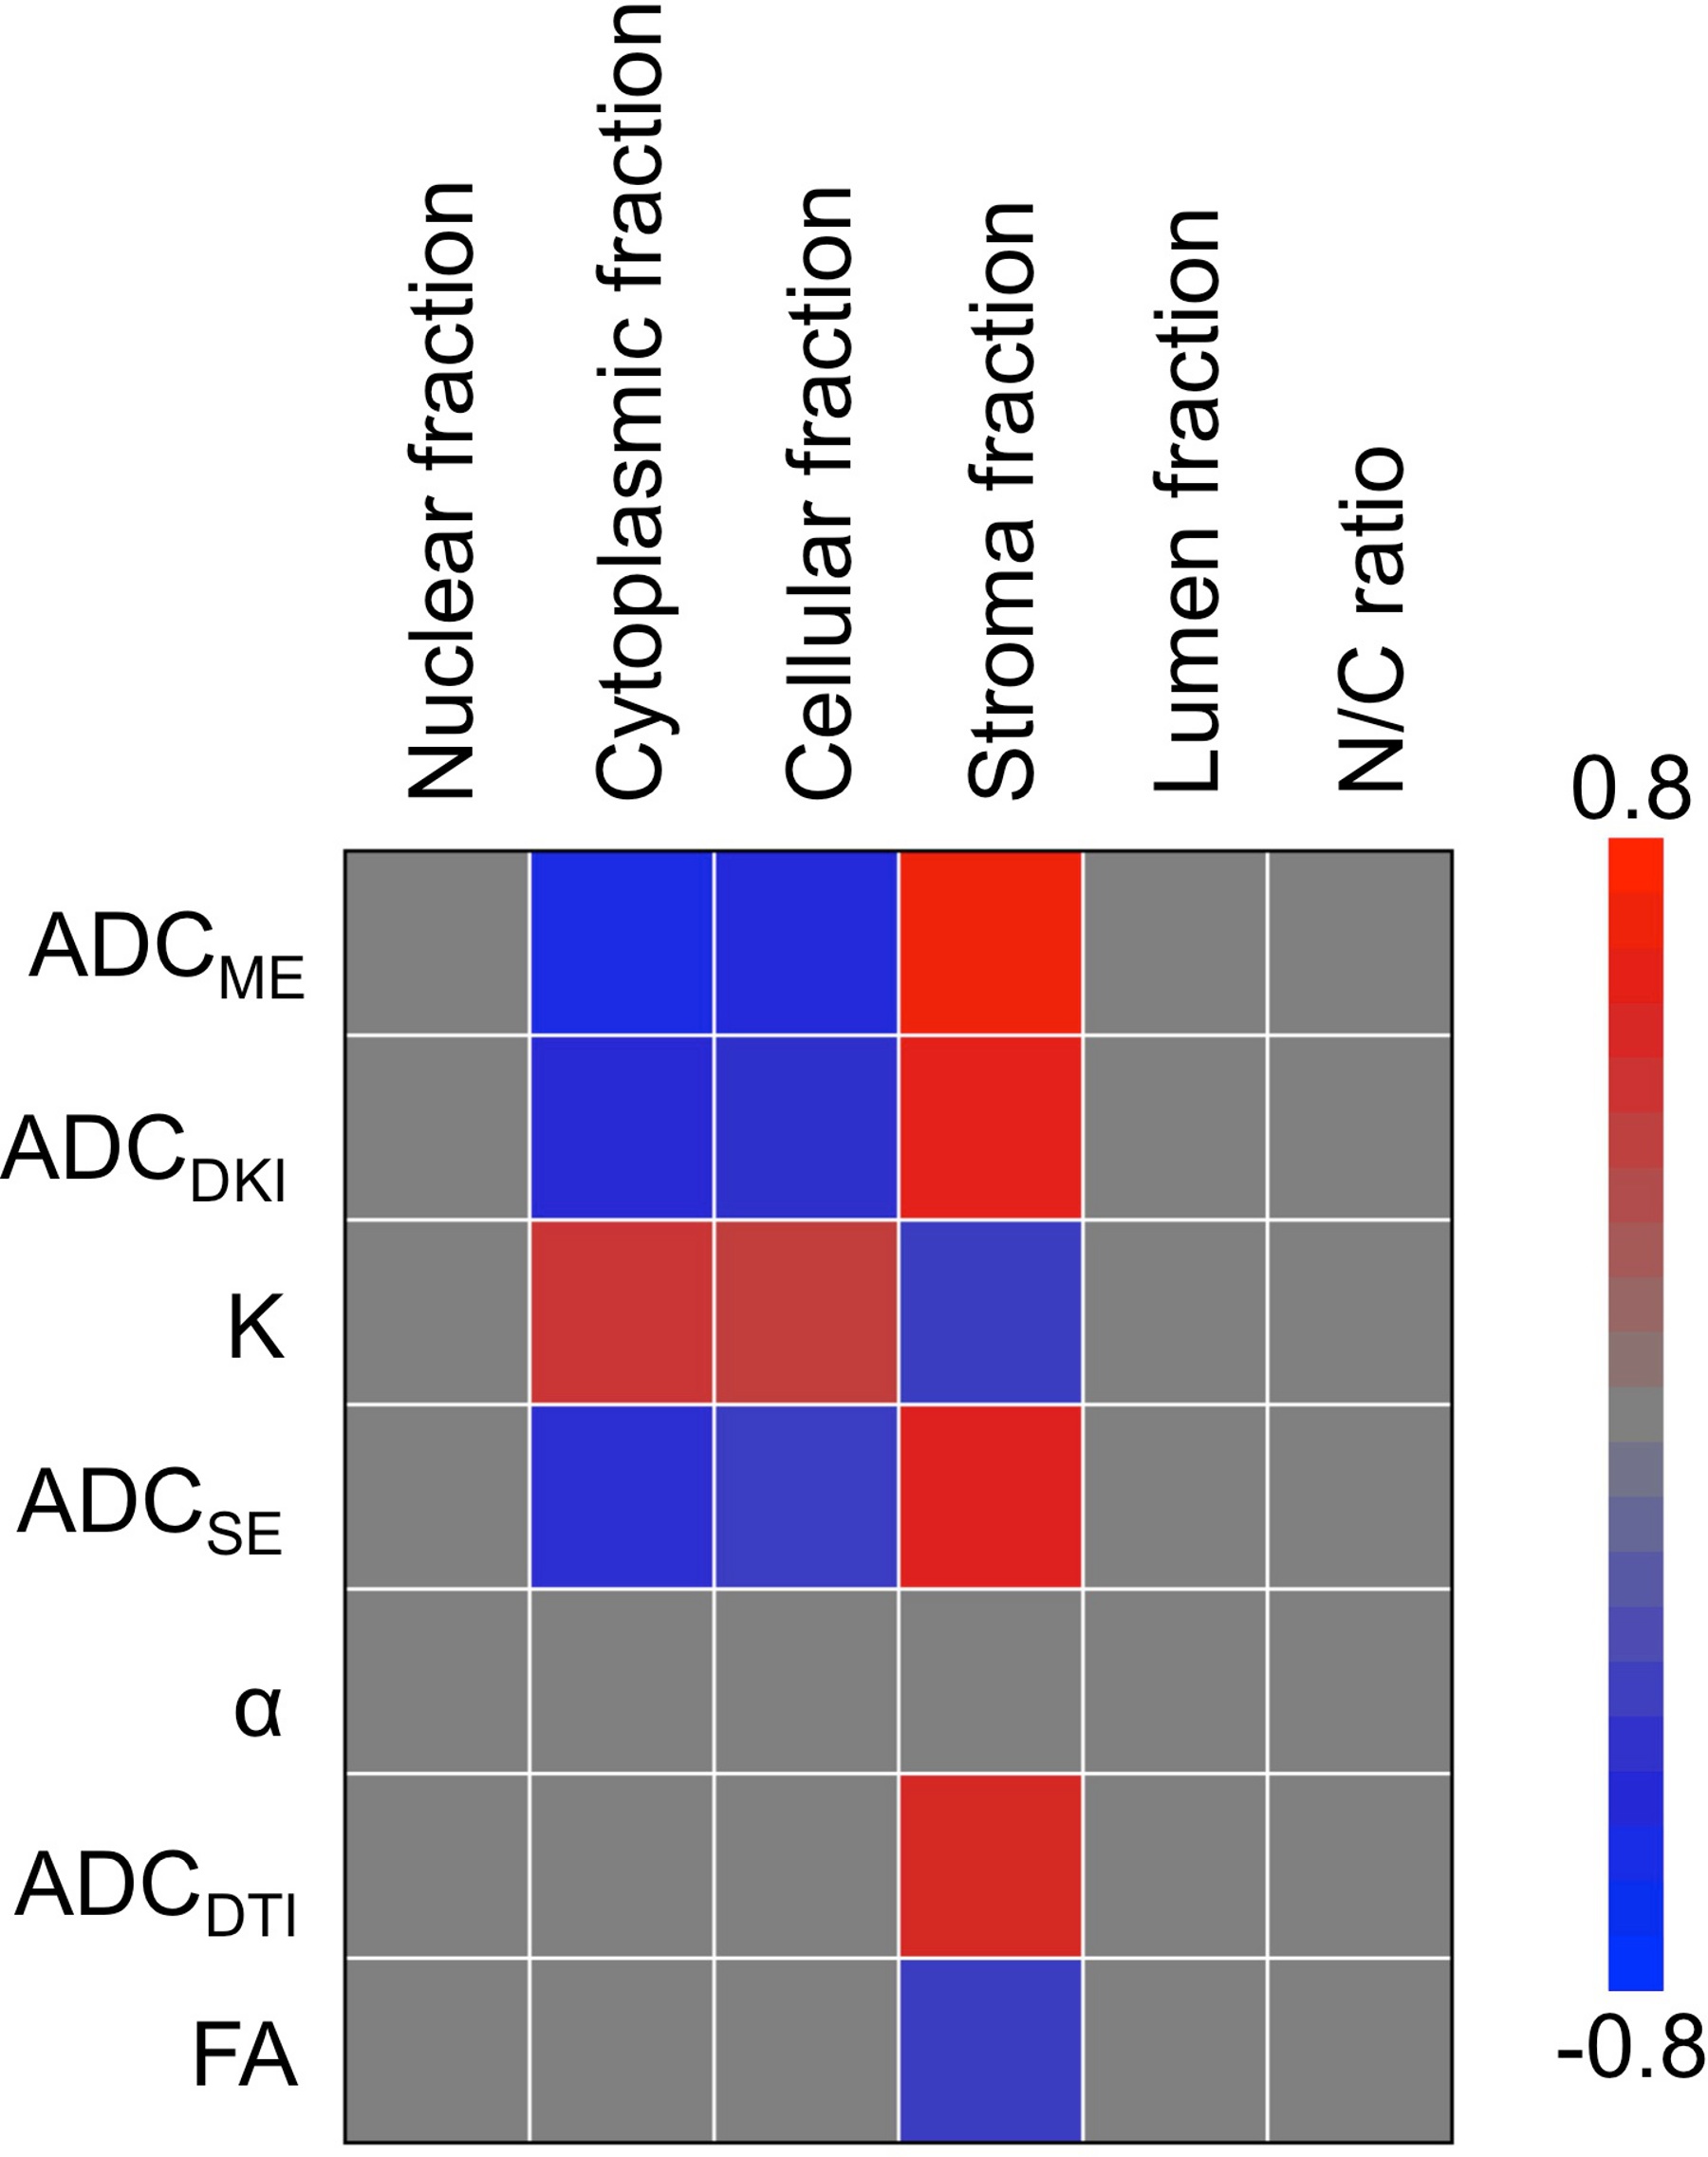
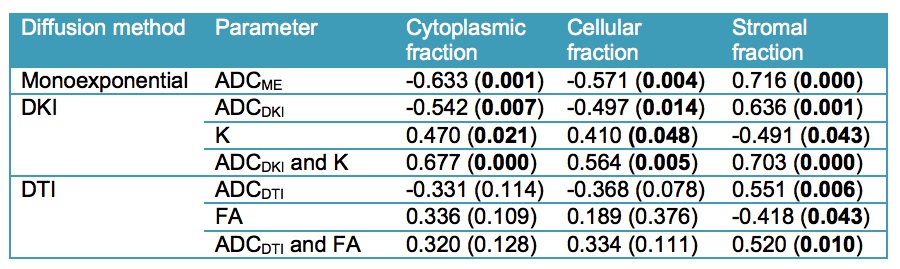
24 lesions were analyzed (1 per patient, mean size 15±6 mm, PZ/TZ 19/5, GS 7/8/9 17/3/4, stage pT2/pT3 19/5). Representative diffusion parameter maps are shown in Figure 2. All DWI parameters were significantly different between PZ and PCa (Table 1). DWI parameters were not significantly different between GS ≤7 and GS>7 (p range 0.280 – 0.949) and between stage pT2 and pT3 (p range 0.155 – 1). The average nuclear, cytoplasmic, stromal, luminal tumor fractions and N/C ratios derived from histology were 0.20±0.07, 0.22±0.06, 0.41±0.09, 0.17±0.07 and 0.99±0.37, respectively. Significant correlations between diffusion parameters and histology are displayed in Figure 3. ADCME, ADCDKI and ADCSE were all significantly negatively correlated with the cytoplasmic and cellular tumor fractions and positively with stromal fractions. K also correlated with the same tissue fractions, but in opposite sign. ADCDTI positively correlated with the stromal fractions, while FA correlated negatively with these fractions. Based on these correlations, it was hypothesized that combined parameters ADCDKI+K and/or ADCDTI+FA may show a stronger correlation with histology compared to individual diffusion parameters. ADCDKI+K indeed showed stronger correlations compared to individual parameters (Table 2) although the correlations were not stronger compared to ADCME. ADCDTI+FA did not show stronger correlation compared to individual parameters (Table 2).Discussion and Conclusions
The observed significant correlations of ADC and K with cellularity in PCa confirm prior reports4,5. In our study, combining all advanced DWI techniques that are currently being extensively assessed in PCa, we observed that none of the advanced techniques improved the correlation with tissue composition compared to conventional ADC. Nevertheless, advanced DWI methods may still have complementary value compared to regular ADC. Based on our results, DKI seems the most promising advanced DWI method for noninvasive assessment of PCa tissue composition, given the multiple correlations with tissue fractions for both ADCDKI and K. The increase in K with cellularity likely reflects increased heterogeneity and irregularity of microcellular structure2, possibly related to tumor aggressiveness5. SE-DWI and DTI seem less promising for PCa characterization, since SE-DWI did not provide complementary correlations with histological tissue composition vs. ADCME and the DTI parameters exhibited fewer correlations with tissue composition vs. ADCME. The exact value of advanced DWI techniques, specifically DKI, for PCa tissue characterization needs to be established in larger studies.Acknowledgements
No acknowledgement found.References
1 Li L, Margolis DJ, Deng M et al. Correlation of Gleason Scores with Magnetic Resonance Diffusion Tensor Imaging in Peripheral Zone Prostate Cancer. J Magn Reson Imaging 2015;42:460–467.
2 Rosenkrantz AB, Padhani AR, Chenevert TL et al. Body Diffusion Kurtosis Imaging: Basic Principles, Applications, and Considerations for Clinical Practice. J Magn Reson Imaging 2015;42(5):1190-202
3 Toivonen J, Merisaari H, Pesola M et al. Mathematical models for diffusion-weighted imaging of prostate cancer using b values up to 2000 s/mm(2) : correlation with Gleason score and repeatability of region of interest analysis. Magn Reson Med. 2015;74(4):1116-24.
4 Langer DL, van der Kwast TH, Evans AJ et al. Prostate tissue composition and MR measurements: investigating the relationships between ADC, T2, Ktrans, ve, and corresponding histologic features. Radiology. 2010;255(2):485-94.
5 Lawrence EM, Warren AY, Priest AN, Barrett T, Goldman DA, Gill AB, Gnanapragasam VJ, Sala E, Gallagher FA. Evaluating Prostate Cancer Using Fractional Tissue Composition of Radical Prostatectomy Specimens and Pre-Operative Diffusional Kurtosis Magnetic Resonance Imaging. PLoS One. 2016;28:11(7):e0159652.
Figures