4776
FOCUS diffusion-weighted imaging for prostate cancer at high b-values: An analysis of image quality, diagnostic accuracy and observer agreement.1Norwich Medical School, University of East Anglia, Norwich, United Kingdom, 2Radiology, Norfolk and Norwich University Hospital
Synopsis
To assess FOCUS diffusion-weighted imaging (DWI) for prostate cancer assessment, 30 consecutive biopsy-proven patients underwent both FOCUS and conventional DWI. Sensitivity and specificity was not significantly different between sequences but inter-observer agreement improved from moderate to substantial when using FOCUS. There was significantly lower SNR and CNR for FOCUS on b-value images, but similar CNR on ADC maps. Mean ADC values were significantly lower using FOCUS and both sequences showed excellent discrimination between malignant and benign prostate with no statistical difference. FOCUS DWI improves agreement between observers of varying experience while maintaining diagnostic accuracy despite lower SNR and CNR.
Purpose
Reducing the field-of-view (FOV) for diffusion-weighted imaging (DWI) has been shown to improve spatial resolution and reduce motion artefacts (1, 2). The novel field-of-view optimised and constrained undistorted single shot (FOCUS) sequence uses a smaller FOV and has been shown to improve image quality and reduce distortion (2). The need to assess the ability of reduced FOV DWI at higher b-values to separate malignant and benign tissue has been identified (2). This study compares the clinical utility of FOCUS diffusion-weighted imaging with conventional single-shot spin echo echo-planar imaging (ss-EPI) in prostate cancer assessment by investigating diagnostic accuracy, inter-observer agreement, signal and contrast-to-noise ratios and ability of apparent diffusion coefficient (ADC) maps to characterise malignant tissue.Methods
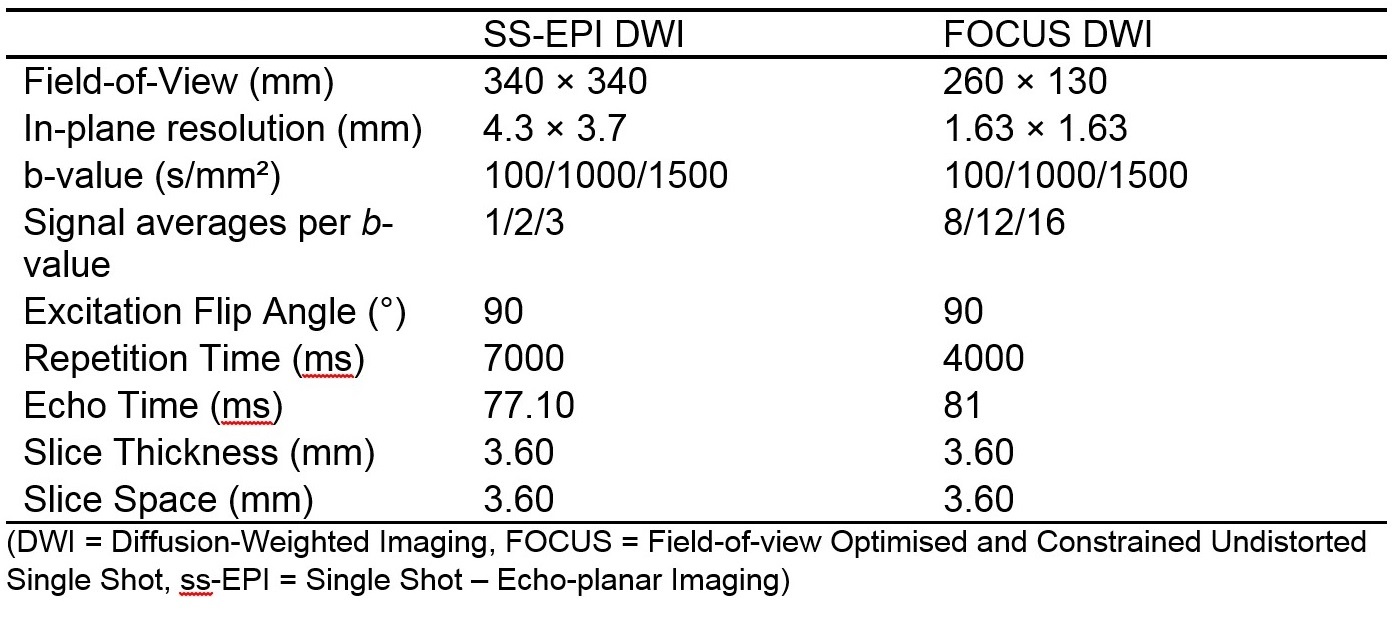
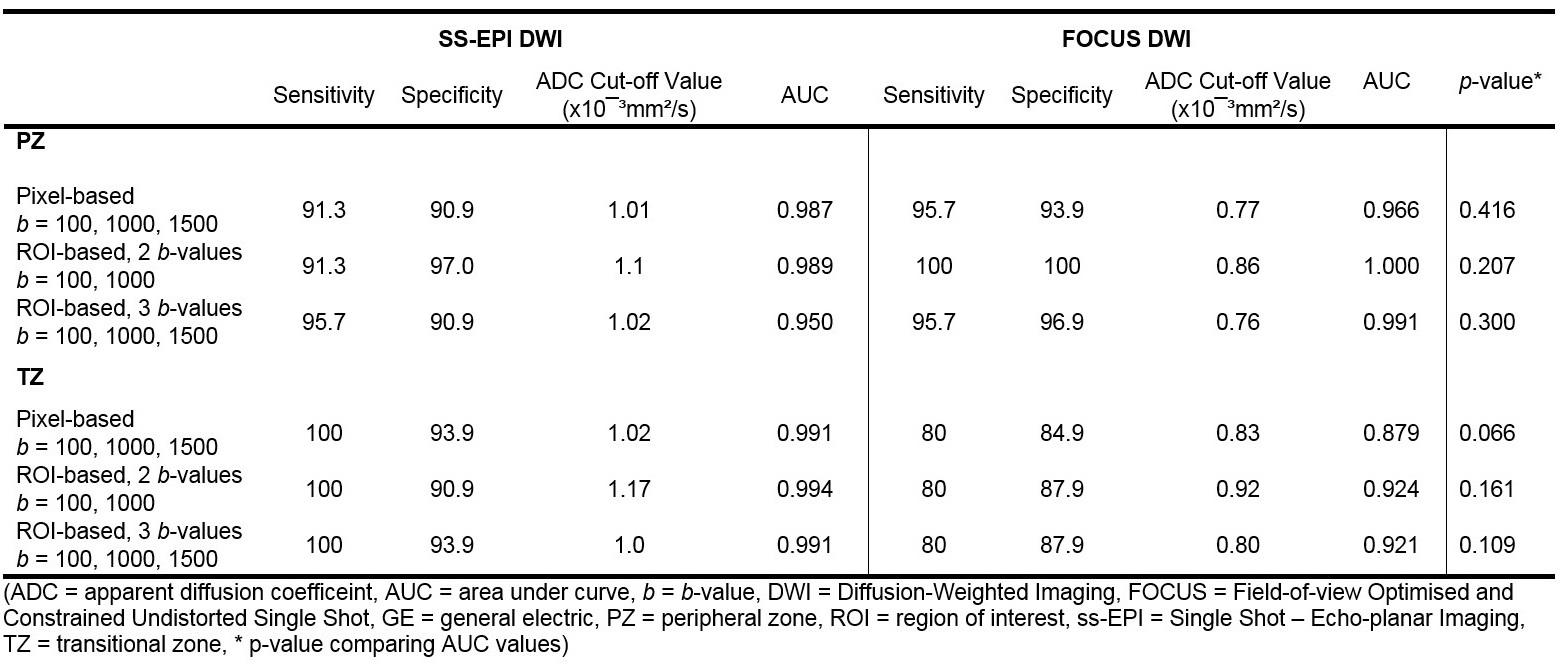
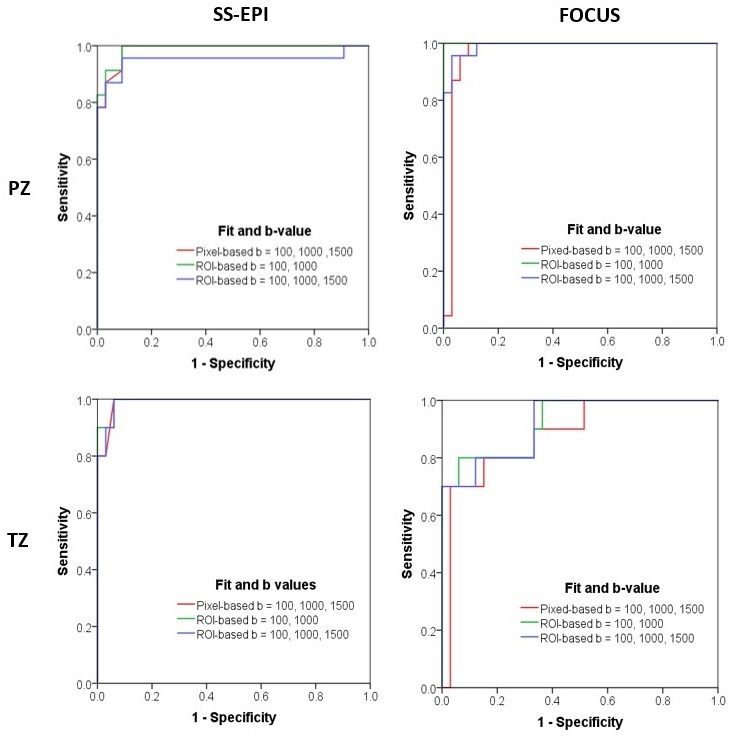
A total of 30 biopsy-proven prostate cancer patients underwent both FOCUS and conventional DWI at 3 Tesla with b-values = 100, 1,000 and 1,500 s/mm² and a pixel-by-pixel based ADC map generated from all 3 b-values. The acquisition details for both DWI sequences are summarised in table 1. Sensitivity, specificity, and inter-observer agreement were calculated by kappa statistics for visual assessment by two independent readers against trans-rectal ultrasound guided biopsy (TRUS) histology findings. Elliptical regions of interest (ROI) were drawn to calculate signal-to-noise ratios (SNRs), contrast-to-noise ratios (CNRs), and mean ADC values, which were compared between DWI sequences using two-way repeated measures analysis of variance (ANOVA) or paired t-tests. Two further region-of-interest (ROI) based ADC fits were applied (b-values = 100, 1,000 and 1,500 s/mm² and b-values = 100 and 1,000 s/mm²), and receiver operating characteristic (ROC) curves were constructed to determine the discriminatory ability of ADC values between malignant and benign prostatic tissue and compared using the nonparametric approach described by De-Long. (3)Results
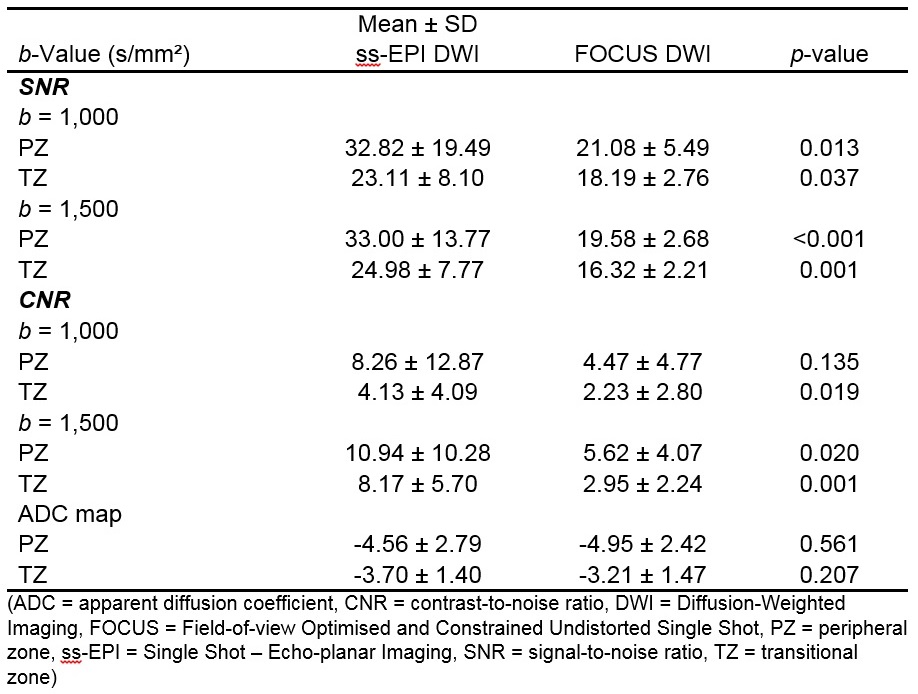
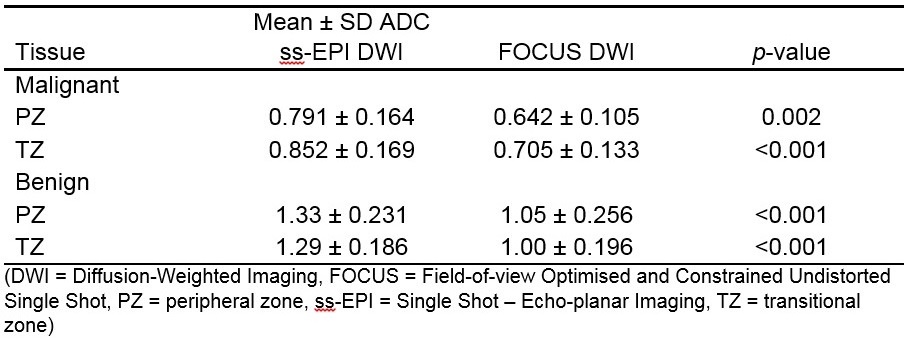
A total of 33 index lesions were identified on imaging; PZ = 23 (69.7%), TZ = 10 (30.3%). Sensitivity and specificity did not differ between DWI sequences (p = 0.125 – 1.000), but inter-observer agreement improved from moderate (0.568 (95%CI 0.397-0.739)) in conventional DWI to substantial (0.711 (95%CI 0.567-0.853)) in FOCUS DWI. There were significantly lower SNRs and CNRs for the FOCUS diffusion-weighted images but similar CNR on ADC maps (table 2). ADC showed excellent discrimination between malignant and benign tumours with no statistically significant difference between sequences or ADC fitting methods (table 3, figure 1). However, ADC values for both tumour lesions and benign tissue were significantly lower with FOCUS (table 4).Discussion
Consistent with other reduced FOV DWI studies (4), the reduced SNR can be explained by the smaller voxel size and signal loss from both the long two-dimensional radiofrequency pulse and saturation effects from the shorter repetition time. Despite the reduced SNR and CNR in FOCUS DWI images, the diagnostic accuracy was maintained which may be due to the similar contrast on ADC maps. The mean ADCs for conventional ss-EPI correspond well with previous literature. However, our values for FOCUS ADC maps were lower than Feng et al, who reported a mean tumour ADC value of 0.974x10-³mm²/s (2, 5, 6). This change in absolute value is likely because we used a much higher maximum b-value of 1,500 s/mm², which is more influenced by noise. (7-9). We also observed a significant decrease in ADC value for both benign and malignant tissue with FOCUS DWI compared to conventional ss-EPI, mirroring other reduced FOV studies in the prostate and breast (4, 10). However, Feng et al found a slight increase in ADC using FOCUS against conventional ss-EPI (2). It is thought that the increased spatial resolution of reduced FOV DWI would lead to lower ADC values, as partial volume effects are reduced; but the reduced SNR of FOCUS in our study may be the cause of the significant drop in ADC values compared to previous literature (11). Our ROC analysis shows that mean ADC is a useful reference for distinguishing index lesions. Recognition that there may be lower ADC cut-off values using FOCUS and other reduced FOV sequences is important if these are to inform diagnosis.Conclusion
FOCUS DWI at high b-value is a clinically viable sequence that merits further investigation against radical prostatectomy histopathology samples. It allows for improved inter-observer agreement between radiologists of varying experience, maintaining diagnostic accuracy despite a significant reduction in SNR and CNR of the diffusion-weighted images.Acknowledgements
No acknowledgement found.References
1. Korn N, Kurhanewicz J, Banerjee S, Starobinets O, Saritas E, Noworolski S. Reduced-FOV excitation decreases susceptibility artifact in diffusion-weighted MRI with endorectal coil for prostate cancer detection. Magnetic Resonance Imaging. 2015;33(1):56-62.
2. Feng Z, Min X, Sah VK, Li L, Cai J, Deng M, et al. Comparison of field-of-view (FOV) optimized and constrained undistorted single shot (FOCUS) with conventional DWI for the evaluation of prostate cancer. Clinical Imaging. 2015;39(5):851-5.
3. DeLong ER, DeLong DM, Clarke-Pearson DL. Comparing the areas under two or more correlated receiver operating characteristic curves: a nonparametric approach. Biometrics. 1988;44(3):837-45.
4. Rosenkrantz A, Chandarana H, Pfeuffer J, Triolo M, Shaikh M, Mossa D, et al. Zoomed echo-planar imaging using parallel transmission: impact on image quality of diffusion-weighted imaging of the prostate at 3T. Abdom Imaging. 2015;40(1):120-6.
5. Koo IH, Kim CK, Choi D, Park BK, Kwon GY, Kim B. Diffusion-Weighted Magnetic Resonance Imaging for the Evaluation of Prostate Cancer: Optimal B Value at 3T. Korean Journal of Radiology. 2013;14(1):61-9.
6. Tamada T, Sone T, Jo Y, Yamamoto A, Ito K. Diffusion-weighted MRI and its role in prostate cancer. NMR in Biomedicine. 2014;27(1):25-38.
7. Metens T, Miranda D, Absil J, Matos C. What is the optimal b value in diffusion-weighted MR imaging to depict prostate cancer at 3T? Eur Radiol. 2012;22(3):703-9.
8. Wang X, Qian Y, Liu B, Cao L, Fan Y, Zhang JJ, et al. High-b-value diffusion-weighted MRI for the detection of prostate cancer at 3 T. Clinical Radiology. 2014;69(11):1165-70.
9. Peng Y, Jiang Y, Antic T, Sethi I, Schmid-Tannwald C, Eggener S, et al. Apparent diffusion coefficient for prostate cancer imaging: Impact of b values. American Journal of Roentgenology. 2014;202(3):W247-W53.
10. Dong H, Li Y, Li H, Wang B, Hu B. Study of the Reduced Field-of-View Diffusion-Weighted Imaging of the Breast. Clinical Breast Cancer. 2014;14(4):265-71.
11. Saritas EU, Lee JH, Nishimura DG. SNR Dependence of Optimal Parameters for Apparent Diffusion Coefficient Measurements. IEEE Transactions on Medical Imaging. 2011;30(2):424-37.
Figures