4773
4D Flow MRI based aortic wall shear stress analysis using two different software tools and datasets from MRI scanners of two different appliance brands1Clinic for Radiology and Nuclear Medicine, University Hospital Schleswig-Holstein, Lübeck, Germany
Synopsis
Wall shear stress (WSS) is an increasingly used vessel wall parameter derived from 4D Flow-MRI data. There is no reference standard for evaluating WSS and different software approaches are available. However, their comparability is not known. Hence, it was the aim of this study to compare two available software tools (GTFlow and FlowTool). To achieve this goal, data from 21 healthy volunteers scanned on MRI scanners of different vendors were analyzed with respect to average and segmental WSS. Results showed good agreement between tools.
Target audience
MR Physicists; Physicians: Radiologists, Cardiologists, Cardiac and Vascular Surgeons; Biomedical EngineersPurpose
Wall
shear stress (WSS), the tangential force along the vessel wall, is a
hemodynamic parameter based on 4D Flow-MRI increasingly used in hemodynamic
analyses. It has been linked with promoting vessel wall changes such as
remodeling in atherosclerosis(1) and as a clinical predictor for the development
of aortic aneurysms(2) to name but a few. There are a couple of software tools to derive WSS
from the acquired 4D Flow-MRI vector field; however, there is no reference
standard to evaluate WSS. Similarly, the WSS-calculation based on numerical
simulation and computational fluid design (CFD) relies on assumptions and are
not suitable for clinical implementation in vessel diagnostics. The aim of this
study was to compare two different software tools (GTFlow and FlowTool) previously
used for the analysis of aortic WSS using data from MRI scanners of two vendors.Methods
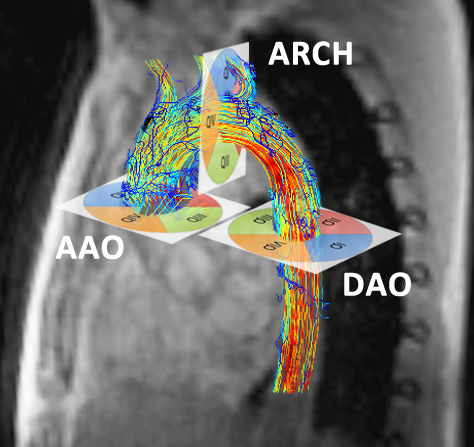
MRI scans: 22 volunteers (8f) were included after IRB approval and written informed consent. 15 volunteers were scanned on a 3T MRI Philips Achieva (“VolP”, 6f) and seven on a 3T MRI Siemens Trio (“VolS”, 2f). On both scanners, a 4D Flow-MRI sequence with adaptive respiratory gating and similar imaging parameters were used. Spatial resolution for both scanners 2.5 mm in all spatial directions, acquisition matrix (Philips 128 x 128, Siemens 96 x 128) Data were reconstructed to 16-25 time frames. Depending on the heart rate an effective temporal resolution of (Philips: 34-61ms, Siemens 38-40ms) was achieved. Scan setup difference were ECG-gating (Philips: retrospective, Siemens: prospective), image acceleration Data processing: Data of one volunteer was rejected because of incorrect ECG-triggering. WSS analysis was performed using GTFlow (Gyro Tools V. 2.0.2) and the MatLab-based FlowTool (V.2.0c)(3). 3 analysis planes were positioned orthogonal to aorta in the ascending and descending aorta and the aortic arch (Fig. 1) using GTFlow. Resulting cutplanes were exported into FlowTool such that exactly matching data were compared. 4 segments per plane (quadrants QI-QIV) were evaluated. WSS estimates were calculated as: WSS spatially averaged over all segments per plane (AAO, ARCH DAO) and time-points and WSS temporally averaged over each quadrant per plane (QI-QIV). All data are given as mean ± standard deviation in [N/m2]. Statistical analysis included testing for normality of distribution (Kolmogorov-Smirnov and Shapiro-Wilk), due to rejection of normal distribution the Wilcoxon test (p<0.05 indicating statistical significance), and Spearman rho rank correlation. In cases of Wilcoxon indicating significant differences despite medium to high correlation using Spearman (R ≥ 0,7), a linear regression was performed. An adjusted correlation (aR2) ≥ 0,8 indicated a correlation between both variables. For verification of comparable segmentations, the estimated radius of each plane was calculated from the segmented vessel area. 6 randomly chosen datasets were used to analyze intra- und interobserver variability.Results
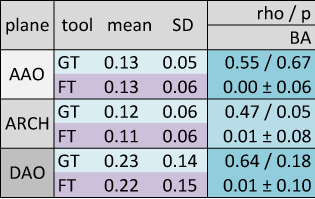
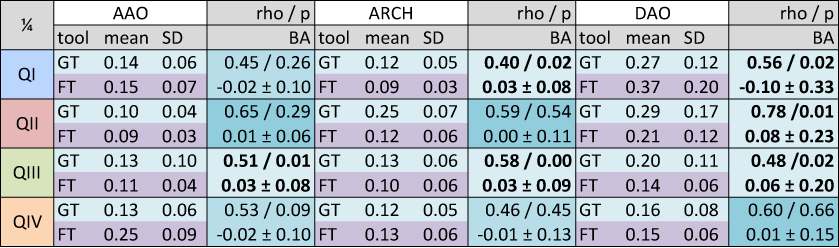
Results: WSS results of both analysis tools per analysis plane are given in Tab 1, segmental data in Tab. 2. Overall, matching results for spatially averaged WSS per plane were detected, differences revealed no statistical difference. In the per-segment analysis matching results for spatially averaged WSS per quadrant were detected in 6 of 12 verified quadrants with increasing amount of statistical significant difference from AAO to DAO (AAO 1, ARCH 2, DAO 3 quadrants), marked bold type. The MRI scanner appliance brand orientated analyses present less statistical differences for datasets acquired on Philips Achieva in the per-plane analysis (Philips 0/3, Siemens 2/3) and same amount of statistical differences in the per-segment analysis (3/12). Estimating the WSS in Philips datasets both software tools present a medium to high correlation in 9 of 12 verified quadrants, in Siemens datasets 5 of 12. In the Bland Altman comparison a good intra- und interobserver variability was obtained for the WSS analysis with GTFlow (run1 0.14±0.11, run2 0.16±0.13, BA -0.018±0.048 / observer1 0.14±0.11, observer2 0.14±0.11, BA 0.013±0.055). The radius [mm] derived from the segmented vessel area shows in all planes statistical significant differences which are below the acquired spatial resolution and can thus be neglected (GT 12.16±2.0, FT 13.07±2.06, BA 0.91±1.79).Discussion and conclusion
This is the first work to systematically compare WSS derived from different software tools to visualize and quantify 4D Flow-MRI data from different vendors. Both software tools show matching results with minor differences in datasets acquired on Philips MRI. Results are promising regarding the comparability of WSS between studies acknowledging that scanning parameters and especially the spatial resolution and signal-to-noise ratio must be comparable.Acknowledgements
The authors thank Gerard Crelier (Gyro Tools) and Aurelien Stalder (Flow Tool) for their technological assistances.References
1) Malek AM, Alper SL, Izumo S. Hemodynamic shear stress and its role in atherosclerosis. JAMA. 1999 Dec 1;282(21):2035–42.
2) Fillinger MF, Raghavan ML, Marra SP, Cronenwett JL, Kennedy FE. In vivo analysis of mechanical wall stress and abdominal aortic aneurysm rupture risk. J Vasc Surg. 2002nd ed. 2002 Sep;36(3):589–97.
3) Stalder AF, Russe MF, Frydrychowicz AP, Bock J, Hennig J, Markl M. Quantitative 2D and 3D phase contrast MRI: optimized analysis of blood flow and vessel wall parameters. Magn Reson Med. 2008 ed. 2008 Nov;60(5):1218–31.
Figures