4771
The Myocardial Feature Tracking of LA, LV and RV: Age-related in Normal Chinese1Department of Radiology, Shenzhen Longgang District Center Hospital, Shenzhen, People's Republic of China, 2Department of Radiology, 3Department of Radiology, Beijing Anzhen Hospital,Capital Medical University, 4National Heart Centre Singapore
Synopsis
To quantify the age-related global cardiac deformation, GLS and GCS derived from feature-tracking cardiovascular magnetic resonance were measured using post-processing software in 81 healthy Chinese volunteers. It was found that age significantly influenced GLS of LV and LA. This is an important indicator for further research of quantitation MR Myocardial Feature Tracking.
BACKGROUND
MR myocardial feature tracking allows quantitative evaluation of global and regional myocardial motion and contractility with great accuracy and reproducibility1, 2. Comprehensive age- and sex- corrected CMR reference ranges for strain and strain rate have been established in western3, 4, but age-related quantitation in Chinese was unreported.PURPOSE
The specific aim of the current study was to evaluate the age-related global peak systolic values for longitudinal and circumferential strain of left, right ventricular (LV, RV) and left atrial (LA).METHODS
All 81 healthy volunteers (38 male and 43 Female, age from 18 to 70, mean 42.7±12.07) strictly selected from December 2014 to October 2016 were retrospective analyzed. MR scan was performed in MAGNETON Verio 3T MR scanner (Siemens, Erlangen, Germany). Cardiovascular magnetic resonance feature tracking imaging (CMR-FTI) was applied to standard 2-, 3- and 4-chamber as well as short axis views of CMR cine images acquired by prospective ECG-gated bSSFP sequences (FOV 286×340mm2, matrix 216×256, TR/TE 3.4/1.7ms,voxel size 1.7×1.3××6.0mm3). All global strain index, including longitudinal and circumferential myocardial strain of LV and LA (LV myoGLS, myoGCS, LA endoGLS, endoGCS), longitudinal endocardium of RV strain (RV endoCLS), were measured by offline Medis cardiovascular post-processing software. Pearson’s correlation test was employed to evaluate correlations. Statistical analysis was conducted using IBM SPSS Statistics version 20 for Windows.RESULTS
The values for LV myoGLS, myoGCS, LA endoGLS, endoGCS, RV endoGCS were -21.67±2.64%, -24.88±3.09%, 35.91±7.74%, 44.26±14.52 and -30.76±5.33%. The LV myoGLS and LA endoGLS decreased significantly with age (P=0.04, P=0.05) resulting in less negative values, whereas LA endoGCS just slightly decreased. For LV and LA, Both GLS and GCS were positively correlated to their ejection fractions(P<0.05), and RV endoGLS was also positively correlated to its fraction area change (FAC). Compared to males, females had larger LV myoGLS and LA endoGLS, but the discrepancy did not reach significance (P>0.05).DISCUSSION
Interestingly, the outcomes of this study demonstrated that the effect of age on longitudinal was greater than the circumferential strain, which was different from the previous reports. In a study of 100 healthy volunteers divided into 10 classes of age from 20 to 70 years, Robin J et al5 found a linear increase in the magnitude of GCS with subjects over the age of 50 years, but no association between age and GLS and radial strain (GRS). Florian Andre et al4 found in a study of 150 healthy subjects that only the GRS and the strain rates featured a significant age-dependency. It seems the difference between this study and the previous ones can be mainly attribute to the insufficient sample size and heterogeneous population. Meanwhile, by the way, for the gender difference in our study showed only a tendency whereas in previous reported study it reached significance4, 5. In order to reach an accurate conclusion, we need a further multicenter research with larger sample size and appropriate age groups.CONCLUSIONS
It demonstrated that the age is closely related with the strain indexes in LA, LV and RV. Furthermore, it had potential value for the further research studies and clinical practice.Acknowledgements
No acknowledgement found.References
1. Kowallick JT, Morton G, Lamata P, et al. Inter-study reproducibility of left ventricular torsion and torsion rate quantification using MR myocardial feature tracking. J Magn Reson Imaging. 2016-01-01 2016;43(1):128-137.
2. Kowallick JT, Lotz J, Hasenfuss G, Schuster A. Left atrial physiology and pathophysiology: Role of deformation imaging. World J Cardiol. 2015-06-26 2015;7(6):299-305.
3. Maceira AM, Cosin-Sales J, Prasad SK, Pennell DJ. Characterization of left and right atrial function in healthy volunteers by cardiovascular magnetic resonance. J Cardiovasc Magn Reson. 2016-10-10 2016;18(1):64.
4. Andre F, Steen H, Matheis P, et al. Age- and gender-related normal left ventricular deformation assessed by cardiovascular magnetic resonance feature tracking. J Cardiovasc Magn Reson. 2015-01-20 2015;17:25.
5. Taylor RJ, Moody WE, Umar F, et al. Myocardial strain measurement with feature-tracking cardiovascular magnetic resonance: normal values. Eur Heart J Cardiovasc Imaging. 2015-08-01 2015;16(8):871-881.
Figures
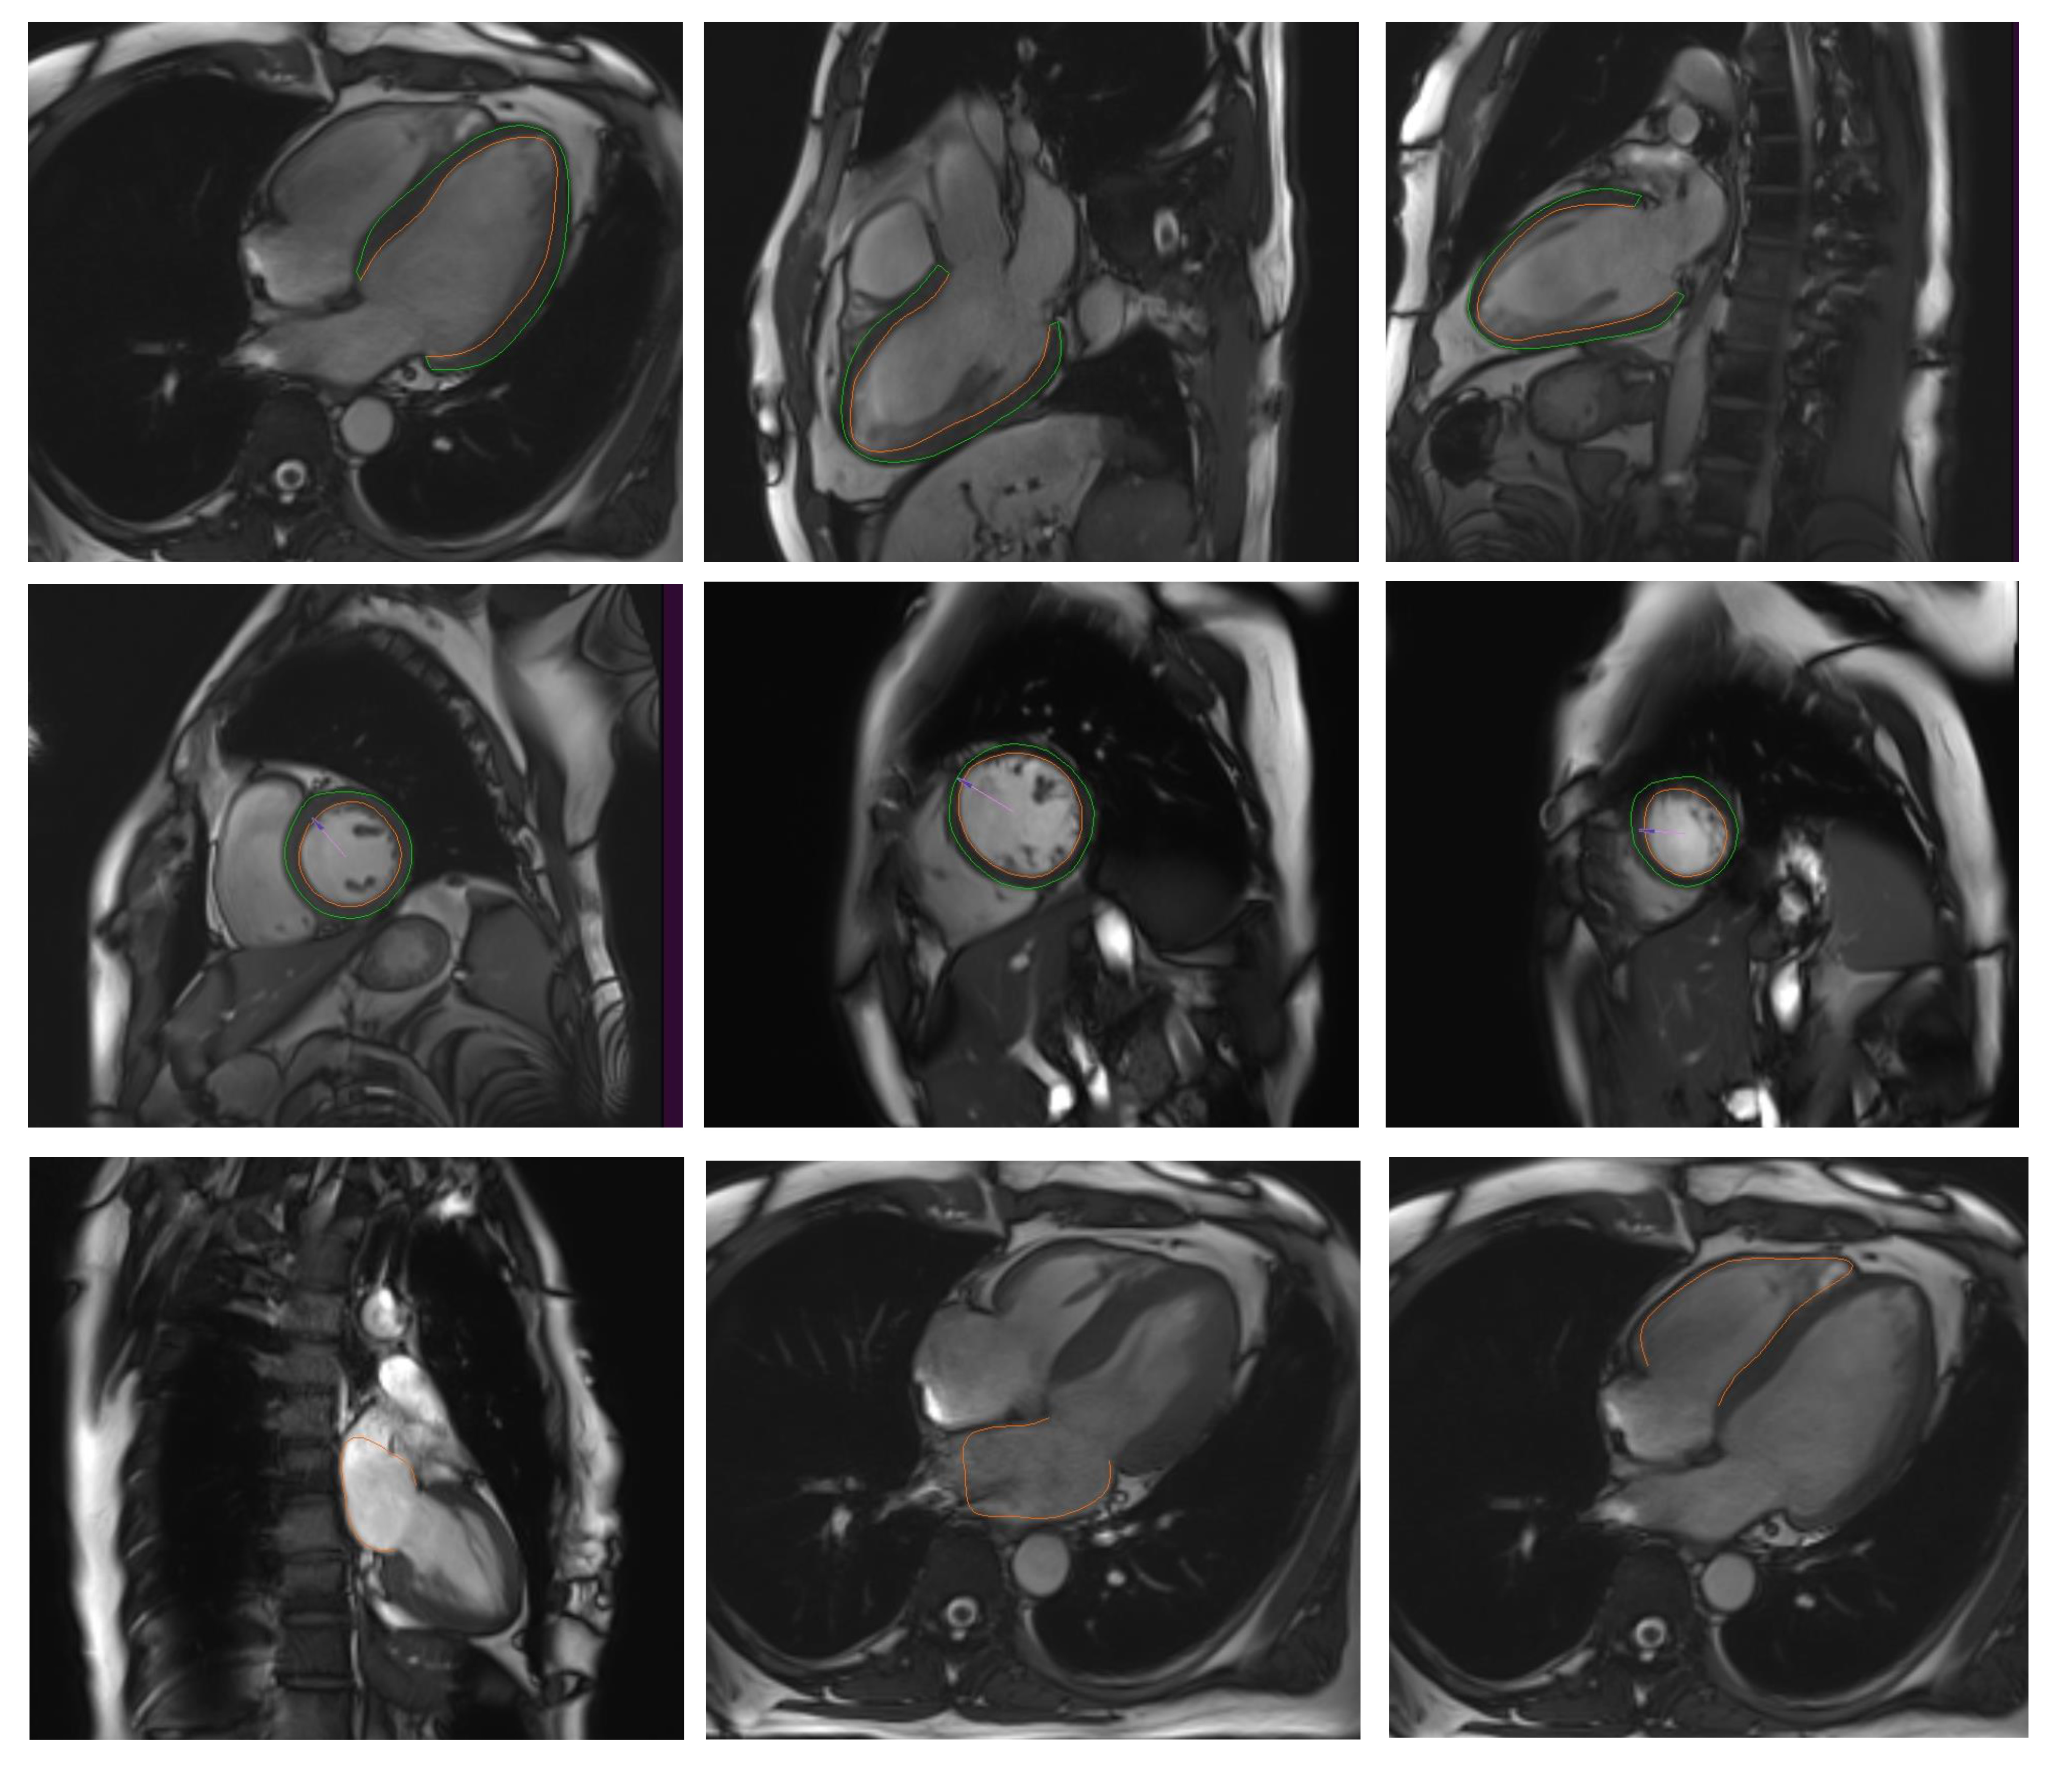
Fig1 Borders tracing in post-processing
The LV endocardial and epicardial borders were halt-auto traced in the 2-,3- and 4-chamber as well as short axis views. Identical short axis sections were analyzed at basal, mid-ventricular, and apical level. LA endocardial borders were traced in the 2- and 4-chamber views, RV in the 4-chamber views.
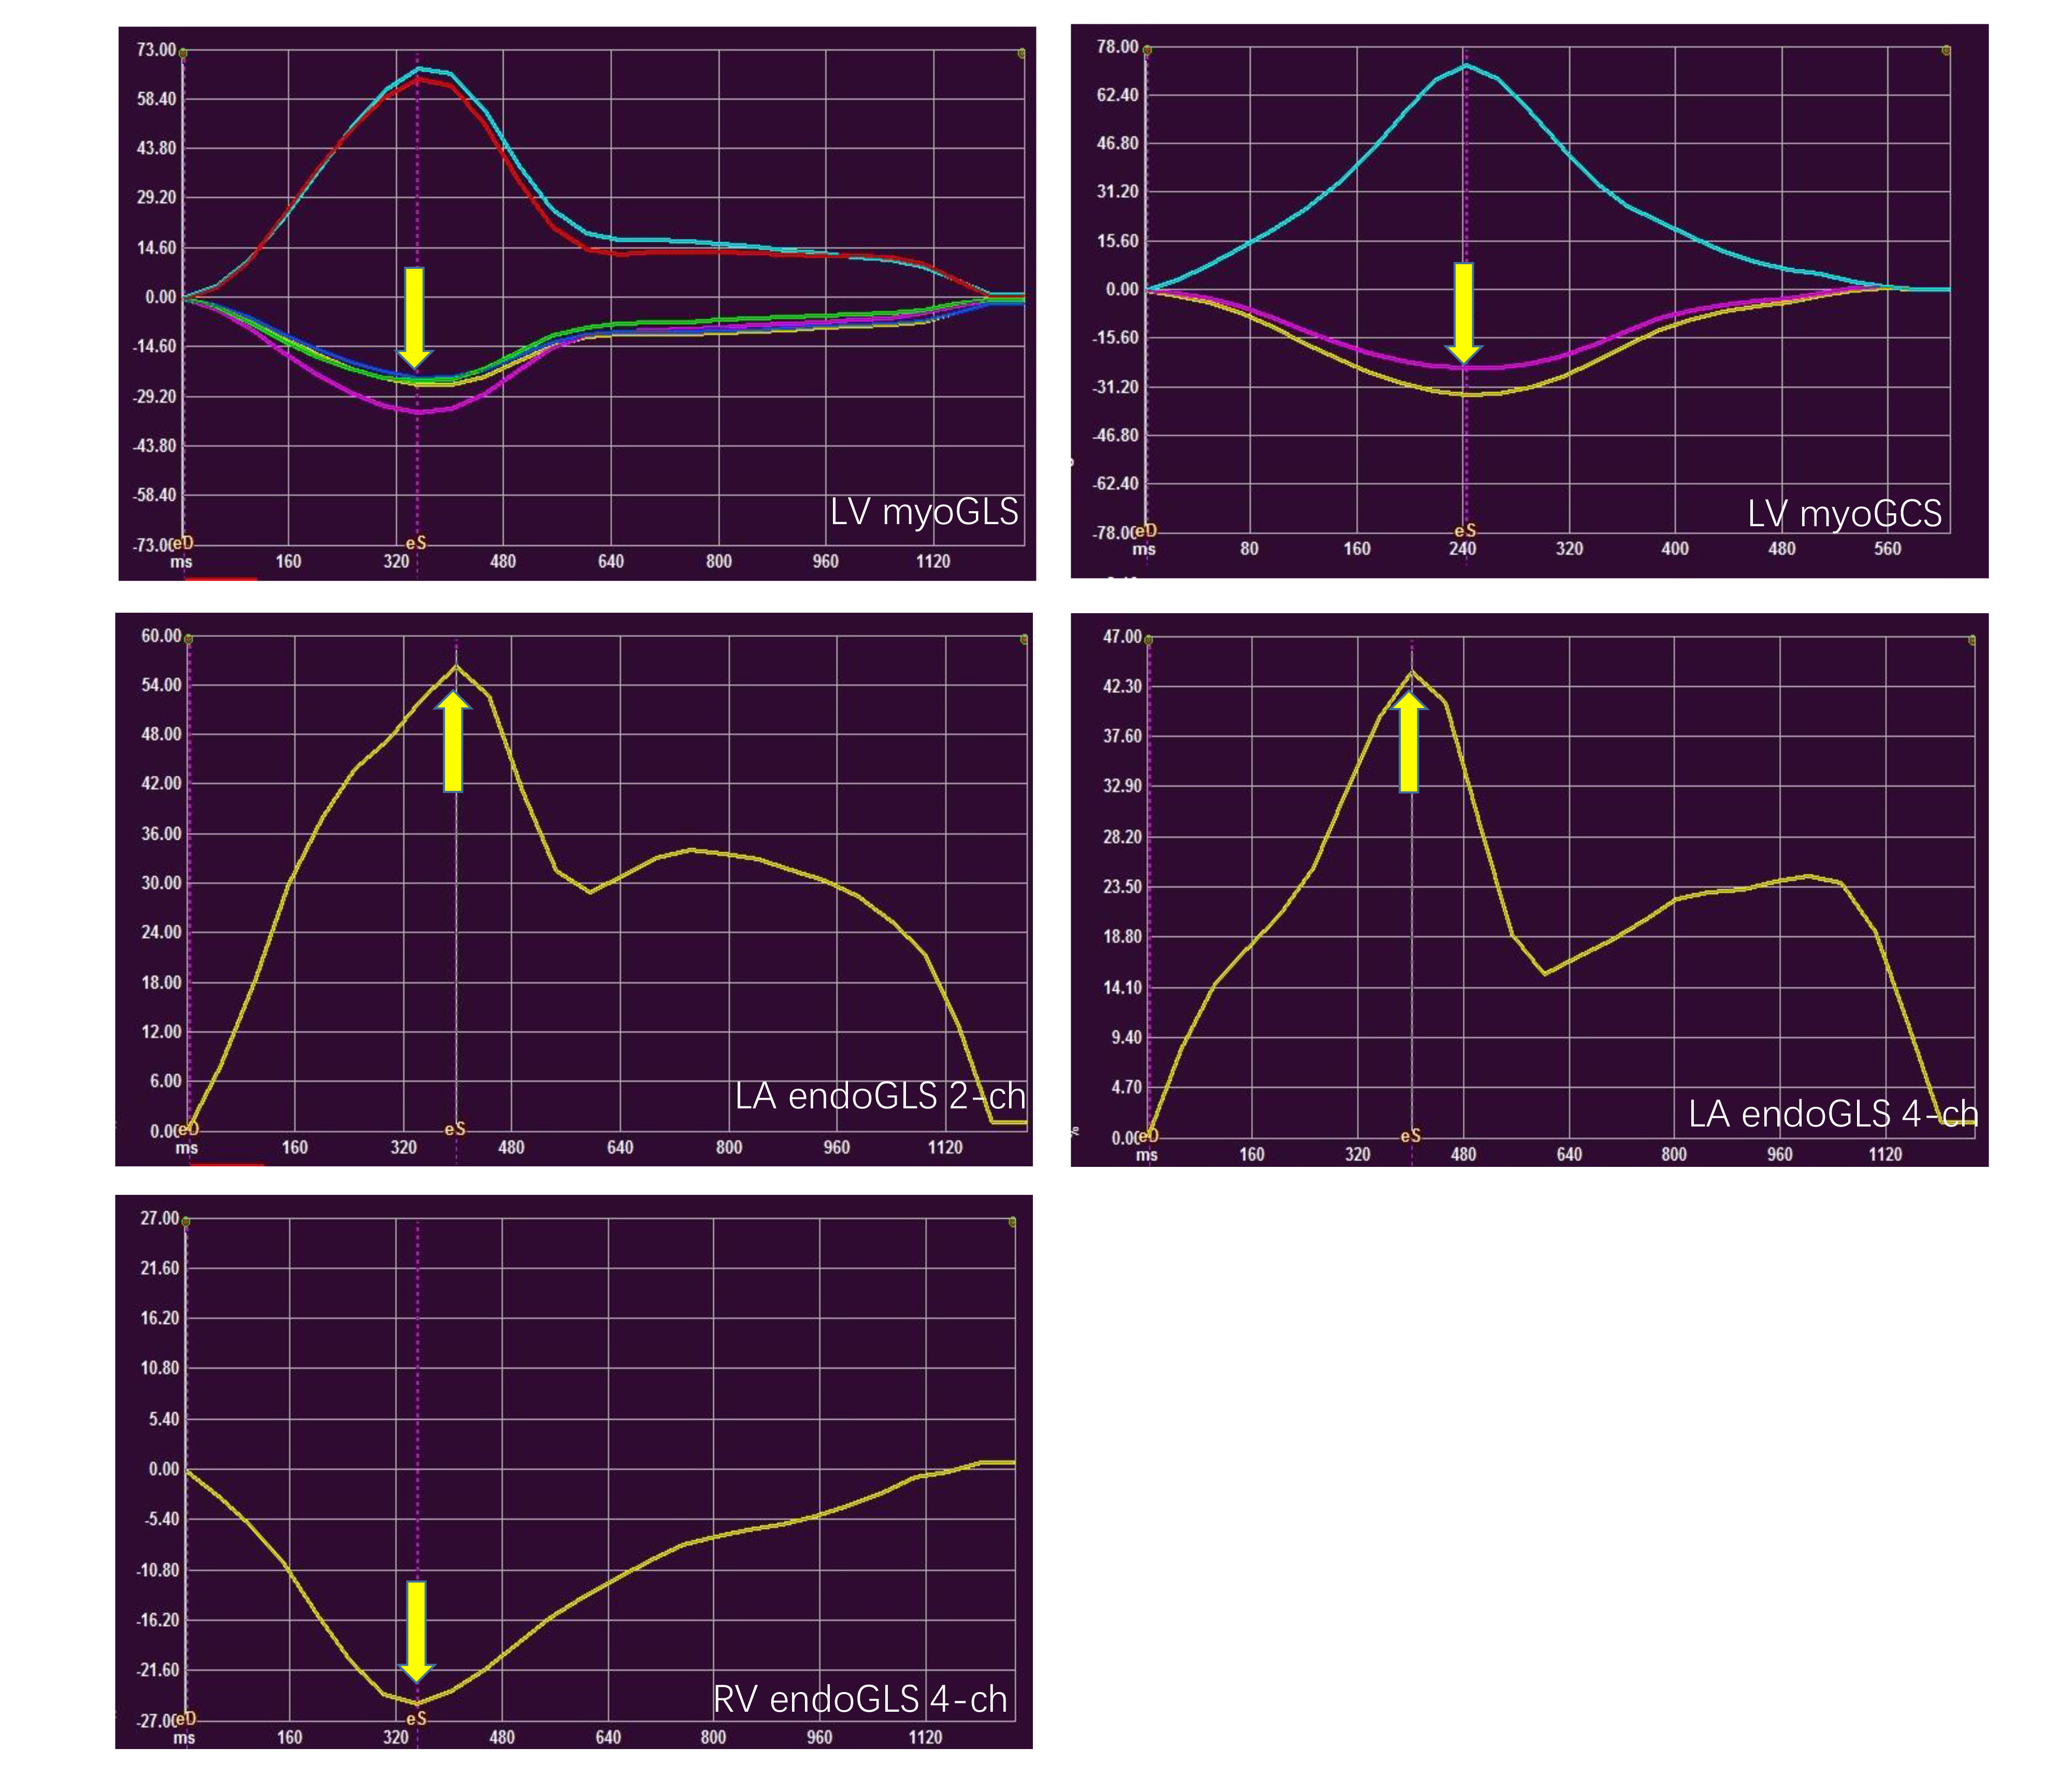
Fig 2 feature-tracking curves in LA, LV and RV.
Representative curves showing the LV myoGLS and myoGCS, LA endoGLS, and RV endoGLS. The global peak systolic values are indicated by yellow arrows.
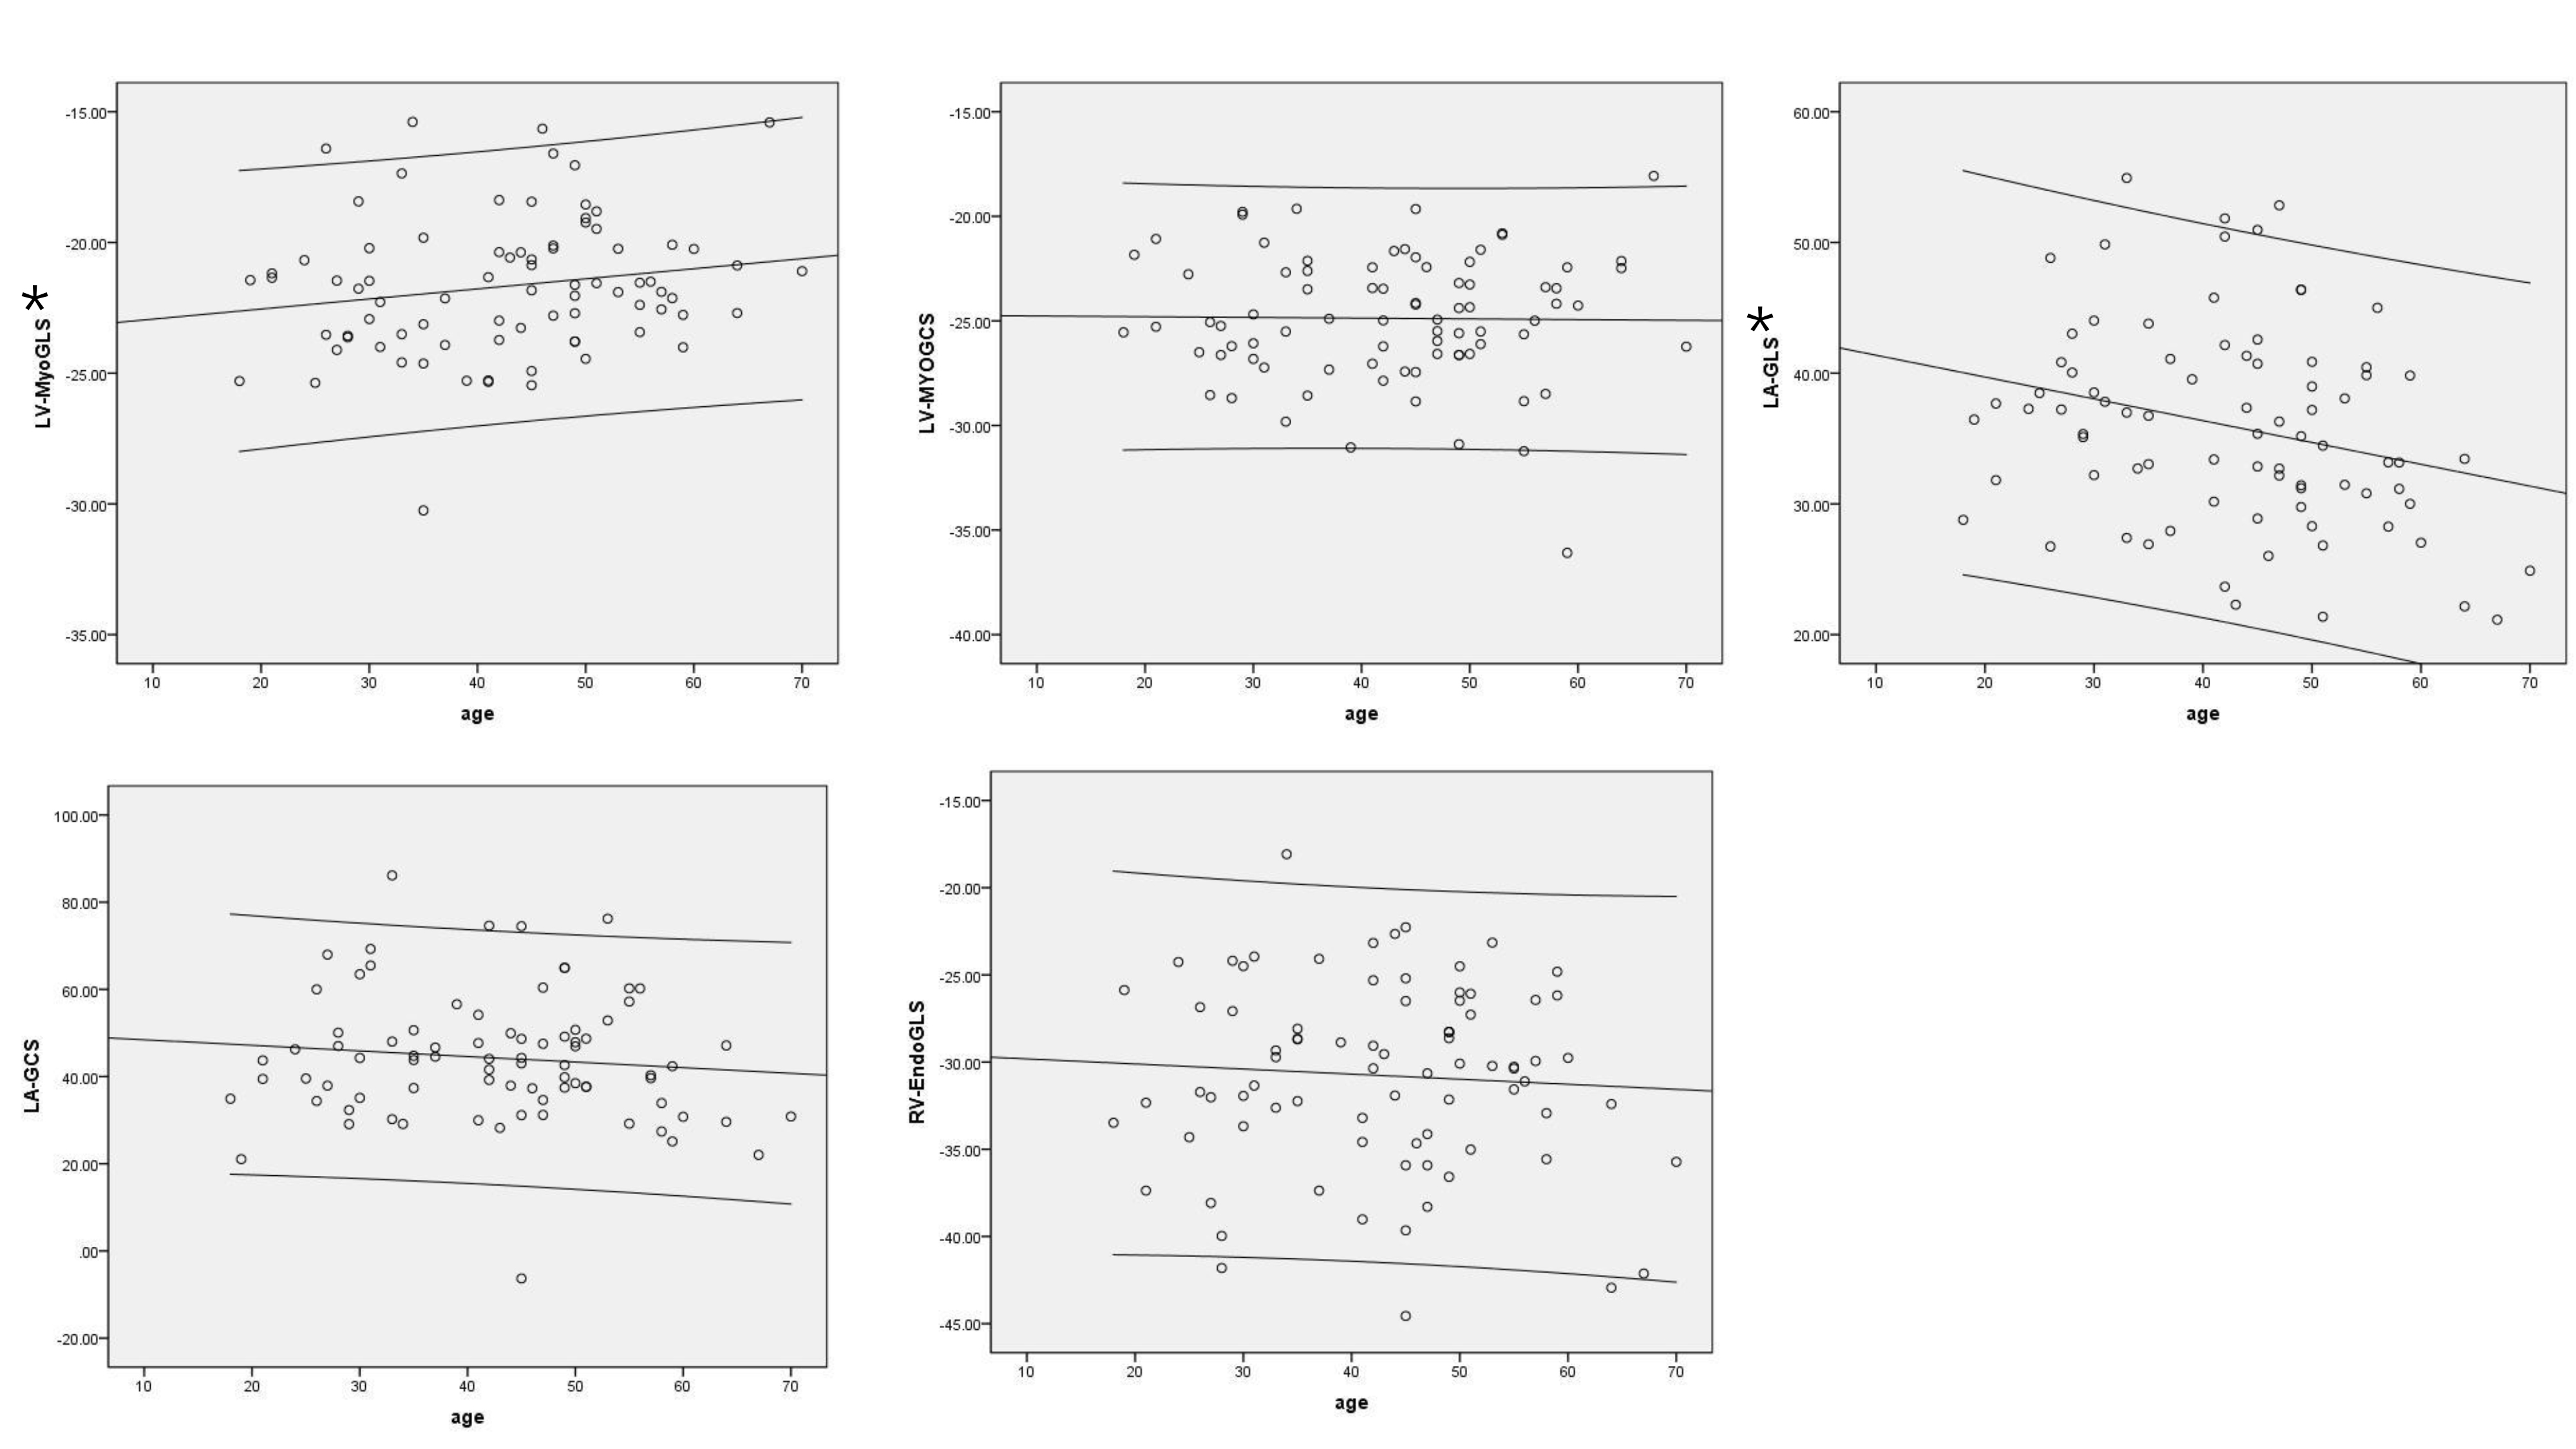
Fig 3 Age-related differences in CMR-FTI-derived global strain index.
The scatter diagram includes both the regression line with the respective 95% confidence curves and the 95% prediction curves. (* P<0.05)
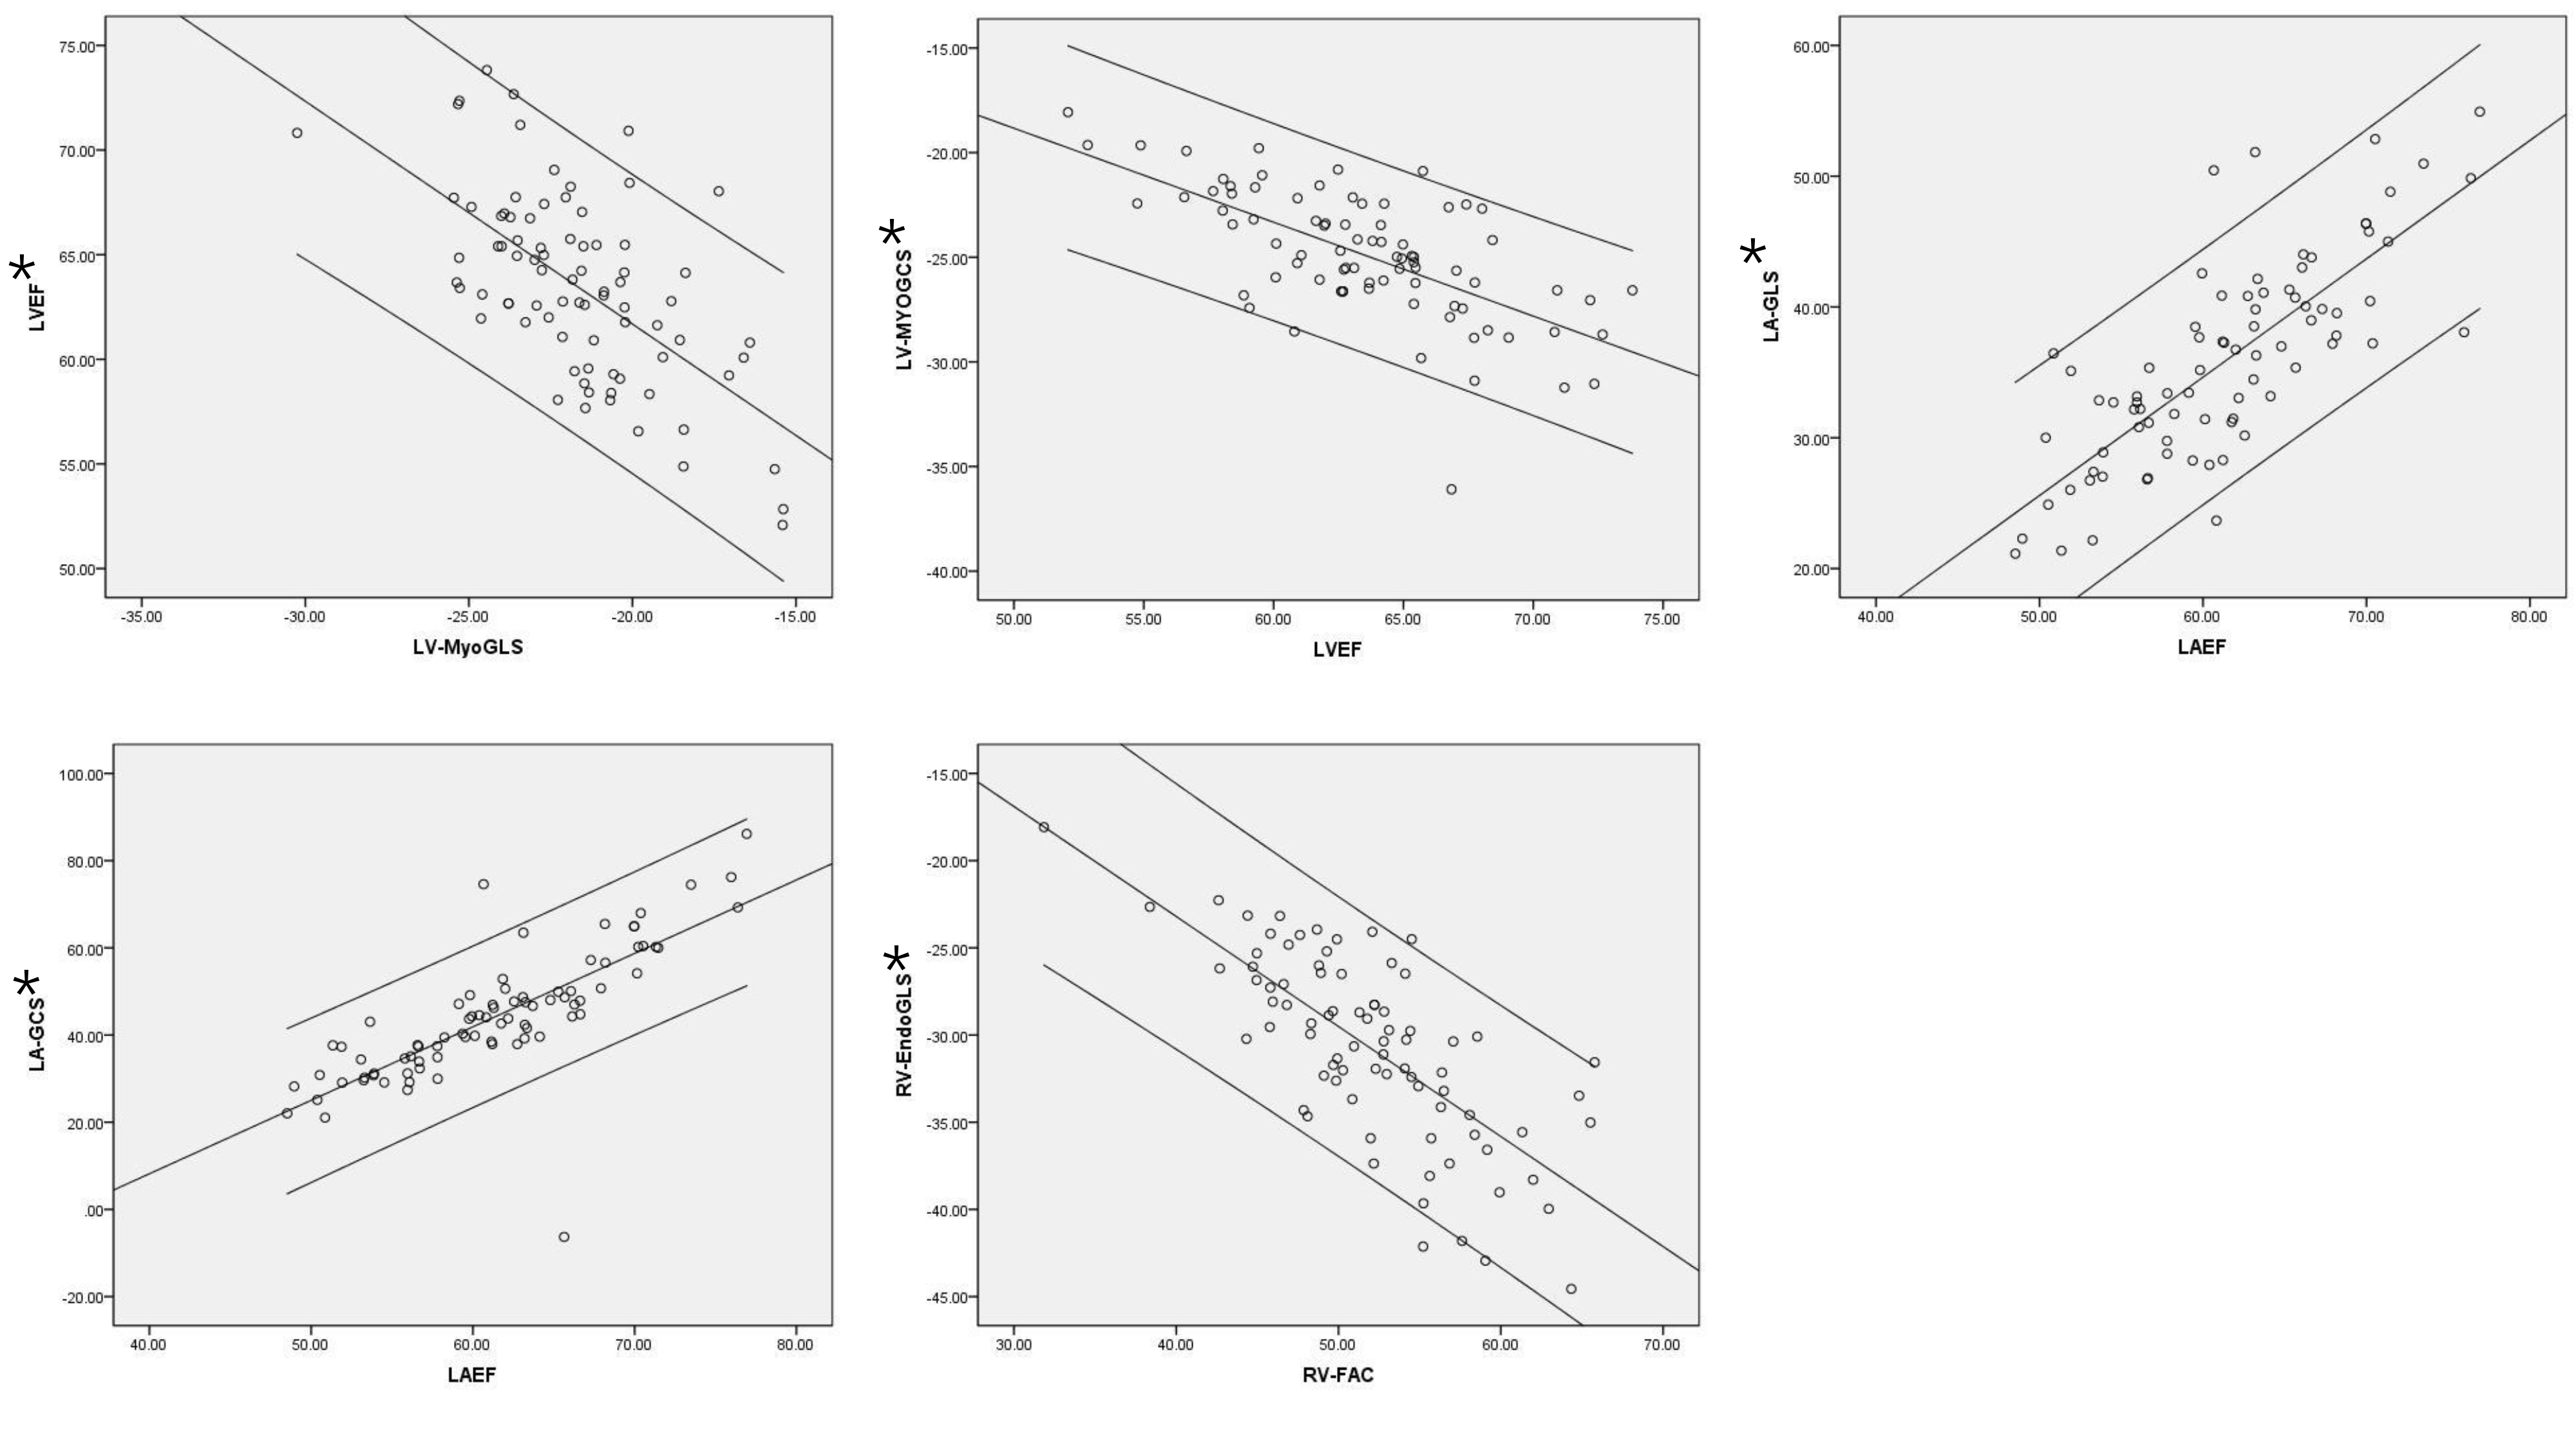
Fig 4 Correlation between the function parameters and global strainindex
The scatter diagram includes both the regression line with the respective 95% confidence curves and the 95% prediction curves. (*P<0.05)