4770
Regularized Curve Fitting Improves T1 Bias in Cardiac T2 Mapping1HeartVista, Los Altos, CA, United States
Synopsis
Bias error is studied in T2-prepared single shot SSFP cardiac T2 mapping. Phantom experiments showed that although centric phase encode ordering reduces bias from T1 relaxation during single shot readouts, a residual bias of approximately 20% remains in the 1000 ms T1 regime. A regularized, three parameter exponential fitting model reduces this bias and generates T2 maps with low variance using 4 echo times.
Introduction
T2 mapping has several established uses in cardiac MRI including detection of myocardial edema after acute injury [1,2], blood oxygenation measurement, and detection of iron overload. T2 mapping is typically performed during breath-holding using multiple T2-prepared single shot SSFP imaging sequences with varying echo times [2] followed by pixel-wise fitting to a two- or three-parameter exponential decay curve. Since a 2 or 3 heartbeat relaxation delay is necessary, this sequence is limited to a maximum of 3-5 echoes. Although two-parameter fitting improves convergence with a small number of data points, it is highly susceptible to T2 over-estimation due to to T1 recovery during the imaging readout, and this effect is more severe with shorter T1 tissues and longer readouts [3]. In this study, we show empirically that using a 200 ms single shot readout, two-parameter fitting over-estimates myocardial T2 values by as much as 20% at 1.5T even with centric encoding. Three parameter fitting compensates this bias at the cost of severe noise amplification. However, adding a Tikhonov penalty to the non-linear curve fitting by optimizing
|f(x,TE) - y|2 + λ|x|2
with
f(x,TE) = x1 + x2 exp(-TE/x3)
reduces in-vivo T2 estimation variance by 30% and produces T2 maps with radiologically-acceptable image quality even with only 4 echo times.
Methods
Sequence Design: an ECG-triggered cardiac T2 mapping sequence (T2C) similar to that described previously [2] was programmed in the HeartVista RTHawk system. Single shot readout parameters were TE/TR = 1.5/3 ms, 40 degree flip, 32x32 FOV, 200x180 matrix with a 2X under-sampling with SPIRiT reconstruction [4] and 20 calibration lines giving 65 phase encodes per image. Pre- and post-imaging catalyzation was performed with an 8-step Kaiser-Bessel RF amplitude modulation [5]. Adiabatic T2 prep modules using tan/tanh 180 waveforms (0.1 G nominal B1, 7ms RF duration, TBW = 35) similar to those described previously [6] were used. Echo times of 0, 30, 60, and 150 ms were acquired with a 2-heartbeat relaxation delay. Pixels were fit using the Levenberg-Marquardt implementation in the Eigen C++ library. All experiments were performed on a GE twin speed 1.5 T system. Phantom experiments: Multiple 30 mL chamber phantoms were constructed using varying concentrations of glycerol and agar agar in aqueous solution to vary T1 from ~40 ms to >2000ms and T2 from 5 ms to >1000 ms. A ground-truth spin echo acquisition was acquired (T2GT) in these phantoms with a single phase encode per TR, echo times of 12, 20, 40, 60, 100, 125, 150, 200, and 500 ms, a 192x256 matrix and 2 s TR. The cardiac T2 mapping acquisition (T2C) was acquired in the same phantoms with linear- and centric-encoding, and with 2- and 3-parameter fitting. Additionally, a MOLLI T1 mapping acquisition [7] was acquired in the same phantoms. T2GT, T2C, and T1 maps were aligned via affine transformation, binarized via thresholding to create masks, and a pixel-wise ratio of T2C/T2GT was plotted as function of T1. Image manipulations were performed with opencv [8]. 2 volunteers were scanned with the sequence as described in this section.Results
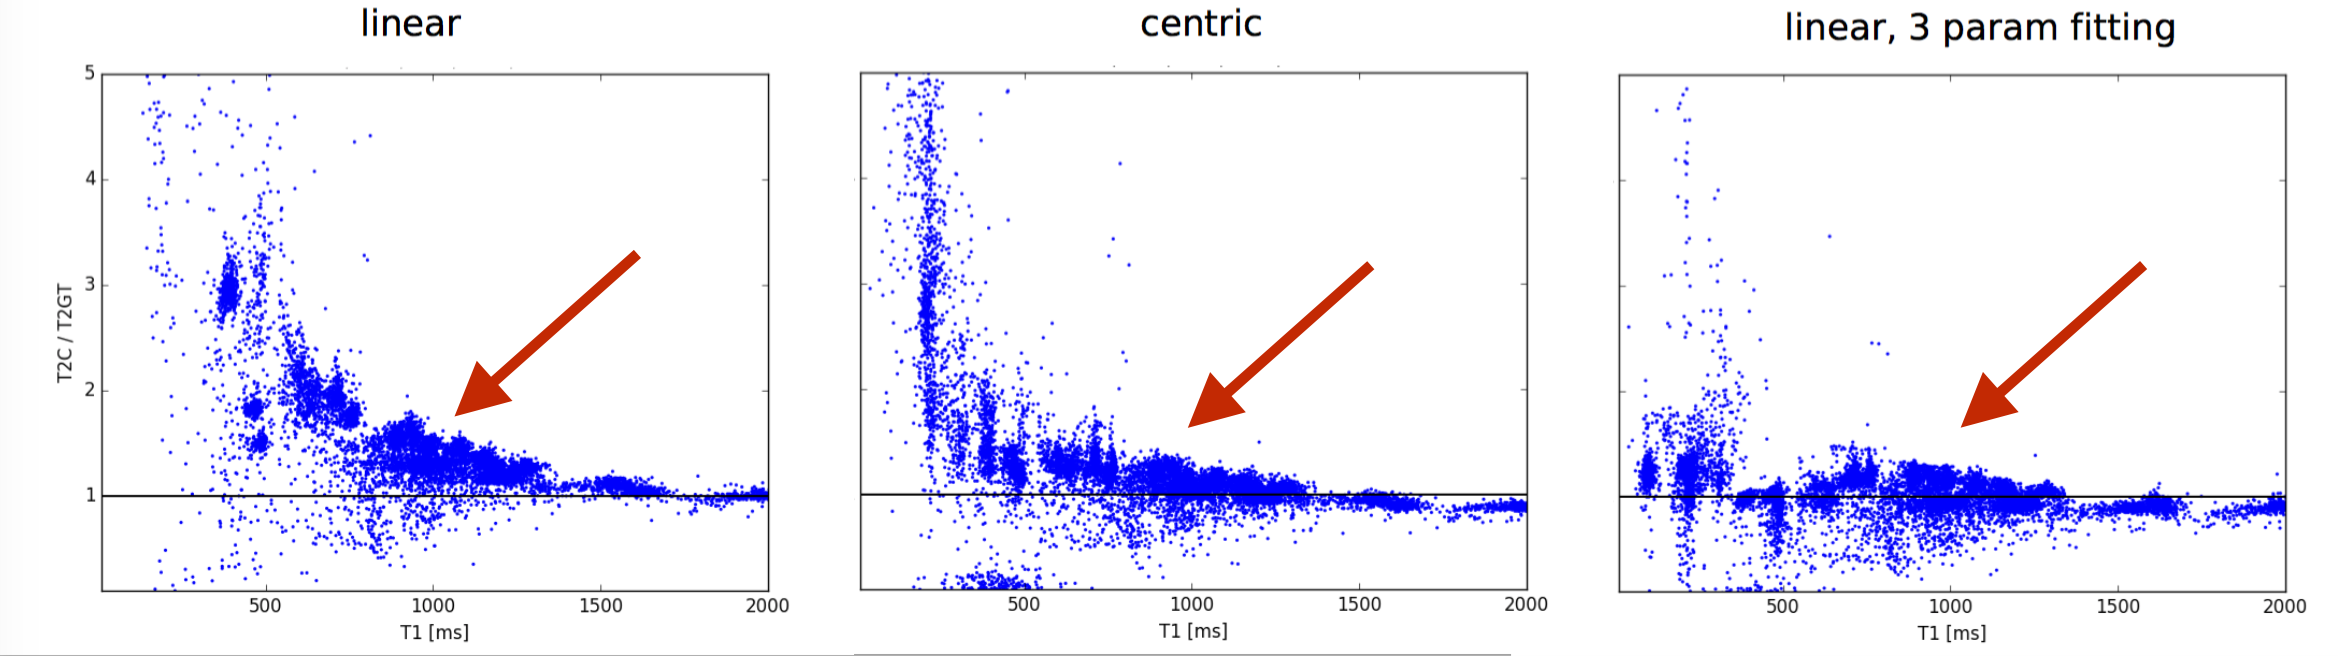
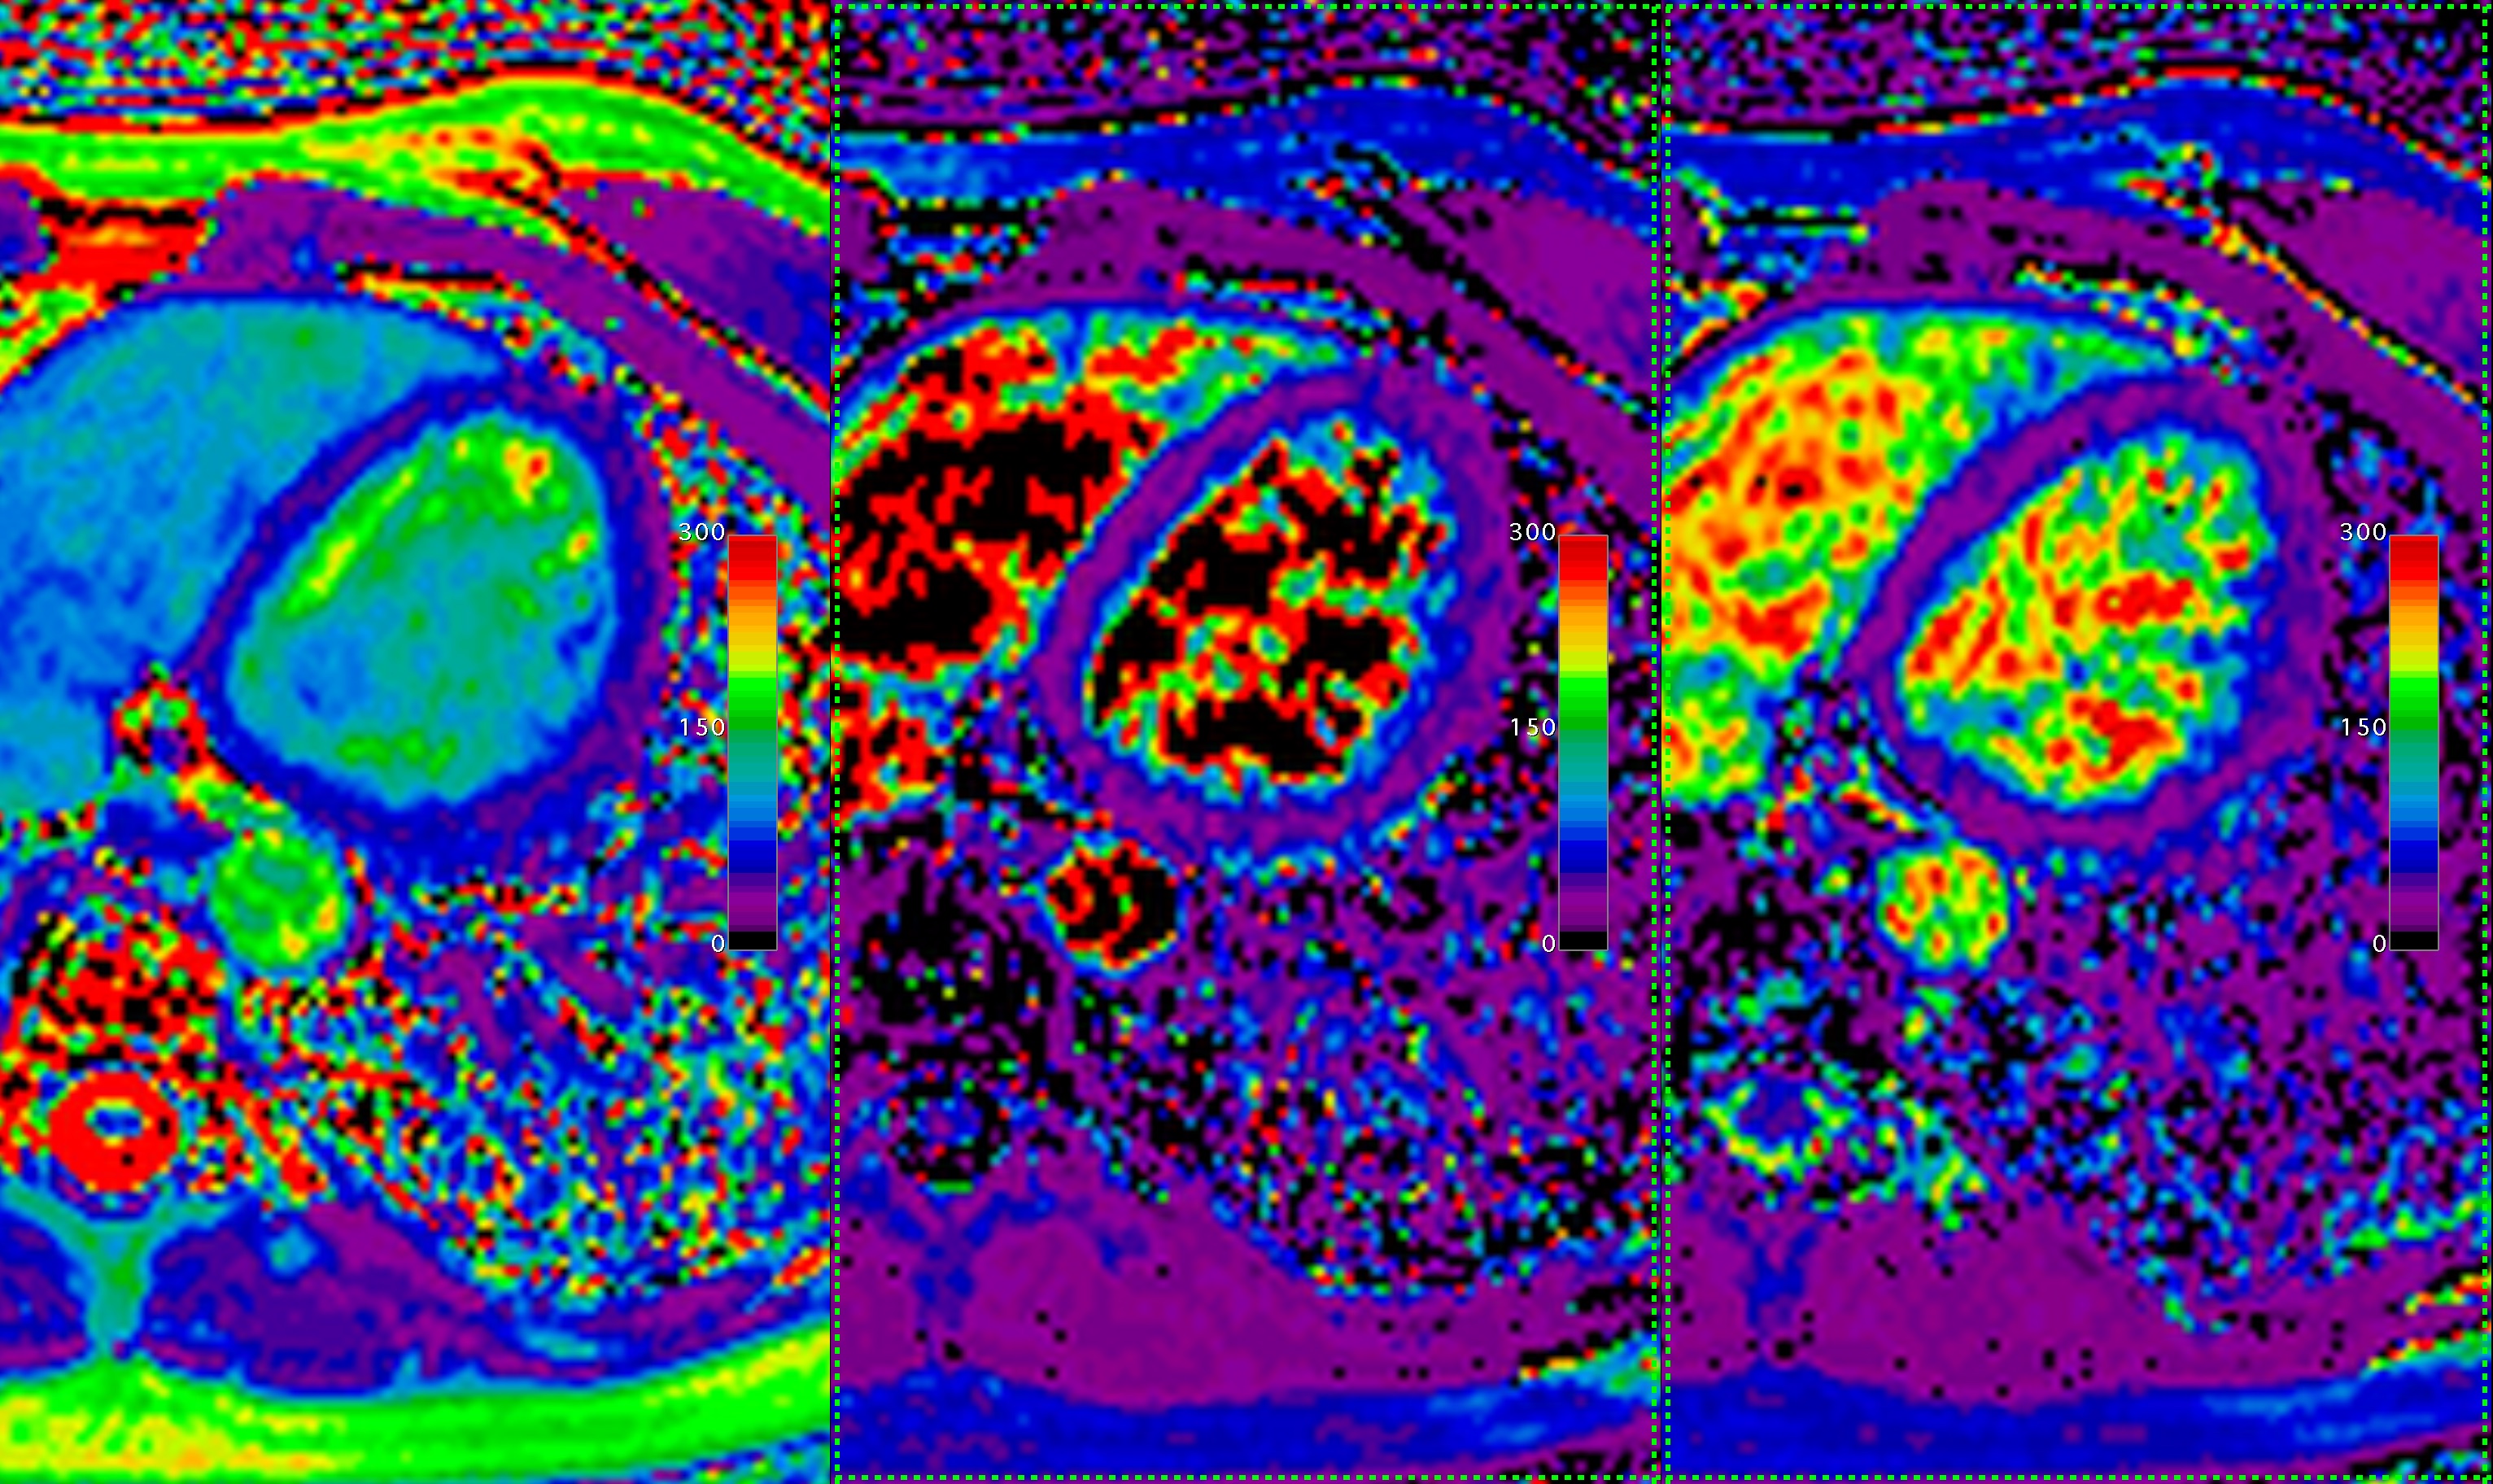
Figure 1 shows the T2 bias errors resulting from T1 recovery during imaging readout. With linear encoding, short T1 values cause severe T2 overestimation due to Mz recovery during readout. Centric encoding decreases this effect but still causes a ~20% over-estimation of T2 at T1 values of ~1000 ms. Regularized 3 parameter fitting moves the mean of the ratio closer to 1 in this regime (red arrows). Figure 2 shows in-vivo image comparisons between 2- and 3-parameter fitting (with and without regularization). 3 parameter fitting clearly addresses the problem of T2 over-estimation of short-T1 tissues as evidenced by the large change in fat T2. The 62 ms T2 estimate with 2 parameter fitting is consistent with established 1.5 T myocardial T2 values ranging from 42-58 ms (see Table 1 in reference [2]) and the approximately 20% over-estimation observed in centric encoding. Interestingly, the blood regions completely fail to converge with 3 parameter fitting but do converge to expected ~250 ms values with regularization. This is over a factor of 2 higher than that measured with 2 parameter fitting.Conclusion
Cardiac T2 maps may be generated with improved accuracy via regularized, 3 parameter fitting even when using only 4 echoes. Regularized 3 parameter fitting better compensates the T1 recovery over-estimation than centric encoding which may allow for longer single shot imaging readouts to achieve higher spatial resolution.Acknowledgements
No acknowledgement found.References
1) D. Verhaert, P. Thavendiranathan, S. Giri, G. Mihai, S. Ra- jagopalan, O. P. Simonetti, and S. V. Raman. Direct T2 quantification of myocardial edema in acute ischemic injury. JACC Cariovasc Imaging, 4(3):269–78, 2011.
2) S. Giri, Y.-C. Chung, A. Merchant, G. Mihai, S. Rajagopalan, S. V. Raman, and O. P. Simonetti. T2 quantification for improved detection of myocardial edema. J Cardiovasc Magn Reson, 11(56):1–13, 2009. 3) M. Akcakaya, T. A. Basha, S. Weingartner, S. Roujol, S. Berg, and R. Nezafat. Improved quantitative myocardial T2 mapping: Impact of the fitting model. Magn Reson Med, 74(1):93– 105, 2015.
4) M. Lustig and J. M. Pauly. SPIRiT: iterative self-consistent parallel imaging reconstruction from arbitrary k-space. Magn Reson Med, 64:457–471, 2010.
5) P. L. Roux. Simplified model and stabilization of SSFP sequences. J Magn Reson, 163(1): 23–37, 2003. 6) R. Nezafat, M. Stuber, R. Ouwerkerk, A. M. Gharib, M. Y. Desai, and R. I. Pettigrew. B1-insensitive T2 preparation for improved coronary magnetic resonance angiography at 3 T. Magn Reson Med, 55:858–864, 2006.
7) D. B. Messroghli, A. Radjenovic, S. Kozerke, D. M. Higgins, M. U. Sivananthan, and J. P. Ridgway. Modified look locker inversion recovery (MOLLI) for high-resolution T1 mapping of the heart. Magn Reson Med, 104(50):19773–7, 2007.
8) G. Bradski. The opencv library. Dr. Dobb’s Journal, 25:120– 126, 2000.
Figures