4768
Improving Precision of Arrhythmia-Insensitive Rapid Cardiac T1 Maps using a Non-Local Means Filter1Biomedical Engineering, Northwestern University, Chicago, IL, United States, 2Radiology Department, Feinberg School of Medicine, Chicago, IL, United States
Synopsis
Compared with other investigations, images produced from arrhythmia-insensitive rapid (AIR) cardiac T1 mapping pulse sequences contain significant random noise which limits the accuracy of quantitative measurements. Therefore, denoising filters were used to reduce noise present in the images. From our analysis, the non-local means filter was best able to reduce the amount of noise while still maintaining accurate T1 measurement data.
Introduction
Cardiac T1 mapping pulse sequences are gaining significant interest in cardiac MRI for assessment of diffuse myocardial fibrosis1-5. An arrhythmia-insensitive rapid (AIR) cardiac T1 mapping pulse sequence is particularly useful for imaging patients with arrhythmia and/or limited breath-hold capacity6. Compared with other cardiac T1 mapping pulse sequences (i.e., MOLLI7), AIR acquires only two images and thus produces lower precision. We sought to improve the precision of AIR T1 maps using denoising filters during post processing, while preserving edge sharpness. In this study, we compared the performance of three filters: (i) local means (LM), (ii) Gaussian, and (iii) non-local means (NLM)8, which has been reported to preserve edge sharpness.Methods
Image Acquisition
This study was conducted on previously collected AIR T1 maps acquired with balanced steady state free precession readout at 3T6 (mean age = 57 ± 13 years; 4 females; 8 males; spatial resolution ~1.9 mm x 1.9 mm) and wideband AIR T1 maps acquired with TurboFLASH readout at 1.5T9 (mean age = 52 ± 19 years; 3 females; 9 males; spatial resolution ~ 1.9 mm x 1.9 mm). Note that each T1 map is derived from one proton density (PD) image and one T1 weighted (T1 w) image.
Image Filtering
Using the Matlab software, images were filtered using LM (neighborhood = 3 x 3 pixels), Gaussian (σ = 0.5), or NLM (search window = 21 x 21 pixels, similarity window = 1 x 1 pixel, degree of filtering = 4) filtering. For each set of original and filtered images, corresponding T1 maps were created.
Quantitative Measurements
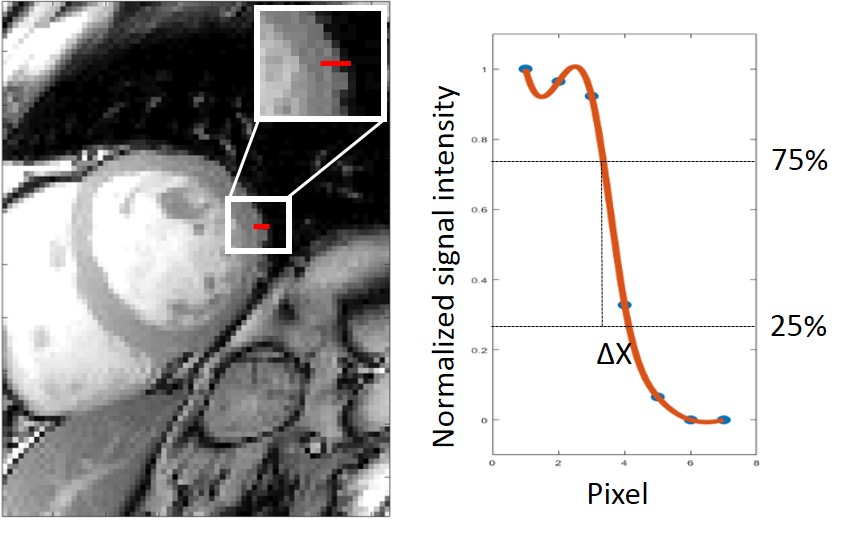
With the original image as the reference, the structural similarity index (SSIM) and normalized root mean square error (NRMSE) of filtered images were calculated, after excluding signal-free pixels. Edge profiles, from myocardium to lung, of each image was determined by measuring spatial distance (ΔX) distance between the 25th and 75th percentiles of the peak intensity value to estimate edge sharpness fidelity as shown in Figure 1. Averages and standard deviations (SD) of SSIM, NRMSE, ΔX were calculated for each group. T1 maps were analyzed by drawing the appropriate region of interest (ROI) for the myocardium on the original images to determine the T1 value and SD. The same ROI was used on the filtered images to determine the corresponding T1 measurements. For each quantitative metric (SSIM, NRMSE, ΔX, T1), the four groups (original, LM, Gaussian, NLM) were compared using ANOVA, where the Bonferroni correction test was made to compare each filtered image to the original (p < 0.05 was considered significant).
Results
SSIM, NRMSE, and ΔX
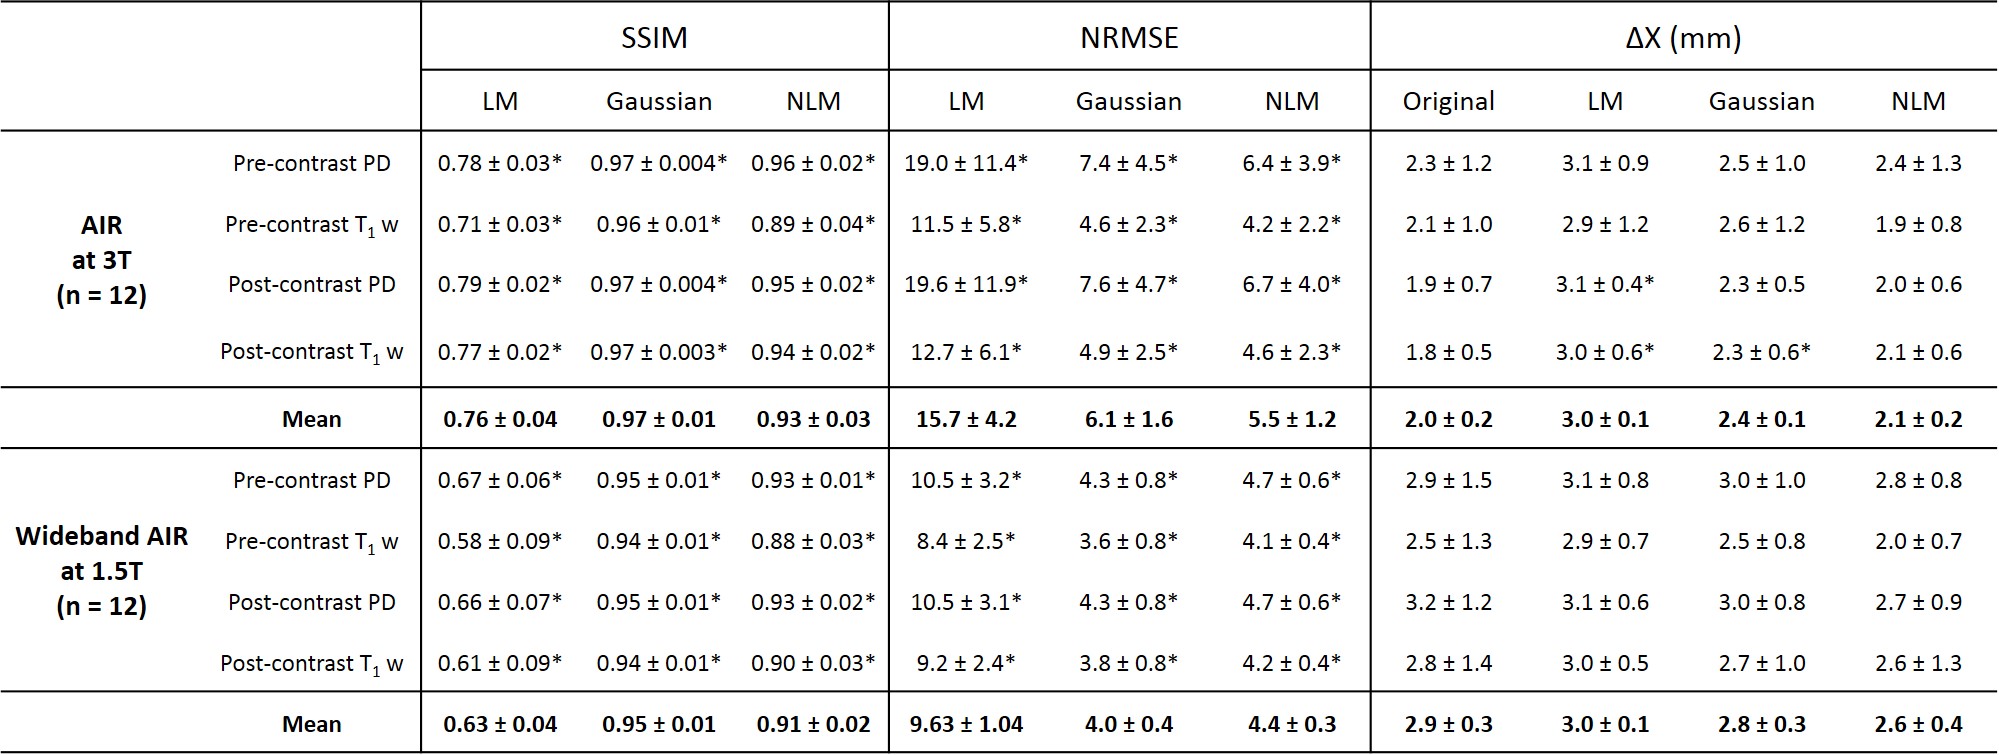
The mean SSIM for the LM filter is low (<0.8), whereas the mean SSIM for the Gaussian and NLM filters were both above 0.9 for AIR at 3T and wideband AIR at 1.5T (Table 1). The NLM filter produced the low NRMSE for both AIR (< 6%) and wideband (<5%) AIR images. For the edge sharpness metric, ΔX, was lowest for NLM compared to the other filters. This represents the least amount of smoothening for AIR images while an improvement in sharpness for wideband AIR images.
T1 Measurements
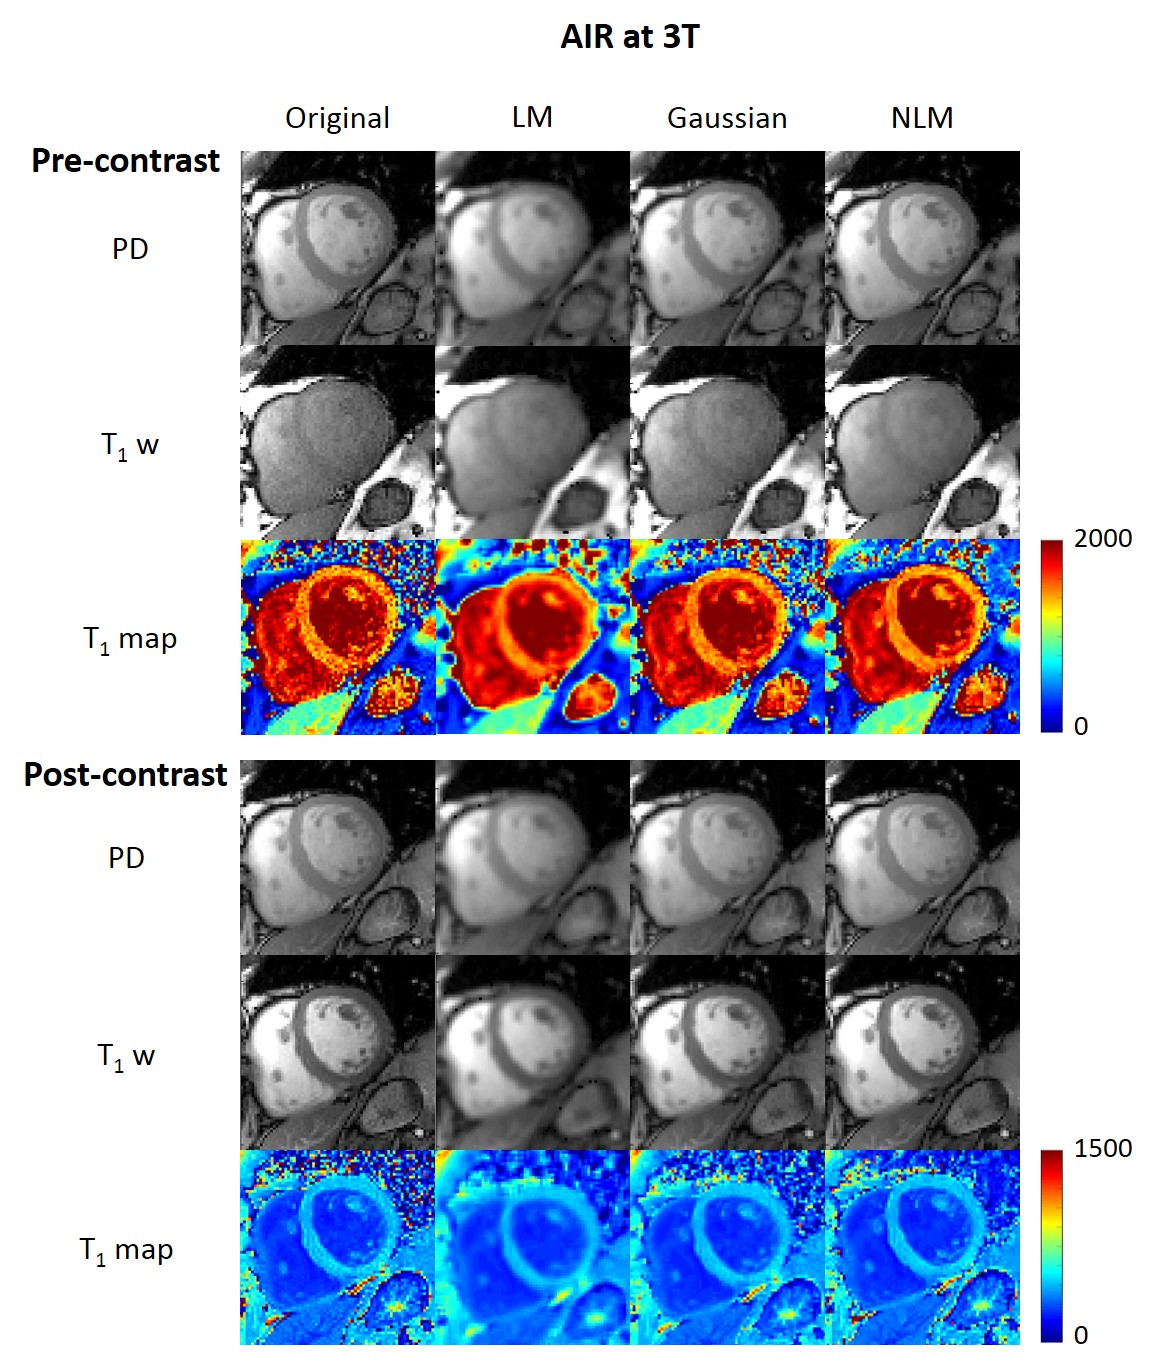
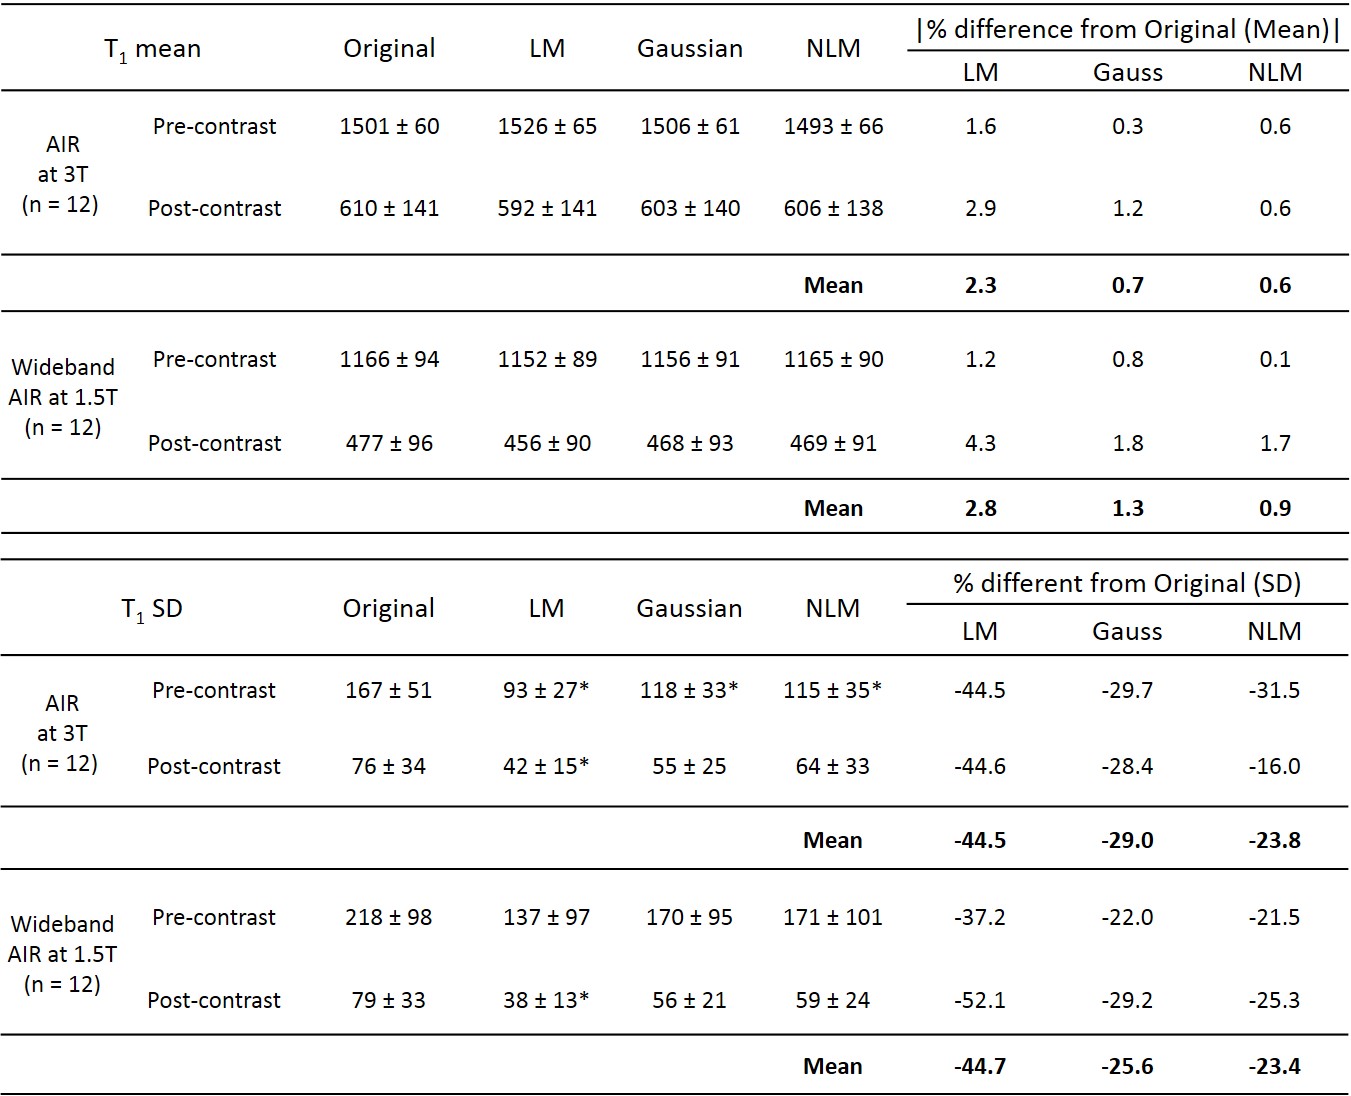
Figure 2 shows representative original and filtered images, as well as the corresponding T1 maps at 3T. Figure 3 shows the corresponding images and wideband T1 maps at 1.5T. Compared with other filters, NLM produced lower relative error (< 1%) for both AIR and wideband AIR T1 maps (Table 2). All three filters reduced SD in T1 measurements.
Discussion
This study shows that NLM filtering could be used to improve the precision of AIR cardiac T1 maps, without significant blurring. A future study is warranted to test whether NLM could be useful for denoising other cardiac parametric maps (T2, T2*).Acknowledgements
We would like to thank grant 1R01HL116895-01A1 for funding this work.References
1. Flett AS, Hayward MP, Ashworth MT, Hansen MS, Taylor AM, Elliott PM, McGregor C and Moon JC. Equilibrium contrast cardiovascular magnetic resonance for the measurement of diffuse myocardial fibrosis: preliminary validation in humans. Circulation. 2010;122:138-44.
2. White SK, Sado DM, Fontana M, Banypersad SM, Maestrini V, Flett AS, Piechnik SK, Robson MD, Hausenloy DJ, Sheikh AM, Hawkins PN and Moon JC. T1 mapping for myocardial extracellular volume measurement by CMR: bolus only versus primed infusion technique. JACC Cardiovascular imaging. 2013;6:955-62.
3. Miller CA, Naish JH, Bishop P, Coutts G, Clark D, Zhao S, Ray SG, Yonan N, Williams SG, Flett AS, Moon JC, Greiser A, Parker GJ and Schmitt M. Comprehensive validation of cardiovascular magnetic resonance techniques for the assessment of myocardial extracellular volume. Circulation Cardiovascular imaging. 2013;6:373-83.
4. Arheden H, Saeed M, Higgins CB, Gao DW, Bremerich J, Wyttenbach R, Dae MW and Wendland MF. Measurement of the distribution volume of gadopentetate dimeglumine at echo-planar MR imaging to quantify myocardial infarction: comparison with 99mTc-DTPA autoradiography in rats. Radiology. 1999;211:698-708.
5. Moon JC, Messroghli DR, Kellman P, Piechnik SK, Robson MD, Ugander M, Gatehouse PD, Arai AE, Friedrich MG, Neubauer S, Schulz-Menger J and Schelbert EB. Myocardial T1 mapping and extracellular volume quantification: a Society for Cardiovascular Magnetic Resonance (SCMR) and CMR Working Group of the European Society of Cardiology consensus statement. Journal of cardiovascular magnetic resonance : official journal of the Society for Cardiovascular Magnetic Resonance. 2013;15:92.
6. Fitts M, Breton E, Kholmovski EG, Dosdall DJ, Vijayakumar S, Hong KP, Ranjan R, Marrouche NF, Axel L and Kim D. Arrhythmia insensitive rapid cardiac T1 mapping pulse sequence. Magn Reson Med. 2013;70:1274-82.
7. Messroghli DR, Radjenovic A, Kozerke S, Higgins DM, Sivananthan MU and Ridgway JP. Modified Look-Locker inversion recovery (MOLLI) for high-resolution T1 mapping of the heart. Magn Reson Med. 2004;52:141-6.
8. Buades A, Coll B and Morel JM. A non-local algorithm for image denoising. Proc Cvpr Ieee. 2005:60-65.
9. Hong K, Jeong EK, Wall TS, Drakos SG and Kim D. Wideband arrhythmia-Insensitive-rapid (AIR) pulse sequence for cardiac T1 mapping without image artifacts induced by an implantable-cardioverter-defibrillator. Magnetic Resonance in Medicine. 2015;74:336-345.
Figures